1. Introduction
Word pairs like English banana and Danish banan are clearly cognate, referring to the same type of entity and showing a high degree of formal overlap. A large number of studies on the bilingual lexicon show that such cognate words differ from non-cognate words in both first and foreign language processing. But how about cases like English address, which should be translated as the cognate Danish form adresse when referring to where a person lives, but is more appropriately translated as the non-cognate Danish form tale if referring to a speech? What happens when a word in an L2 text has several possible translations in the L1, only one of which is cognate? And how about translation equivalents like Wednesday/onsdag where from a synchronic perspective one morpheme (-day/-dag) is cognate and another (Wednes-/ons-) is not? Such phenomena are frequently observed in authentic texts and the question arises how cognate status affects processing when the complexities of actual communication, whether written or oral, are taken into consideration.
This question is addressed in the present study, where a group of Danish participants with high proficiency in English as their L2 read two authentic texts in English while their eye-movements were tracked. Reading times were analysed for target words in the English texts – which included the words mentioned in the previous paragraph and other similarly complex cases (see Appendix A and B) – to investigate how cognates are processed relative to non-cognates in natural text. It was studied whether the context affects what counts as a cognate, by defining cognateness either with reference to translation equivalents that are appropriate in the context or with reference to any word in Danish, and whether partially cognate morphologically complex words are read in the same way as simple cognates. The investigation of cognate words in authentic texts is made possible by the use of mixed-effects regression models that allow the statistical control of a range of variables that affect reading, including word predictability indexed by n-gram language models.
Leaving the complexities in coherent texts aside for a moment, the evidence from experiments presenting words in isolation shows that, for cases like banana–banan, cognate words in the non-target language are rapidly and automatically activated in both visual and auditory word recognition and in word production. This activation of words in the non-target language may be harmful or helpful, depending on the task: while most cognate effects are facilitatory, some tasks result in inhibition. In language decision to visual stimuli, for example, Dijkstra, Miwa, Brummelhuis, Sappelli and Baayen (Reference Dijkstra, Miwa, Brummelhuis, Sappelli and Baayen2010) found that words that are cognate though not necessarily identical are more difficult to categorise as belonging to one language or another than non-cognates. Stronger competition was also observed for cognates than for non-cognates in auditory word recognition by Blumenfeld and Marian (Reference Blumenfeld and Marian2007) using the visual world paradigm.
In contrast, Dijkstra et al. (Reference Dijkstra, Miwa, Brummelhuis, Sappelli and Baayen2010; see also e.g. Duyck, Van Assche, Drieghe & Hartsuiker, Reference Duyck, Van Assche, Drieghe and Hartsuiker2007; Sánchez-Casas & García-Albea, Reference Sánchez-Casas and García-Albea2005; Van Hell & Dijkstra, Reference Van Hell and Dijkstra2002) observed facilitation for cognates in visual lexical decision: words are easier to make a correct yes-response to when occurring in similar forms across both languages of the bilingual. One component in this effect could be that cognate words are more familiar than their frequency in just one language would indicate and therefore easier to recognise. An advantage is also found for cognate translations as opposed to non-cognate translations in studies using the priming manipulation including masked priming (e.g. De Groot & Nas, Reference De Groot and Nas1991; Sánchez-Casas & García-Albea, Reference Sánchez-Casas and García-Albea2005; Voga & Grainger, Reference Voga and Grainger2007). Additionally, an advantage for cognate words is observed in word naming (e.g. Costa, Caramazza & Sebastián-Gallés, Reference Costa, Caramazza and Sebastián-Gallés2000), again suggesting easier access to the lexical entry, as well as faster production, of words that are similar across languages. Depending on proficiency level, the cognate advantage arises when reading cognates both in the L1 (Van Hell & Dijkstra, Reference Van Hell and Dijkstra2002, who found that a certain proficiency in the foreign language was necessary for facilitation in the L1 to arise) and in the L2, though there is a tendency for the facilitation to be larger in the L2 (e.g. Costa et al., Reference Costa, Caramazza and Sebastián-Gallés2000).
The advantage for cognate words also arises when cognate words are embedded in L2 sentence contexts, but here the effect is modulated by how predictable the word is: when a word is not predictable from the context, cognate facilitation is similar to what is observed in tasks presenting words in isolation, but the facilitation is attenuated or disappears for highly predictable words (Duyck et al., Reference Duyck, Van Assche, Drieghe and Hartsuiker2007; Libben & Titone, Reference Libben and Titone2009; Schwartz & Kroll, Reference Schwartz and Kroll2006; Van Hell & De Groot, Reference Van Hell and De Groot2008). For L1 sentences, cognate effects are reported by Van Assche, Duyck, Hartsuiker and Diependaele (Reference Van Assche, Duyck, Hartsuiker and Diependaele2009). Although these experiments all include sentence context, they rely on the same type of straightforward cognates as most isolated-word experiments. In contrast, the present study investigates different types of cognates embedded in authentic texts and takes context into account in the very definition of cognateness, by considering cognateness both relative to translation equivalents and relative to any word in the L1.
Arguably the most central theoretical questions addressed by research on cognate words concern selective access and separate vs. shared representations in the two languages of the bilingual. These two questions are often conflated, probably because they are empirically difficult to tease apart (Brysbaert & Duyck, Reference Brysbaert and Duyck2010), but they actually represent two different issues (Van Heuven, Dijkstra & Grainger, Reference Van Heuven, Dijkstra and Grainger1998): though usually associated with the idea of shared lexicons for the two languages, non-selective access may be to separate as well as shared lexicons. The research on cognates summarised above, along with a number of other studies using both cognates and other types of stimuli, provides solid evidence that lexical access is not selective with respect to language, i.e. words in the non-target language are activated along with words in the language currently being processed. On the issue of separate or shared lexicons, the evidence is more limited, though Van Heuven et al. (Reference Van Heuven, Dijkstra and Grainger1998) showed orthographic neighbourhood effects across languages, suggesting shared representations.
Thus, there is strong evidence that words in non-target languages are activated in word recognition, but because of the focus on straightforward cognates like banana–banan, there are at least two issues about which words are activated and why that are unclear. The aim of the present study is to address these issues: Firstly, what is the role of the context on which cognates are activated? And secondly, does the morphological structure of cognates affect their activation? Both questions arise from the consideration of the complexities of authentic texts.
The first question is addressed by considering the role of context in the definition of cognateness. I investigated whether context-appropriate cognates – such as the Danish adresse when the English address refers to place of residence – play a larger role than cognates that were not appropriate in the context, e.g. the Danish word adresse when the English word address refers to a speech. Even though the activation of cognates in the L1 is automatic when reading in the L2, context is hypothesised to restrict the automatic activation such that mainly context-appropriate cognates are relevant. This hypothesis is based on the evidence from L1 reading of lexically ambiguous words (e.g. Duffy, Morris & Rayner, Reference Duffy, Morris and Rayner1988; Kambe, Rayner & Duffy, Reference Kambe, Rayner and Duffy2001; Peleg, Giora & Fein, Reference Peleg, Giora, Fein, Noveck and Sperber2004; Tabossi, Reference Tabossi1988; Tabossi & Zardon, Reference Tabossi and Zardon1993). The relative frequency of the different translations may also play a role, as it does for the different senses of ambiguous words in L1 reading (Duffy et al., Reference Duffy, Morris and Rayner1988; Kambe et al., Reference Kambe, Rayner and Duffy2001), but this cannot be straightforwardly investigated: which possible translations are activated cannot be controlled and no information exists on the relative frequency of translations as translations.
The automaticity of cognate activation was further investigated through a task manipulation: participants were asked to read either for comprehension or for translation (for the use of a similar task, see Ruiz, Paredes, Macizo & Bajo, Reference Ruiz, Paredes, Macizo and Bajo2008). The purpose of this manipulation was to investigate whether an explicit focus on the L1 (the target language of the hypothetical translation) and on L1–L2 correspondences would affect the role of cognateness in reading. If cognate effects are the same in the two tasks, it provides further evidence of the automaticity of cognate activation, also in authentic texts.
The second question concerns how morphologically complex cognates are recognised. Sánchez-Casas and García-Albea (Reference Sánchez-Casas and García-Albea2005) report priming effects for morphemes that are cognate between Spanish and Catalan, indicating that the relevant unit of correspondence between the L1 and L2 lexicons may be the morpheme (for a similar theoretical position, see Cristoffanini, Kirsner & Milech, Reference Cristoffanini, Kirsner and Milech1986). However, Sánchez-Casas and García-Albea do not address the fact that many morphologically complex words – indeed the majority of complex words in the L2 texts used in the present experiment – contain both cognate and non-cognate morphemes, as is the case for instance for Wednes-day (Danish ons-dag) and deep-ly (Danish dyb-t). In the present experiment, very few of the complex words in the texts were fully cognate with words in the L1. This holds even though Danish and English are relatively closely related languages, suggesting that this phenomenon may be quite frequent in the L2 input of bilinguals. The question arises how such partially complex words are recognised. Based on the literature outlined above, we would expect some facilitation for partially cognate words, if the constituent morphemes are recognisable units for the L2 readers, as indicated for instance by Scheutz and Eberhard's (Reference Scheutz and Eberhard2004) study of the German–English agentive suffix -er, and by the work of Sánchez-Casas and García-Albea. However, it may be that such facilitation is smaller for the group of complex words, which are mostly only partially cognate, than for simple words that are fully cognate.
Before presenting the experiment, we turn to a more detailed discussion of how to define cognates in the context of authentic text, with reference to the L2 English texts read by the L1 Danish participants in the experiment.
2. Assessing cognateness
A consequence of using authentic texts as stimuli is that the context can and must be taken into account. This is an advantage because natural texts exhibit a range of different types of cognate words that L2 readers are also likely to encounter in real life and that may be more or less cognate depending on the context in which they occur. However, the question arises how exactly to take context into account when assessing cognateness. One possibility is to determine the cognateness of the target word with the single best translation in the context, but given the large variation in the translation of even rather basic words and constructions (Munday, Reference Munday2012), the “best translation in the context” may turn out to be an elusive construct.
Secondly, one can consider several possible translations that may be appropriate in the given context and determine whether the target is cognate with any of these. In a reading study like the present one, using such a measure may be more appropriate than considering only a single translation equivalent, since one could expect activation of more than one appropriate word in the context.
A third possibility is to disregard the context and consider the cognateness of the target word with any word in the non-target language. On the one hand, this has the advantage of coming close to some a priori understanding of what cognate means; on the other hand, it has the consequence that words may be counted as cognate when the cognate translation is inappropriate or even misleading in the context. This would be the case, for instance, if English address was considered a true cognate with Danish even in a context like that of the experimental texts (see Appendix B) where the appropriate translation is tale “speech” rather than adresse “place of residence”. The hypothesis relating to the issue of context is that defining cognateness relative to words that are appropriate in the context – the second possibility outlined – is the most meaningful way of investigating the effect of context in reading of authentic texts.
One advantage of considering the cognateness of target words with a single translation equivalent – and of the usual approach of selecting experimental items for which cognateness may be straightforwardly defined – is that it allows a fine-grained assessment of the formal overlap between the L2 target and its L1 translation equivalent. The degree of formal similarity has been found to affect the size of cognateness effects by, for instance, Dijkstra et al. (Reference Dijkstra, Miwa, Brummelhuis, Sappelli and Baayen2010). In the present study, Van Orden's (Reference Van Orden1987) graphic similarity measure was employed, using the web application of Hartsuiker (Reference Hartsuiker2010). Problems remain when deciding which translation equivalent to determine the graphic similarity to, but these were somewhat reduced by using the highest-ranked translation in a English–Danish dictionary (Gyldendal, 2010) which was also appropriate in the context.
For the two other cognateness definitions which potentially always – and in practice often – consider a number of possible translations, such one-to-one assessment is not possible. Instead, I operated with human assessment for both measures. With two colleagues who are professional Danish–English translators, I determined whether each target word contained morphemes that were cognate with morphemes in a word that could be an appropriate translation in the context (though not necessarily the only appropriate translation), then with any word in Danish. We considered both what would constitute an appropriate translation equivalent in the context, and the semantic and formal overlap of each English target with the relevant Danish words. In this way, we arrived at two binary measures for each target word: cognate or not cognate with one (of potentially several) appropriate translation equivalent(s), and cognate or non-cognate with any word in Danish. For instance, in the experimental texts, the English word address is used with reference to a speech. This means that it is not cognate with any appropriate translation equivalent in the context, while it is defined as cognate with any Danish word, since one meaning of the word address, that of place of residence, is cognate with its Danish translation equivalent adresse. In other words, for the cognateness with any word in Danish, form and meaning overlap between English and Danish were decisive, while the specific meaning of the target word in its English context and the appropriateness of its Danish translation equivalents were disregarded. Moreover, for this measure, semantic similarity was interpreted relatively broadly, counting targets as cognate if they overlapped formally with one or more words that were semantically related to the target, without necessarily being direct translations of them.
In our definitions of cognateness, we focused on the orthographic similarity between the words in the two languages, but also to some extent considered the sound of the words, because phonology is known to be activated to some extent even during silent reading (for an overview, see Frost & Ziegler, Reference Frost and Ziegler2007; for various other views on this subject, which in the current context is of practical rather than theoretical interest, see e.g. Alario, Cara & Ziegler, Reference Alario, Cara and Ziegler2007; Braun, Hutzler, Ziegler, Dambacher & Jacobs, Reference Braun, Hutzler, Ziegler, Dambacher and Jacobs2009; Frost, Reference Frost1998; Grainger & Jacobs, Reference Grainger and Jacobs1996; Van Orden & Kloos, Reference Van Orden, Kloos, Snowling and Hulme2005); because degree of phonological overlap may affect cognate effects (Dijkstra et al., Reference Dijkstra, Miwa, Brummelhuis, Sappelli and Baayen2010; Kroll & Stewart, Reference Kroll and Stewart1994); and because the subjects were highly proficient L2 users of English who would be well acquainted with Danish–English sound and spelling correspondences.
As exemplified by the English–Danish translation pair Wednesday–onsdag (which occurs in both experimental texts), we may encounter words that are not fully cognate with their translation equivalent(s) but contain one or more morphemes that are clearly cognate. This phenomenon is relatively frequent, especially for inflectional forms. These words do not fit the usual definition of cognates. However, target words in which a content morpheme is clearly cognate with a morpheme in the non-target language seem intuitively more similar to cognates than to non-cognates. If we want to look at morphologically complex words at all – which makes sense, given their ubiquity – we need to consider cognateness with a content morpheme rather than cognateness with a whole word. The inclusion of such words as cognate allows us to address the second research question, which concerns how cognate morphemes are recognised during the reading of authentic texts.
In sum, three cognateness measures were determined for the words in the two experimental English texts: graphic similarity between each target word and a single appropriate translation equivalent; cognate/non-cognate with a content morpheme in one of potentially several appropriate translation equivalents; and cognate/non-cognate with a content morpheme in any word in the non-target language, Danish. The effects of these cognateness measures on reading times were investigated in the experiment reported below. Additionally, the number of translation equivalents for each target word was determined using the number of senses for the word in a dictionary (Gyldendal, 2010), as words with many possible translations may be harder to process in translation-related tasks (e.g. Laxén & Lavaur, Reference Laxén and Lavaur2010; Tokowicz & Kroll, Reference Tokowicz and Kroll2007); this measure was not significant in any of the analyses and is not further discussed.
3. Experiment
3.1 Method
Participants
Nineteen MA students of translation at the Copenhagen Business School (18 females, one male; a skewed distribution that is characteristic of translation courses in Denmark) participated in the experiment, reading two texts in English. The participants make up a relatively homogeneous group of advanced L2 learners, all with Danish as their first language and English as a highly proficient second language. All had learnt English in the Danish school system from age nine or ten years. They were all in the process of taking an MA in translation between English and Danish, and some had worked professionally with translation between these two languages. Various participant characteristics, such as age, self-rating of English proficiency, and whether they had any professional experience were investigated but not found to have a significant effect on reading times.
Data from four participants were discarded due to poor eye-tracking quality. For each eye-tracking sample, the binocular eye-tracker may find one or both eyes. For the participants that were not included in the analyses, the tracker found the eyes on fewer than 50% of samples, i.e. both eyes on fewer than half the samples, one eye on fewer than all samples or, as would be the case in practice, a combination of the two. As participants were reading full pages of text and changing between pages by button press, some samples were expected to be missed. The participants’ vision was not used as an exclusion criterion before running the experiment, and one of the participants whose data were discarded did not have normal or corrected-to-normal vision. The data from the remaining 15 participants, who all had normal or corrected-to-normal vision, were analysed as described in Section 3.2 below.
Apparatus
The experiment was run on a Tobii T120 eye-tracker integrated into a 17ʺ monitor, with a resolution of 1280 × 1024 pixels. The T120 is a remote binocular eye-tracker with cameras built into a panel below the screen. It samples at a rate of 120 Hz, with an accuracy of 0.5°. Tracking is based on reflections of infrared light from the tracker on the participant's corneas.
The texts were presented in 18-point Tahoma with double line spacing, white on black, using Tobii Studio software. Participants used a chinrest to reduce head movement during the experiment.
Procedure
Participants were instructed orally about the task before their eyes were calibrated using a five-point grid. After a brief written repetition of the instruction, the experiment started. The participants moved forward from one page of text to the next by pressing the space bar on a keyboard. The experiment was run after a similarly brief experiment that involved the reading of two Danish texts. Together, the two experiments took about ten minutes, including instructions and debriefing. After the experiment, the participants answered two questions about the content of the English texts and filled in a brief questionnaire about their language background.
Task
The participants were asked to read two texts in English while their eye-movements were tracked. The first text was read for comprehension. For the second text, participants were told that they would be translating the text afterwards and asked to think about possible translations while reading. After reading, the participants were informed that the translation would not be necessary. If cognate effects are the same whether or not the participant is asked to focus on L1–L2 correspondences, it supports the automaticity of cognate activation.
Texts and items
The texts were extracts from two articles on the same topic from English-language news outlets and are reproduced in Appendix B. The texts were edited to remove most of the quotes in the texts and to make the spelling conform to British English conventions. Their length was 263 and 266 words, each presented on two separate pages. The texts were equally complex, as indicated by the LIX index of text complexity (Björnson, Reference Björnson1968, cited by Klare, Reference Klare and Pearson1984). Each text was used an equal number of times for each task.
From these two texts, 105 unique items were chosen, based on a number of considerations. All items were content words of different word classes for which morphological analysis was straightforward. Each word contained between one and three morphemes. No words at the beginning or end of lines or pages were included. Words that are always false friends between English and Danish were excluded. Forty-two items were cognate with an appropriate translation equivalent in the context, while 63 were not; of the 63 items in the latter category, 29 were cognate with a word which was not appropriate in the context. The items are listed in these categories in Appendix A.
Predictors
A regression design is ideally suited to the naturalistic set-up of the experiment because it allows statistical control of a range of predictors that cannot be controlled experimentally. In addition to the different measures of cognate status described in Section 2, these predictors included participant characteristics (see above), various inherent characteristics of items, and predictors relating to item context.
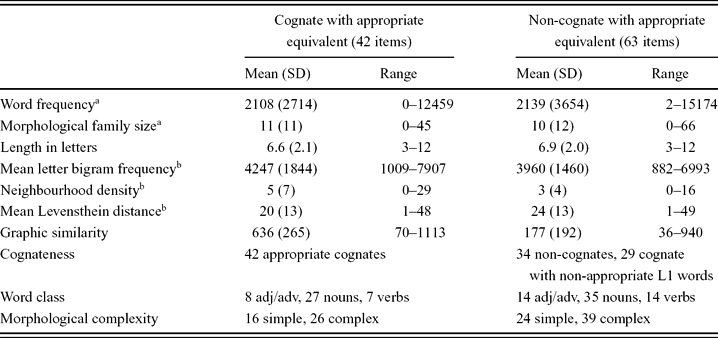
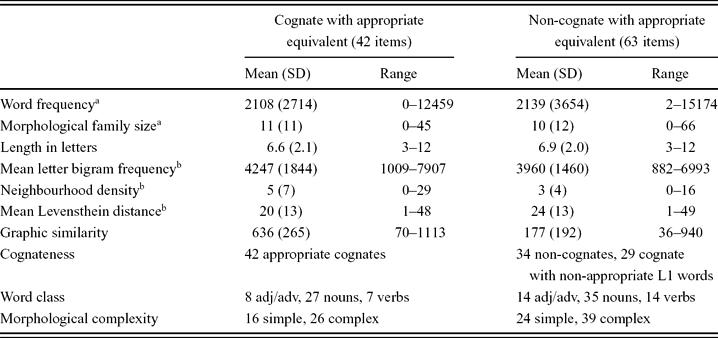
The relevant inherent characteristics of items were their word form frequency and morphological family size (a type count of the derived words and compounds containing the stem of the item) from CELEX (Baayen, Piepenbrock & Gulikers, Reference Baayen, Piepenbrock and Gulikers1995), mean letter bigram frequency, number of orthographic neighbours, and mean orthographic Levensthein distance of the 20 closest neighbours from the English Lexicon Project (Balota et al., Reference Balota, Yap, Cortese, Hutchison, Kessler, Loftis, Neely, Nelson, Simpson and Treiman2007), as well as length in letters, number of morphemes, and morphological type. Item characteristics are summarised in Table 1.
Predictors for the 105 unique items in the analyses. Predictors marked a are based on the 18 million words of the English Celex, while the predictors marked b are based on the 40,481 unique words in the English Lexicon Project.
Context predictors are crucial in a naturalistic design like the present one, where the context in which the words occur cannot be controlled experimentally and therefore must be controlled statistically. Here, the most important context predictor is the predictability of the item in the context, indexed by the conditional word probability for each item inspired by MacDonald and Shillcock (Reference MacDonald and Shillcock2003). The measure used here is the frequency of the word trigram in which the target is the last word, divided by the frequency of the word bigram that precedes the target (both frequencies taken from the 2007 version of the British National Corpus; British National Corpus, 2007). For instance, the probability (Pr) of the target word member given the two preceding words most senior is estimated as the probability of the trigram most senior member divided by (/) the probability of the bigram most senior. The following formula illustrates the calculation:
 \begin{eqnarray}
&&{\rm Pr\, (member\,{|}\,most\, senior)} \nonumber\\
&&\quad {\rm = Pr\, (most\, senior\, member)/Pr \,(most\, senior)}\nonumber
\end{eqnarray}
The logic of this measure is that it indicates how relatively frequent the target word is following the two preceding words, given that those two preceding words have already been read. A potential problem with using word trigram frequencies for authentic texts is that some of the target trigrams may not occur in the relevant corpus, a problem which is frequently encountered in computational linguistics. One solution from that field is modified Kneser–Ney smoothing (Chen & Goodman, Reference Chen and Goodman1998), which estimates n-gram frequencies based on smaller attested n-grams and on how many different words co-occur with the target. Kneser–Ney smoothed conditional word probability was used as an index of word predictability.
Both across and within texts, several content words were repeated: potential effects of this repetition were controlled by including a predictor indexing the number of times the word had been encountered previously. A final set of context predictors were the position of the word in the text, in the sentence and in the line. Of these, only the position of the word in the line was significant – a small inhibitory effect in the analyses of first fixation duration and first pass reading time. Since this is a control variable, it is not discussed further.
Finally, the experimental manipulation of reading for comprehension vs. reading for translation could have an effect either in itself or in interaction with other predictors. Interestingly, this variable only showed a main effect in the analysis of total reading time; none of the other predictors differed as a function of whether participants were reading for comprehension or translation.
3.2 Results and discussion
Statistical analyses
Linear mixed-effects regression models were fitted to three different dependent variables: total reading time, first pass reading time, and first fixation duration. Total reading time includes all fixations on a target word during the reading of the entire page. First pass reading time comprises all fixations on the target before the eye moves forward in the text for the first time, while first fixation duration is the duration of only the first fixation on the target. The measures are not independent of each other but they still reflect somewhat different phases of the word recognition process, and some differences between them are observed in the analyses as described below. All dependent variables were logarithmically transformed to reduce the skewed distribution characteristic of reading and other response times; untransformed reading times are shown in the figures for ease of interpretation. Several of the independent variables were also log transformed and are marked as such in tables and figures.
All mixed-effects models were fitted using the lme4 package (Bates & Maechler, Reference Bates and Maechler2009) in the R environment for statistical computing (R Development Core Team, 2009). The models all included factors – for instance cognate vs. non-cognate and morphologically simple vs. complex – as well as continuous predictors, so-called co-variates, such as the various frequencies. They are called mixed models because they include both random and fixed effects. The difference between these two is most easily illustrated with reference to factors: a fixed factor has a fixed and low number of levels which exhaust the levels in the population, for instance the levels simple and complex which constitute all relevant levels for the fixed factor complexity. Fixed factors are repeatable in the sense that further observations may be added that represent the existing factor levels, e.g. additional simple or complex words may be included in the experiment and still represent the same levels of the factor complexity.
Random factors, by contrast, are factors such as participants and items which are, in principle, randomly sampled from the population and do not exhaust the levels of that population. These are not repeatable: each new participant or item represents a new level of the factor. The mixed models include the variation between levels of each random factor as random intercepts which are adjustments to the overall intercept of the regression model – corresponding to the point where the regression line crosses the vertical axis – for each level of the random factor, e.g. for each participant or each item. The intercept is adjusted up for relatively slow participants and down for relatively fast ones. Additionally, the models may include so-called random slopes which model different effects of a co-variate for each level of a random-effect factor, e.g. different effects of word frequency for the different participants in a lexical decision experiment (e.g. Balling & Baayen, Reference Balling and Baayen2008).
The inclusion of random intercepts and slopes allows us to investigate various fixed effects, once the variation between participants or items is taken into account. For instance, we can establish whether there are group differences that go beyond differences between individual participants, or general frequency effects over and above individual frequency effects. For this experiment, all analyses included crossed random effects of subject and item (see specifications in Tables 2–4); the analyses of first pass and total reading time also included random slopes for conditional word probability by subject. The random effects are all supported by log likelihood ratio tests.
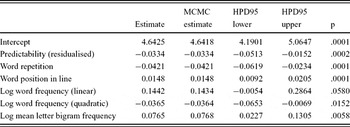
Regression model fitted to first fixation durations using treatment coding for the factor morphological complexity with simple as the reference level. The table shows the effect estimates of the model as well as estimates, 95% Highest Posterior Density (HPD) intervals, and p-values based on 10,000 Markov chain Monte Carlo samples for the fixed effects. The analysis also includes random intercepts for participant (SD estimated at 0.2241) and item (SD estimated at 0.0255). The residual error was estimated at 0.4420.

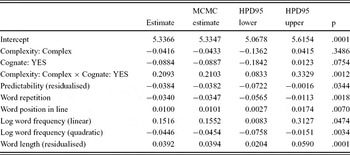
Regression model fitted to first pass reading times, using treatment coding for the factor complexity with simple as the reference level and for cognateness with non-cognate as the reference level. For the random intercept for participant, the SD was estimated at 0.1973, for the random intercept for item, at 0.1296, and for the random slopes for conditional word probability by participant, at 0.0450. The residual standard error was estimated at 0.4514.

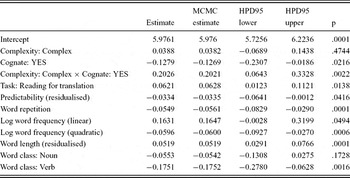
Regression model fitted to total reading times, using treatment coding for the factor complexity with simple as the reference level, for cognateness with non-cognate as the reference level, for task with reading for comprehension as the reference level, and for word class with adjective/adverbs as the reference level. For the random intercept for participant, the SD was estimated at 0.1869, for the random intercept for item, at 0.1313, and for the random slopes for conditional word probability by participant, at 0.0349. The residual standard error was estimated at 0.5010.

The possibility of statistically controlling for a range of different variables, including random effects, is a major advantage of using mixed-effects regression models. However, one problem arises when including multiple variables in the analysis, namely that they may be collinear, which makes it problematic to distinguish the contributions of the different variables and may make the model unstable. In order to reduce collinearity, highly correlated variables were residualised from each other by constructing simple regression models with one correlated variable as a function of the other and replacing the first variable with the residuals of the simple regression model. For example, word length and word form frequency tend to be correlated: relatively short words tend to be relatively frequent. Therefore, a regression model with word length as a function of word form frequency was constructed and word length was replaced in the overall analyses with the residuals of the simple model. This means that the overall model includes a variable that represents that part of word length which is uncorrelated with frequency along with the original frequency variable, which represents the shared variance of the two variables as well as the unique contribution of frequency. Importantly, this procedure allows the inclusion of both variables without collinearity problems. In this way, word length and conditional word probability were residualised from word frequency. After these modifications, collinearity was not a problem in the analyses.
The analyses are summarised in Tables 2–4. In the first column, the names of the significant predictors occur, with the estimates of their effect size in the second column. For factors the estimate is the adjustment to the intercept for the relevant level of the factor relative to the reference level (e.g. cognate relative to non-cognate); for co-variates, the estimate represents the slope. The remaining values in the tables are based on 10,000 Markov chain Monte Carlo (MCMC) samples run on each mixed model and the data (for details, see Baayen, Davidson & Bates, Reference Baayen, Davidson and Bates2008; the analyses were run using Baayen, Reference Baayen2009). MCMC-sampling is useful for models that include random effects because p-values based on the t-distribution use the upper bound of degrees of freedom (the number of observations minus the number of fixed effect parameters) which is likely to be too high, making the t-test anti-conservative. The MCMC-based values are more appropriately conservative and are therefore reported in the tables: the mean of each effect size across the samples is shown in the third column; higher posterior density (HPD) intervals – which correspond to traditional 95% confidence intervals but provide superior accuracy – in the fourth and fifth columns; and p-values in the sixth column.
The models were fitted by adding predictors in order of their importance in the design, starting with the least interesting control variables and ending with the cognateness variables. Non-significant predictors were excluded from the final analyses specified in Tables 2–4, but are mentioned where relevant. For the final model, the data were trimmed to exclude data points with large standardised residuals (±2.5 SD) in order to reduce the risk that any effect interpreted as significant would be the result of outliers. This removed between 2.1 and 3.0 per cent of the observations in each analysis, but provided substantially better fits to the data and more reliably interpretable effects.
Effects of cognateness
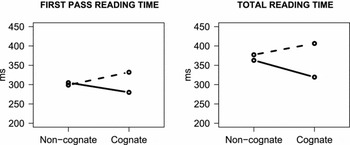
There was no effect of cognateness on first fixation duration, but the analyses of both first pass reading time and total reading time showed significant effects of the cognateness of a content morpheme in the target word with a morpheme in a translation equivalent that would be appropriate in the context. The cognates included both fully cognate words like role (Danish rolle) or senat-or (Danish senat-or) and complex words with only one cognate morpheme like Wednes-day (Danish ons-dag) but only if the morpheme in question occurred in an appropriate translation equivalent. In both analyses, words with cognate morphemes were compared to words without cognate morphemes, and this cognateness variable interacted with the morphological complexity of the word, as shown in Figure 1: for simple words (points connected by solid lines), we can observe the expected cognate facilitation effect, while for complex words (points connected by dashed lines), there is inhibition. This and the following figures are all partial effects plots that show the effect of one or two key variables while holding constant the rest of the variables summarised in Tables 2–4.
Partial effects plots showing the interaction between complexity and cognateness with an appropriate translation equivalent, for first pass reading time on the left and total reading time on the right. The dashed lines connect the points representing complex words, the solid lines the points representing the simple words.

The patterns in the two analyses are clearly similar, but the facilitation effect for the simple words was only fully significant for the total reading time measure, while for first pass reading time, the simple words differed significantly from the complex words without the cognate advantage reaching full significance. Conversely, the inhibition for the complex words was only fully significant for the first pass reading time analysis, but the complex words were significantly different from the simple words also in the total reading time analysis. Because the interaction effects are so similar and the difference between the two analyses so relatively weak, possible interpretations of the difference between the two measures are not pursued further.
Since facilitation would be expected for cognate relative to non-cognate words in a reading task, the inhibition observed for the morphologically complex words is surprising and suggests that the integration of cognate with non-cognate morphemes causes a delay. Unfortunately, the number of fully cognate complex words is so small (seven out of 66 complex words) that there is not sufficient statistical power to assess whether the delay for cognate complex words is general or applies only to those complex words that also contain non-cognate morphemes. What analyses do show is that the inhibition effect also holds when only partially cognate complex words are included, while a comparison of fully vs. partially cognate complex words is left for future research. The possible morpheme integration problem is further discussed in Section 4.
Among the cognateness measures determined, binary cognateness with an appropriate translation equivalent in the context emerged as the most reliable predictor. In other words, the best cognateness predictor was the one that counted as cognates words like person-al (Danish person-lig) and January (Danish januar) for which cognate morphemes occur in appropriate translation equivalents in the context, but not words like address which has a Danish cognate (adresse, meaning place of residence), or entitled in which the morpheme title has a cognate in Danish (titel, meaning name or appellation), neither of which are appropriate translations in the context (see the texts in Appendix B). The likewise binary measure of cognateness of a morpheme in the target word with any morpheme in Danish, i.e. the measure including words like address and entitled as cognates, showed a similar but non-significant trend towards inhibition for the complex words, but the facilitation for the simple words was absent. The significance of the appropriate cognates suggests that the context co-determines cognate activation, such that mainly appropriate cognates are activated.
The two binary cognateness variables overlap to some extent (all words that are cognate with an appropriate translation equivalent are of course also cognate with any Danish word), but a new variable may be constructed which divides the target words into those that are cognate with appropriate words, those that are cognate with non-appropriate words, and those that are non-cognate. If this three-level variable is used to index cognateness in a new regression model, the inhibition for the complex words is maintained for both appropriate and non-appropriate cognates. For simple words with non-appropriate cognates, the model also shows a trend towards inhibition. However, the facilitation effect for simple words with appropriate cognates does not reach significance when compared only to the non-cognate words, but emerges when simple words with appropriate cognates are compared to simple words with non-appropriate cognates and non-cognate simple words grouped together, as in the final models summarised in Tables 3 and 4. In short, for simple words, non-appropriate cognate words pattern with non-cognate words in being slower than appropriate cognate words, while for complex words appropriate and non-appropriate cognate words show inhibition relative to non-cognate words.
The fine-grained measure of graphic similarity did not show significant effects on any of the dependent variables. There are at least two possible explanations of this. Firstly, this measure necessarily focuses on one specific translation equivalent, the one deemed most appropriate, but several translations may be possible and appropriate in the given context. A second and more peripheral explanation is that the orthographies of both English and Danish are relatively deep and a measure of graphic similarity may therefore not sufficiently capture perceived similarities which are likely to be at least partially phonological.
The fact that the cognates most clearly activated in the present studies are those that are appropriate in the context is at first glance reminiscent of the attenuated cognate effects for words that are highly predictable in the context observed in the sentence reading studies of Duyck et al. (Reference Duyck, Van Assche, Drieghe and Hartsuiker2007), Libben and Titone (Reference Libben and Titone2009), Schwartz and Kroll (Reference Schwartz and Kroll2006), and Van Hell and De Groot (Reference Van Hell and De Groot2008). However, while the latter effect could be the result of the target word being recognised so quickly that activation of cognates in the non-target language does not become (fully) relevant, in the present study, the context influences not only how the target words are read but also which cognates in the non-target language are relevant. The interaction of cognateness with word predictability is not replicated in the present study. One possible reason for this could be that the predictability manipulation in the single-sentence experiments is more extreme than the variations found in the present authentic experimental texts.
The analysis of total reading times showed an effect of task, with reading times being longer when reading for translation, indicating that reading for translation did actually elicit further processing and compatible with the intention that reading for translation should make the participants focus on the L1 and on L1–L2 correspondences. However, there was no difference in the effect of cognateness depending on whether the task was reading for comprehension or translation, indicating a highly automatic activation of cognate words in the L1 also in the task where the L1 is not in focus.
In sum, automatic activation of cognate words in the L1 is observed for both simple and complex words in the L2, irrespective of the task, but clearly dependent on the appropriateness of the cognates in the context. The difference in the direction of the effect between simple and complex words is discussed below.
Context variables
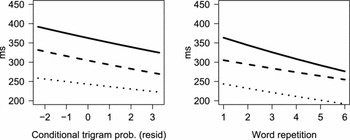
As outlined above, the predictability of each word in its context was indexed by the frequency of the word trigram of which the target was the last, divided by the frequency of the preceding bigram. Both were Kneser–Ney smoothed. This measure of predictability had significant facilitatory effects in all analyses, as illustrated in the left panel of Figure 2 (here and in Figure 3, solid lines represent total reading time, dashed lines first pass reading time, and dotted lines first fixation duration). The significance of this effect across all analyses indicates that the conditional trigram probability provides a useful way of indexing predictability. In contrast to the standard cloze probability (see Taylor, Reference Taylor1953), it does not require extensive pre-testing, and effects are significant without large manipulations of predictability (MacDonald & Shillcock, Reference MacDonald and Shillcock2003).
Partial effects plots for the effects of context: conditional trigram probability indexing predictability on the left and word repetition on the right. Solid lines show total reading time, dashed lines first pass reading time, and dotted lines first fixation duration.

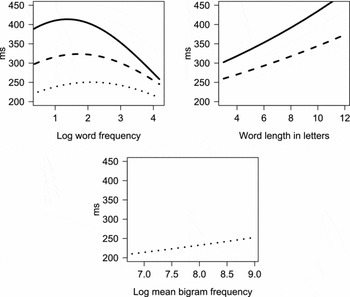
Partial effects plots for the effects of item-related control variables: log written word frequency, word length in letters, and log mean letter bigram frequency. For purposes of illustration, the untransformed length variable is shown also for the total reading time model although the model summarised in Table 4 included a residualised length variable in order to reduce collinearity. Solid lines show total reading time measures, dashed lines first pass reading time, and dotted lines first fixation duration.

The first pass and total reading time models also included random slopes for conditional word probability by participant, the inclusion of which was supported by log likelihood ratio tests. These random slopes are similar to the random slopes for word frequency sometimes included in analyses of lexical decision data (e.g. Baayen, Wurm & Aycock Reference Baayen, Wurm and Aycock2007; Balling & Baayen, Reference Balling and Baayen2008; Plag & Baayen, Reference Plag and Baayen2009). They suggest that participants are differentially sensitive to the corpus-based conditional word probability; importantly, the main effect of conditional word probability remains significant when the variation between the participants is accounted for by the random slopes.
The right panel of Figure 2 shows the effect of word repetition in all analyses: repeated words were read faster. This could be understood as a kind of identity priming, but in contrast to priming studies, the recognition of the words in this experiment would be supported by the sentential and textual context in which they occur.
Other control variables
In addition to context, the analyses also included control variables that are inherent characteristics of the items. These are included in the analyses mainly for control purposes, in order to enable the assessment of cognateness effects over and above effects of these item characteristics, and are discussed here partly for that reason, but also because they give information about the reading process. As expected, word frequency had a significant effect at all stages of reading, though the effect was non-linear such that the expected facilitatory effects only arose for words of higher frequencies. This is illustrated in top left of Figure 3.
In the word recognition literature, effects of whole-word frequency for morphologically complex words are traditionally interpreted as evidence of whole-word representations in the mental lexicon (e.g. Taft, Reference Taft1979). Here, the effects of word frequency are observed for both simple and complex words with no interaction with complexity, though we see other evidence of differences between simple and complex words, namely the different cognateness effects. Interestingly, the effect of whole-word frequency arises as early as at first fixation, at a stage at which longer, often morphologically complex, words are unlikely to have been read in their entirety. This confirms the observations of Kuperman, Bertram and Baayen (Reference Kuperman, Bertram and Baayen2008) and Kuperman, Schreuder, Bertram and Baayen (Reference Baayen2009) and suggests that for complex words, word frequency may be understood as a measure of the probability of several morphemes co-occurring, a probability which comes into play already at the first fixation on a complex word. While semantic transparency was not controlled, approximately half the complex words were regularly inflected words for which whole-word frequency effects are not expected under the traditional interpretation of such effects as evidence of non-morphemic processing. Like the difference in the cognateness effect between simple and complex words, this interpretation suggests that morphological information is available to advanced L2 readers.
Another variable that typically affects reading time is word length. Here the length of the word in letters had the expected inhibitory effect only for first pass and total reading times, as may be seen in top right panel. It makes sense that first fixation duration is less sensitive to length than the later measures first pass and total reading time, as this only includes the very first fixation on a word, while the length effect on the later measures is likely to be at least partially driven by refixations.
In contrast, mean letter bigram frequency for the items only had a significant effect on first fixation duration (see the bottom left panel Figure 3). The word recognition literature shows somewhat inconsistent effects of this variable (see e.g. Westbury & Buchanan, Reference Westbury and Buchanan2002) but it is still surprising that the sign of this effect is positive, reflecting that words with higher mean letter bigram frequency elicit longer first fixation duration than those with lower mean letter bigram frequency. However, given that the effect is only significant in a single analysis, this issue is left for further research.
A final significant effect is the difference between word classes: total reading times for verbs were significantly shorter than for the group of adjectives and adverbs. A speculative explanation of this marginal difference is that it may be a result of the adjectives and adverbs being harder to integrate into the syntactic structure of the sentences. There were no effects of orthographic neighbourhood or morphological family size.
Summary
The experiment showed effects of cognateness that differed according to morphological complexity, with simple cognate words showing the expected facilitation relative to non-cognate words, while morphologically complex cognate words showed inhibition relative to non-cognate words. In both cases, the strongest effects were observed for the cognateness variable that considered the context of the word in the definition of cognateness, by only counting cognateness with appropriate translation equivalents. Importantly, we see that cognateness effects arise during reading of authentic texts, when a range of context- and item-related variables are statistically controlled.
4. General discussion
The experiment reported above clearly shows automatic activation of cognate words, and thus extends the evidence for non-selective access to lexical representations from reading of words in isolation to reading in a naturalistic context and to translation pairs that may overlap less completely in form and semantics than those typically used in studies where words are presented in isolation. The automaticity of the cognate activation emerges in several ways. Firstly, the L1 cognates of the L2 target words are activated even though the target words are embedded in L2 text, which should bias against L1 activation as argued for instance by Kroll and Tokowicz (Reference Kroll and Tokowicz2005). Secondly, the cognate effect is the same whether the task is reading for translation, which focuses on L1–L2 correspondences, or reading for comprehension which concentrates on the L2. Thirdly, the cognate effect arises even in the natural task of reading a newspaper article on a computer screen.
Crucially, the cognateness effect – and thus the automatic activation of words in the non-target language – is constrained by the two factors that this study set out to investigate: context and morphological complexity. The investigation of morphologically complex words arises from the consideration of authentic texts, while assessing the role of context in the definition of cognateness requires the use of authentic texts. However, the use of authentic texts does not mean that the present study aims to question the findings of more traditional experiments; rather, the purpose is to extend such findings to a more naturalistic setting and to investigate phenomena that are characteristic of the complexities of natural communication, and in this way deepen our understanding of the bilingual mental lexicon.
The first factor constraining the cognateness effects is context. The cognates activated most strongly are those that are appropriate in the context, as evidenced by the fact that the strongest and most systematic effect is found for cognateness with an appropriate translation equivalent rather than cognateness with any word in the L1. As in the lexical ambiguity literature (see e.g. Gorfein, 2001; Lupker Reference Lupker2007), it is unclear whether inappropriate cognates are simply not activated or initially activated just like appropriate cognates, but then suppressed by the context, but it is clear that the context affects the processes in both the target and the non-target languages. This result is similar to the finding for L1 reading of lexically ambiguous words that several meanings are automatically activated but that their degree of activation is conditioned, among other factors, by the context (see references above). The analysis using a three-way division of words into appropriate cognates, non-appropriate cognates and non-cognates confirms that the facilitation effect for the simple words only arises for appropriate cognates, and only when compared with both non-appropriate cognates and non-cognates.
In sum, the answer to the first research question posed by the present study is that context does seem to restrict the activation of cognates. The most relevant cognateness variable is one which is restricted to appropriate translation equivalents but not to a single translation equivalent, suggesting that several word candidates are activated at once, but showing that this activation is restricted by semantic and/or conceptual content. Thus, the experiment supports the hypothesis that the automatic activation of cognates is constrained to those that make sense in the context. In other words, while lexical access is non-selective with respect to language – cognates are automatically activated in both reading tasks – it is selective with respect to semantics or conceptual representations. This indicates that conceptual/semantic relatedness is a more important factor in lexical activation than the L1–L2 distinction, suggesting in turn a rather close integration between words across the different languages of a bilingual.
The second research question of this study addressed the role of morphological complexity which turned out to constrain the cognateness effects observed: the direction of the cognateness effect differs between simple and complex words. Cognate simple words are read faster than non-cognate simple words. This facilitation for simple words is in accordance with what we would expect based on studies using lexical decision and other word recognition tasks.
For the complex words, by contrast, we find an inhibitory effect, which is more surprising and remains difficult to interpret. One possible explanation is that the integration of cognate and non-cognate morphemes is problematic. Such problems could arise in two ways, which are not necessarily mutually exclusive. One possibility is that morphological connections exist in the bilingual lexicon between words in the two languages. Under this interpretation, a target L2 word would activate cognate morphemes in the L1 but this process could make any non-cognate morpheme(s) in the target word difficult to process or difficult to integrate for a complete reading of the word, relative to non-cognate complex words. However, it is somewhat problematic for this explanation that the integration of cognate and non-cognate morphemes occurring in one word causes longer reading times, while there is no evidence of problems with integrating simple cognate words in an often non-cognate context.
Another possibility is that a complex target word activates morphologically related words in the L2. If these morphologically related non-target words are fully cognate with words in the L1, they may activate their cognate L1. The activated cognate words in the L1 may in turn reinforce the non-target words in the L2, causing longer reading times for the target word.
Both explanations suggest that complex words that contain both cognate and non-cognate morphemes are mainly responsible for the inhibition observed for complex words. Unfortunately, the texts do not include a sufficient number of fully cognate complex words to allow an analysis comparing fully and partially cognate complex words, but it is an interesting topic for further research.
The inhibition effect for the complex words and the tentative interpretations of it show that morphology seems to play a role either within or across the two languages of the bilingual, or possibly both. However, the experimental results are at odds with the priming results summarised by Sánchez-Casas and García-Albea (Reference Sánchez-Casas and García-Albea2005) and the morphological model they suggest based on them. This model posits that cognates share a representation on the level of morphemic units, whose pre-activation by a prime leads to shorter decision latencies to a cognate target, just as morphologically related words tend to produce priming effects. This model would predict equal facilitation for simple and complex cognates, at least the inflectional forms which are the focus of Sánchez-Casas and García-Albea's experiments, and also a substantial proportion of the items – about half of the complex words – in the current experiment. For other types of complex words, the cognates-as-morphemes model may perhaps be salvaged if the complex words activate multiple morphemic units, of which only one is compatible, i.e. integration problems along the lines laid out above. The discrepancy between the present results and those of Sánchez-Casas and García-Albea could be due to the special and somewhat artificial task demands in the masked priming task used by the latter. Additionally, it may play a role that the Spanish–Catalan stimuli of Sánchez-Casas and García-Albea are more closely related than the English L2 and Danish L1 of the present study, with the possible consequence that more of their complex words are fully rather than partially cognate.
Other, more dominant models of the bilingual lexicon (e.g. the Revised Hierarchical Model of Kroll & Stewart, Reference Kroll and Stewart1994; the Bilingual Interactive Activation+ Model of Dijkstra & Van Heuven, Reference Dijkstra and Van Heuven2002) do not involve morphological representations, but the present results indicate that the morphological structure of words does play a role for the bilingual language user, either across the two languages as in the first of the two possible explanations offered above or within the L2 as in the second of the explanations. Further experiments are required to uncover the exact role of morphology in the bilingual lexicon. Whether the morphological effects arise as a consequence of specific morphemic units or as an epiphenomenon of semantic and formal connections is a question that may be best addressed in computer implementations of the models.
In sum, although the present experiment does provide evidence that the morphological structure of words in the L2 affects their recognition, further work is required in order to fully answer the question about the role of morphemes in the bilingual lexicon, the second research question of this study. A first step would be a comparison of fully and partially cognate complex words, in order to explore the possible explanations of the inhibition effect for complex cognates observed in the present study.
The cognateness effects are evidence of the automatic activation of multiple words during reading, as are neighbourhood effects (e.g. Balota, Cortese, Sergent-Marshall, Spieler & Yap, Reference Balota, Cortese, Sergent-Marshall, Spieler and Yap2004) and effects of embedded and embedding words (Baayen et al., Reference Baayen, Wurm and Aycock2007; Bowers, Davis & Hanley, Reference Bowers, Davis and Hanley2005), with similar activation in spoken word recognition demonstrated by uniqueness point effects (Balling & Baayen, Reference Balling and Baayen2008; Marslen-Wilson, Reference Marslen-Wilson, Bouma and Bouwhuis1984; Wurm, Reference Wurm1997). However, the results indicate that the activation is not unrestricted, but conditioned by the context, suggesting a system which is optimally tuned to the task of word recognition in context, not just for L1 readers who have been exposed to the target language from birth but also for L2 readers.
Appendix A. Words in the analysis
English words containing one or more morphemes that is cognate with an appropriate Danish translation equivalent (n = 42; some words occur several times across the two texts).

English words not containing morphemes that are cognate with an appropriate Danish translation equivalent (n = 63).

Appendix B: Full texts
Text 1: Extracts from text from the BBC homepage (http://news.bbc.co.uk/2/hi/7922703.stm, retrieved March 10, 2009)
Ted Kennedy to receive knighthood
Veteran US senator Ted Kennedy, 77, is to be awarded an honorary knighthood. The Queen has agreed the honour for the brother of former US president John F Kennedy for services to the US–UK relationship and to Northern Ireland. Gordon Brown is to formally announce the award during his address to both houses of Congress on Wednesday. Mr Kennedy, who has been a senator for his home state of Massachusetts for more than 46 years, is being treated for a brain tumour. The most senior living member of the famous Irish–American political dynasty, he was diagnosed with brain cancer in May last year after being rushed to hospital with stroke-like symptoms. He has since had chemotherapy and radiation to treat the malignant glioma, an aggressive type of brain tumour. Mr Kennedy suffered another seizure during President Barack Obama's inaugural lunch in January, but was released from hospital a day later. The father-of-five was elected to the US Senate as a Democrat in 1962 following the election of his brother as president. Apart from his famous family connections, he is probably best known in the UK for his work on the Northern Ireland peace process. He has been intricately involved in politics there, meeting Sinn Fein leader Gerry Adams and other politicians during and beyond the Good Friday agreement. Mr Kennedy joins a select band of overseas nationals given an honorary knighthood. Microsoft billionaire Bill Gates, former president George Bush senior, former mayor of New York Rudolph Giuliani and the film director Steven Spielberg have also received the honour.
Text 2: Extracts from text from Fox News homepage (http://www.foxnews.com/politics/2009/03/04/britain-ted-kennedy-honorary-knighthood/, retrieved March 10, 2009), edited to conform to British English spelling conventions.
Kennedy: Honorary Knighthood is “moving and personal”
He won't be allowed to call himself Sir Ted, but Britain is awarding an honorary knighthood to U.S. Senator Edward Kennedy. Senator Ted Kennedy says Britain's decision to award him an honorary knighthood is “moving and personal.” British Prime Minister Gordon Brown told Congress Wednesday that Kennedy was awarded the honour. The Massachusetts Democrat, who is battling brain cancer, did not attend Brown's address Wednesday to a Joint Meeting of Congress. He was recognised for services to U.S.–U.K. relations and to Northern Ireland. Brown told the senator on Tuesday night that Queen Elizabeth II had made him a member of British nobility. In his speech, Brown referred to the senator as “Sir Edward Kennedy” and called him a “great friend.” Following the announcement by the British government, Kennedy released a statement saying he is “deeply grateful” for the “extraordinary honour.” “I have always prized the opportunity to work with the British government and strengthen and deepen the role of our two countries as leading beacons of democracy in the world,” Kennedy said. “So for me this honour is moving and personal – a reflection not only of my public life, but of things that profoundly matter to me as an individual.” The 77-year-old brother of President John F. Kennedy, well-known in Britain for support of the Northern Ireland peace process, is being treated for a brain tumour. Other Americans to receive honorary knighthoods include Microsoft chief Bill Gates and filmmaker Steven Spielberg. Unlike British knights, they are not entitled to use the honorific “Sir” or “Dame” before their names.