1 Introduction
The QALY (quality-adjusted life year) allows two of the most important consequences of health care to be combined into a single unit of measurement for use in cost-effectiveness analysis: the prevention of premature death and the enhancement of (health-related) quality of life (QoL). However, it has been evident for some time that an exclusive focus on maximising QALYs within budget constraints may unfairly disadvantage some groups. Surveys of the general public in a number of countries reveal a willingness to give priority to the more severely ill (Shah, Reference Shah, Tsuchiya and Wailoo2009; Nord, Reference Nord2013; Nord and Johansen, Reference Nord and Johansen2014), certain age groups (Diederich et al., Reference Diederich, Winkelhage and Wirsik2011; Eisenberg et al., Reference Eisenberg, Freed, Davis, Singer and Prosser2011; Palanca-Tan, Reference Palanca-Tan2013; Petrou et al., Reference Petrou, Kandala, Robinson and Baker2013), those with high-cost illnesses (Nord et al., Reference Nord, Richardson, Street, Kuhse and Singer1995b; Abellan-Perpiñán and Prades, Reference Abellan-Perpiñán and Prades1999; McKie et al., Reference McKie, Shrimpton, Richardson and Hurworth2011), and those at the end of life (Normand, Reference Normand2009; Round, Reference Round2012; Shah et al., Reference Shah2014), even if this means a reduction in the total amount of health produced.
The study reported below concerns a related issue: the equitable treatment of the permanently disabled and chronically ill. Giving equal priority to such patients creates a problem if the health condition limits their ability to benefit from treatment, since it likewise conflicts with QALY maximisation (Weinstein and Stason, Reference Weinstein and Stason1977). In light of this, Harris argued that the disabled and chronically ill face a form of ‘double jeopardy’ (Harris, Reference Harris1987). Not only are they unfortunate enough to be disabled or chronically ill, but as a result of this they are disadvantaged in the competition for limited resources that may save their life or improve their QoL.
The general public’s attitude towards the treatment of those with a limited potential to benefit remains unclear, and further investigation is needed on the reasons for different preferences (Abellan-Perpiñán and Prades, Reference Abellan-Perpiñán and Prades1999; Ubel et al., Reference Ubel, Loewenstein, Scanlon and Kamlet2002; Nord et al., Reference Nord, Undrum Enge and Gundersen2010). For example, Ubel et al. (Reference Ubel, Loewenstein, Scanlon and Kamlet2002) distinguished between a ‘pre-existing paraplegia scenario’ in which subjects were asked ‘how many paraplegic’s lives would have to be saved to be just as important as saving 100 “normal” people’s lives’, and a ‘paraplegia onset scenario’ in which they were asked ‘how many patients who would experience the onset of paraplegia [following treatment] need to be saved to equal the benefit of saving 100 “normal” lives’. They found that respondents gave different answers to these ‘person trade-off’ (PTO) questions even when the effects of treatment (measured in QALYs) were the same. Further, the answers to the same questions varied significantly when the order of the questions was changed. Those who were first presented with the ‘paraplegia onset scenario’ judged that 1000 people who would experience the onset of paraplegia would have to be saved to equal the benefit of saving 100 ‘normal’ lives, whereas those who were first presented with the ‘pre-existing paraplegia scenario’ judged that 126 people who would experience the onset of paraplegia would have to be saved. This 10-fold difference left unclear which set of preferences represented the ‘true’ preferences of those surveyed.
It is not inconsistent to place a higher value on saving the lives of pre-existing paraplegics compared with onset paraplegics, or vice versa. People may have defensible ethical and/or economic reasons for treating these groups differently. A problem does arise, however, when respondents place different values on treatment for the same group (e.g. the onset paraplegics) depending on whether they have previously been asked about the other group. Note that individual respondents in the Ubel et al. study did not make inconsistent choices, since they were only asked about each scenario once. Rather, the inconsistency arises at the group level, depending on the order in which respondents receive the questions.
In an effort to overcome the (group level) inconsistency Damschroder et al. (Reference Damschroder, Zikmund-Fisher and Ubel2005) conducted a similar study to Ubel et al. but began by asking half of their subjects to complete an ‘adaptation exercise’ before answering the PTO questions. This included asking them whether paraplegia would be ‘much more upsetting’, ‘equally as upsetting’ or ‘much less upsetting’ over time. They found that this ‘dramatically reduced’ the differences between respondent’s evaluations of the pre-existing paraplegia and paraplegia onset scenarios. The reasoning was that participants in the earlier study may have exaggerated the negative impact of new onset of paraplegia, and therefore placed less value on saving the lives of people who will be left paraplegic following treatment compared to those with pre-existing paraplegia.
However, even if the adaptation exercise corrected the tendency of respondents to underestimate the ability of newly disabled patients to adapt, there are other reasons for treating the pre-existing and onset cases differently. For instance, it might be considered fairer to give pre-existing paraplegics priority to make up for the poor health they have experienced in the past, or because the amount of health the two groups experience over the course of their lifetime will be more equal (the ‘fair innings argument’), or because the patients in the pre-existing group, being already members of the disability community, deserve special consideration. From the Damschroder et al. study we do not know what respondents thought about these arguments, or whether they considered them at all. They may have outweighed the adaptation exercise if they had been considered.
A number of explanations for order effects have been proposed in the cognitive psychology and survey research literature (Krosnick and Alwin, Reference Krosnick and Alwin1987; Krosnick, Reference Krosnick1992; Schwarz et al., Reference Schwarz, Hippler and Noelle-Neumann1992). One explanation, which is consistent with the results of the previous studies, appeals to contextual factors in explaining order effects. According to this account, the information in an earlier scenario can frame responses to a succeeding scenario, either by determining what information the respondent has in mind when considering the second scenario (Sudman et al., Reference Sudman, Bradburn and Schwarz1996; Tourangeau et al., Reference Tourangeau, Singer and Presser2003), or by establishing a cognitive framework that guides the interpretation of the latter information (Bradburn, Reference Bradburn1992).
In line with this explanation, Ubel et al. speculate that those who receive the pre-existing scenario first “think about the importance of avoiding discrimination against people in the disability community”, and this carries over to their assessment of the onset case. By contrast, “this attitude may not arise as frequently in the paraplegia onset scenario, because the patients in this scenario are not already members of the disability community” (p. 196). Damschroder et al. suggest that respondents who receive the onset case first exaggerate the negative impact of new onset of paraplegia and fail to appreciate that people adapt over time, which carries over to their assessment of the pre-existing case. Adaptation is less likely to arise in the minds of those who receive the pre-existing case first, since pre-existing paraplegics have already adapted. A third possibility is that respondents who receive the onset scenario first focus on the treatment, which is described as “not entirely effective and leaves [patients] with paraplegia after treatment” (Ubel et al., Reference Ubel, Loewenstein, Scanlon and Kamlet2002: 192). This negative reaction then carries over to their assessment of the pre-existing case. A negative reaction is less likely among those who receive the pre-existing case first since treatment in this case is described as ‘completely effective’.
The previous results indicate that public preferences with respect to the treatment of disabled and chronically ill patients and the reasons for these preferences remain unclear. More generally, the results raise questions about the validity of ‘spontaneous’ survey responses in a context where issues are complex and morally challenging.
The study reported below had three main objectives: (i) to determine the considered, underlying preferences of a sample of the Australian public with respect to the treatment of the permanently disabled and chronically ill, (ii) to gain insight into the reasons for respondent’s distributive preferences and (iii) to eliminate or significantly reduce the order effect. Achieving the third aim was necessary for achieving the first two.
The study differed from the previous studies on this topic in several respects. First, the present study utilised a discussion group methodology. Small-group discussions involve dynamic group conversations in which individuals present ideas, hear from other participants, and deliberate on the issues, and thereby have the potential for producing more considered responses than self-administered postal or web-based surveys, or one-on-one interviews (Patton, Reference Patton2002; Hesse-Biber and Leavy, Reference Hesse-Biber and Leavy2006). Because they encourage a more in-depth examination of the issues, group discussions can potentially address order effects.
The effect of discussion and deliberation on participant’s views regarding priority setting was demonstrated in a study by Dolan and Cookson conducted with 60 patients in the United Kingdom (Dolan and Cookson, Reference Dolan and Cookson2000). They initially found that 33.4% of respondents would give higher priority to those with children, and 66.6% thought they should be given the same priority. After deliberation, the proportion of respondents who would give higher priority to those with children fell to 20%, and the proportion who thought they should be given the same priority rose to 77%. The authors concluded that “the public’s views about setting priorities in health care are systematically different when they have been given an opportunity to discuss the issues” (p. 918). The effect of deliberation was confirmed in a study by Abelson et al. (Reference Abelson, Eyles, McLeod, Collins, McMullan and Forest2003). They conducted baseline and follow-up surveys before and after discussion. The results revealed that face-to-face group meetings (where more deliberation took place) had a more significant impact than one-on-one telephone discussions, which suggests that “as more deliberation is introduced, participant views may be more amenable to change” (p. 95). In general, the authors conclude that “deliberation does make a difference to participant views” (p. 95). It is an independent question, however, whether the effect of discussion is always beneficial. We consider this below.
Second, in the earlier studies participants were required to commit to an answer to the first question before receiving the second, and had no opportunity to revise their answers. In contrast, participants in the present study had the opportunity to directly compare the pre-existing and onset scenarios before making a decision about priority-setting and could revise their answers. This ensured that their choices in each context were informed by an awareness of the other.
Third, if the distributive preferences of the public are to play a role in shaping health policy, as advocated by a growing number of researchers and decision-makers (Mitton et al., Reference Mitton, Smith, Peacock, Evoy and Abelson2009; NHS, 2013), then the preferences should be informed by ethically and rationally justifiable arguments. At a minimum, to be ‘ethically justifiable’ an argument should “appeal to reasons and principles that are accepted as relevant by people who are disposed to finding terms of cooperation that are mutually justifiable” (Daniels, Reference Daniels1998: 42). This would eliminate reasons based on racism or self-interest, for example. To be ‘rationally justifiable’ the preferences should be carefully considered and based on arguments that are free of common fallacies and errors of reasoning (Van Vleet, Reference van Hout, Janssen, Feng, Kohlmann, Busschbach, Golicki, Lloyd, Scalone, Kind and Pickard2011). In addition, a respondent’s choices should be informed. In the present context, this means they should be aware of the main arguments for and against treating disabled and chronically ill patients equally, as well as arguments for and against treating the pre-existing and onset groups equally. A consideration of these arguments was a central element of the present study.
The methods used in the present study are explained in the following section. Results are then presented and discussed in the subsequent two sections. The final section constitutes a summing up.
2 Survey and study design
The study took place in Victoria, Australia, and involved eight semi-structured, small-group discussions with the general public. Overall, 66 people participated, with the size of groups varying between five and 10 people. Sessions ran for two hours which included a short break. Informed consent was obtained from all participants, and the study received institutional ethics committee approval (MUHREC No. CF13/775).
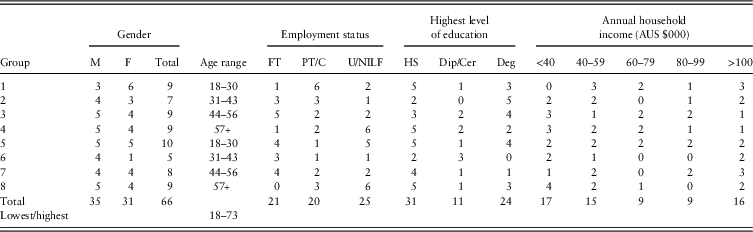
The sample was recruited by Qualitative Recruitment Australia (http://www.qra.net.au). The aim was to achieve a mix of gender, employment status, level of education and household income within each discussion group. The groups were stratified according to age as follows: age range 18–30 (two groups), age range 31–43 (two groups), age range 44–56 (two groups) and 57 or older (two groups). All study participants were recruited at the same time and were paid AU$75 for a two-hour session. One group discussion was held per week over a period of eight weeks in the order given in Table 1. Discussions were audio recorded and the files loaded into NVivo 10 software programme. Quotes exemplifying the main themes were coded for later retrieval.
Participant characteristics (n=66)

Note: FT=full-time; PT/C=part-time/casual; U/NILF=unemployed/not in labour force; HS=high school; Dip/Cert=diploma or certificate; Deg=degree.
2.1 Preliminary questions
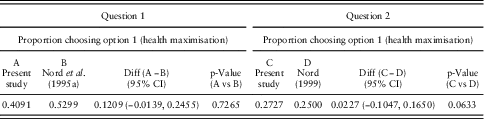
After a general introduction, each group meeting commenced with two questions used in previous studies (see Supplementary Material: Preliminary Questions). These were on the same topic: the equitable treatment of those with a limited potential to benefit. In the first (Nord et al., Reference Nord, Richardson, Street, Kuhse and Singer1995a), respondents were asked whether those who can be helped most should be a higher priority for treatment (option 1) or whether those who can become a little better should have the same priority (option 2). In the second (Nord, Reference Nord1999: 39–40), respondents were asked whether an increase in funding should go to a treatment that will help patients considerably (option 1) or should be split equally between this and another treatment that will help patients a little, on the grounds that both groups are equally entitled to treatment (option 2). The sessions began with these questions to determine whether the small sample in the present study had similar views to the larger, more representative samples in the earlier studies. Similar results would increase confidence that our participants were not atypical.
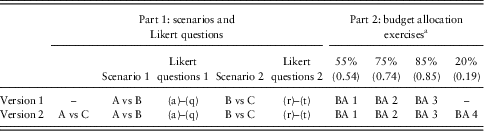
The remainder of each meeting was divided into two main parts. In part 1 participants discussed hypothetical scenarios and answered a series of questions designed to provide information about their distributive preferences. In part 2 they were required to allocate a notional budget between patients in a series of choice contexts based on the scenarios in part 1. The first four discussion groups received version 1 of the questions and the last four received version 2. The two versions differed in two respects (see Table 2). First, in version 1 the pre-existing scenario was presented first (A vs B) whereas in version 2 the onset scenario was presented first (A vs C). Second, version 2 had an additional budget allocation question (BA 4). In Section 2.2 we describe the scenarios presented for discussion in part 1.
Question order – versions 1 and 2

BA=budget allocation question.
a Percentage of full health (EQ5D-5L utility score) for groups B and C.
2.2 Part 1: the scenarios
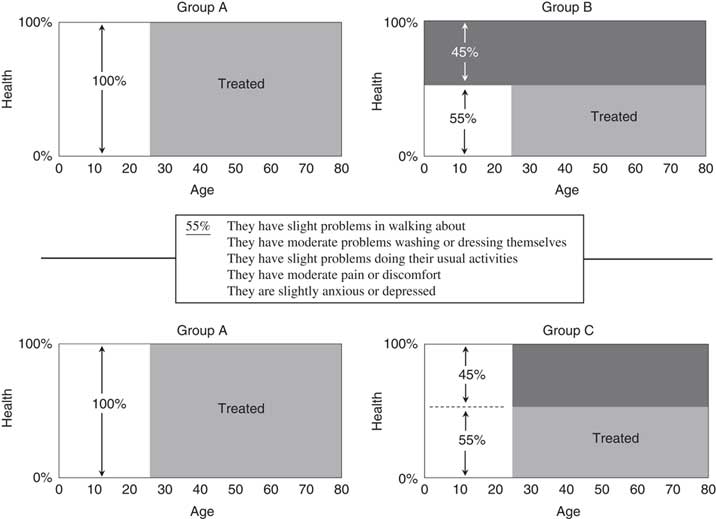
The scenarios for discussion in part 1 were presented with the help of Figure 1. The diagram was explained carefully at the beginning of each session and participants were asked if they had any questions. In particular, it was explained what the two axes represent, what the light and dark shaded areas represent, and why they differ between the groups. For the benefit of the reader the following is a summary of the explanations given to participants:
Group A: Patients in group A have been in good health from birth to age 25, but at age 25 face a life-threatening condition. If they receive treatment they will be returned to full health until age 80, but will die without treatment.
Group B: Patients in group B were born with a permanent disability or chronic illness that has reduced their QoL to 55% of full health from birth to age 25. At age 25 they face a life-threatening illness or injury like group A. If they receive treatment for this second condition they will be returned to 55% of full health until age 80, but will die without treatment.
Group C: Patients in group C were healthy until the onset of illness at age 25. From this age until age 80 their QoL will be 55% of full health if they receive treatment. If they do not receive treatment they will die at age 25 like groups A and B.
Question format: Health maximisation vs potential to benefit.

In this and subsequent cases (described below) the level of health was given a numerical value – a percentage of health where 0% represents death and 100% represents full health – and a health state description derived from the EQ5D-5L multi-attribute utility instrument (www.Euroqol.org). The health state descriptions were selected to approximate the percentage of full health shown in the diagrams. The crosswalk values were obtained by administering both the 3-level and 5-level versions of the EQ-5D questionnaire to respondents in Denmark, England, Italy, the Netherlands, Poland and Scotland (van Hout et al., Reference Van Vleet2012). Australian weights may turn out to be different from these. However, the main purpose of including the EQ5D-5L descriptions was to increase the likelihood that respondents were associating similar health states with the diagrams, which is a prerequisite for valid interpersonal comparisons both within and between groups. This was achieved by using the crosswalk value set.
2.2.1 Scenario 1: group A vs group B
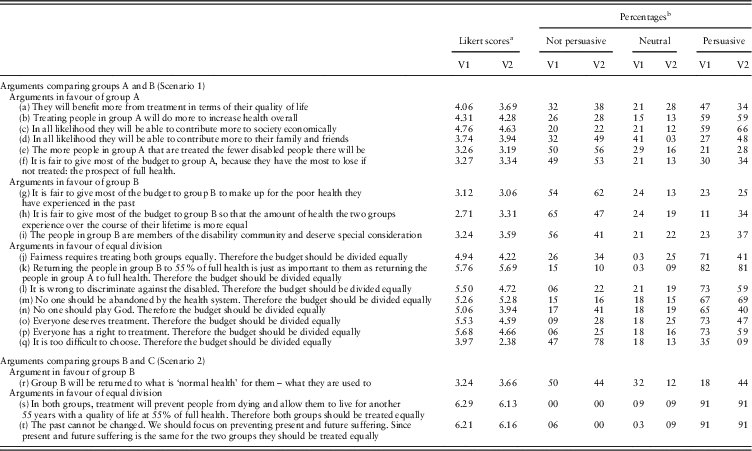
Those who received version 1 of the questions were introduced to the pre-existing scenario first. To begin, only groups A and B and the health state description in the middle box were shown. The two groups below the horizontal line in Figure 1 were not yet visible. After an in-depth discussion of reasons for prioritising group A or B, or for their equal treatment, participants were given the first set of arguments for evaluation (see Table 3, Scenario 1). These were based on a review of the literature on priority-setting in health care and a pilot session conducted with a convenience sample of academic and administrative staff from the Centre for Health Economics. Participants were asked to indicate on a seven-point Likert-type item how persuasive they found these arguments. They could also add any of their own. The Likert questions were designed to extend the range of arguments that participants could consider when making their subsequent budget allocation decisions. They would also provide insight into the reasons for those decisions and ensure their choices were informed. The format of the questions is given in Supplementary Material: Likert Question Format.
Arguments in support of health maximisation (group A), potential to benefit (group B), and equal division of the budget: mean scores on a seven-point Likert-type item, and percentage of respondents scoring them as not persuasive, neutral or persuasive

a V1=Version 1 (received the pre-existing scenario first, n=34), V2=Version 2 (received the onset scenario first, n=32).
b ‘Not persuasive’=score 1–3 on the seven-point scale, ‘Neutral’=score 4, ‘Persuasive’=score 5–7.
Throughout the discussions and when answering the subsequent budget allocation questions participants were asked to adopt the perspective of a health service administrator. While it is appropriate for subjects to adopt a self-interested perspective when measurements of utility are required, when judgements of social value are required a decision-maker perspective is more appropriate because it allows respondents to give expression to their ethical preferences (Sen, Reference Sen1985: 208; Ubel et al., Reference Ubel, Richardson and Baron1996: 114).
2.2.2 Scenario 2: group B vs group C
After discussing scenario 1 and answering the Likert questions, attention turned to scenario 2. For this discussion, only groups B and C and the health state description in Figure 1 were shown. Group A was removed. As with scenario 1, after a discussion about how to prioritise between groups B and C participants were presented with the second set of Likert questions, which gave an additional argument for prioritising group B, and two additional arguments for treating both groups equally (see Table 3, Scenario 2).
2.2.3 Version 2
The last four discussion groups received version 2 of the questions, which introduced the comparison between groups A and C (the onset case) first. That is, they began with the two groups below the horizontal line in Figure 1. For purposes of comparison it was important that participants receiving version 2 discuss the same two scenarios and answer the same two sets of Likert questions as in version 1. Hence, the last four groups also discussed scenarios 1 and 2 as in version 1 and answered the two sets of Likert questions.
Scenario A vs C did not include any Likert questions to avoid asking subjects to evaluate the same arguments twice. For example, the argument that group A should receive priority over group B because they will benefit more from treatment is also an argument in favour of group A in the A vs C scenario. The argument that A and B should be treated equally because everyone deserves treatment is also an argument in favour of an equal division of the budget in the A vs C scenario, and so on. The last four discussion groups were presented with all of the arguments in Table 3 when comparing groups A and B, and B and C.
The previous studies on this topic in effect compared group A with group B, then group A with group C (and the reverse for the second group). By contrast, in the present study group A was compared with group B, then group B with group C in version 1. This approach was adopted for two reasons. First, it was important that respondents were informed about the main considerations for and against treating the pre-existing and onset groups differently or equally. The best way to achieve this was by asking them to directly compare groups B and C. Second, the direct comparison of the pre-existing and onset scenarios would provide information about the reasons for participant’s budget allocation choices, which is useful for determining how much weight to attach to their preferences.
After evaluating the Likert arguments attention turned to the budget allocation questions, which were presented to all respondents in the same order.
2.3 Part 2: budget allocation
In the budget allocation exercises in part 2 participants were asked to divide a fixed budget between two patient groups. They were asked to allocate more to the group they thought should be a higher priority for treatment, with the amount being an indication of their strength of preference. In budget allocation exercise 1 (BA 1), Figure 1 was shown in its entirety and participants were asked to allocate a $1 million budget between groups A and B (question 1), and a second $1 million budget between groups A and C (question 2).
In budget allocation exercise 2 (BA 2), the QoL experienced by groups B and C was changed from 55% to 70%. Correspondingly, the EQ5D-5L health state in Figure 1 was changed to one representing 70% of full health: patients were described as having slight problems in walking about, moderate problems washing or dressing themselves, and being slightly anxious or depressed. Participants were again asked to allocate a $1 million budget between groups A and B and between groups A and C.
Budget allocation exercise 3 (BA 3) changed the QoL of groups B and C to 85%: the health state was described as one where patients would have slight problems washing or dressing themselves.
The level of severity was varied in the budget allocation exercises to test whether this would increase support for group A, and to ensure the results were not a consequence of using health states worse than or better than paraplegia – the health state used in the Ubel et al. and Damschroder et al. studies. There is some evidence that responses may differ depending on the order in which health states of different severity are presented in a questionnaire (Abellan-Perpiñán and Prades, Reference Abellan-Perpiñán and Prades1999). However, this is different from the order effect detected by Ubel et al. and Damschroder et al. Hence, the order of presentation of the budget allocation exercises was not varied in the present study. For the same reason the order of the Likert arguments was not varied. Testing for these other order effects would require separate studies.
After the first four group meetings it was clear there was considerable support for treating groups B and C equally. For this reason it was decided to include an additional budget allocation question in version 2 to test whether participants who chose to split the budget equally in earlier questions were ‘committed egalitarians’ or whether they were in principle willing to trade if the health state was sufficiently bad. In BA 4, QoL was reduced to 20% and the health state was described as one where patients would: have severe problems washing or dressing themselves; have severe pain or discomfort; and would be severely anxious or depressed.
In all of the budget allocation exercises participants were asked to assume that there were more patients in each group than could be treated and that treatment costs were the same. This implied that for every patient treated in one group, one less patient would be treated in the other group. They were also asked to assume that the groups were alike in all other respects and, in particular, that no one had received more than their ‘fair share’ of public resources in the past.
Participants were told they could revise their answers to the budget allocation and Likert questions, and were given instructions on how to do this in a way that would avoid ambiguity. They could revise their answers to the Likert questions at any time during part 1, and to the budget allocation exercises at any time during part 2. In the case of the budget allocation questions, the option to revise was provided so that respondents would not feel constrained to allocate a particular amount of the budget to a group in one exercise because they had allocated a particular amount to that group (or another group) in a previous exercise. They had the opportunity to ‘fine tune’ the amounts they allocated across the budget allocation exercises.
In conducting the discussions the moderator played the role of a facilitator: posing guiding questions, asking for clarification of comments, making a refocusing statement to sustain the group’s interaction (Bender and Ewbank, Reference Bender and Ewbank1994). However, because the study questions were conceptually and morally challenging, it was necessary that the moderator explain the scenarios in detail – pointing out relevant distinctions, forestalling possible misunderstandings and answering questions. This also extended to the Likert questions and budget allocation exercises. These had to be explained carefully, though the moderator’s role remained expository and clarificatory. Also, the moderator occasionally conducted a round-robin to ascertain what people were thinking. This gave participants an opportunity to articulate their views and receive feedback from others, and ensured that quieter participants had an opportunity to contribute.
2.4 Comprehension questions
At the end of each meeting participants were given several questions designed to test their understanding of the preceding tasks (see Supplementary Material: Comprehension Questions).
3 Results
Participant characteristics are shown in Table 1. They were evenly divided by gender (53% male), with an over-representation of respondents with a degree and from households with a higher annual income.
3.1 The preliminary questions
Answers to the opening questions were compared with answers from the previous two studies using χ 2 tests. It was not possible to reject the hypothesis that the proportions of respondents favouring options 1 and 2 in the present study were not different from the proportions in the Nord et al. study (Reference Nord, Richardson, Street, Kuhse and Singer1995a) or the Nord study (Reference Nord1999), although the result is borderline in the latter case. The proportions choosing the health maximising option, p-values and 95% confidence intervals are given in Table 4.
Preliminary questions: the present study vs two comparator studies: 95% confidence intervals (CI) and p-values using χ 2 tests

3.2 The budget allocation exercises
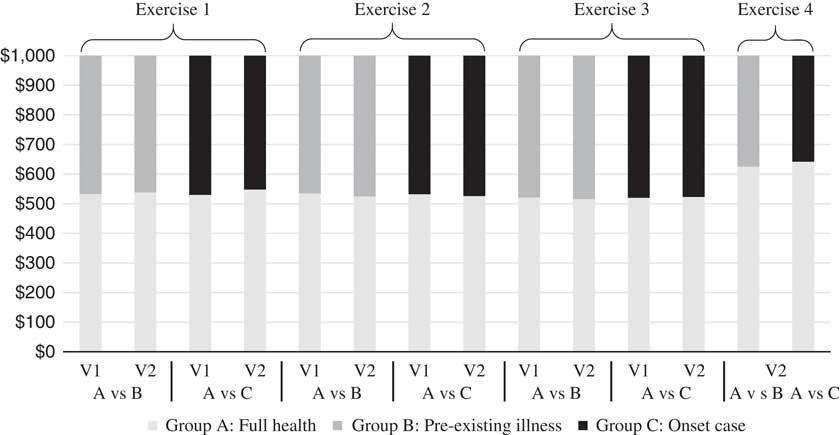
The results of the budget allocation questions are given in Figure 2. More of the budget was allocated to group A than groups B or C. That is, there was a preference for those who can be returned to full health. This was particularly evident in exercise 4, where the post-treatment health of groups B and C was at its worst (20%). In exercises 1–3 the amounts were more equally distributed. The following analyses are based on individual values rather than group values.
Budget allocation exercises: health maximisation, pre-existing disability and onset disability. Note: Horizontal axis: patient group comparison (A vs B or A vs C) by questionnaire version (V1: first four discussion groups, V2: last four discussion groups). Vertical axis: amount of the budget allocated to each patient group (by $1000). Exercises 1–3: sample size n=66. Exercise 4 (V2 only) sample size n=32.

Supplementary Table 1 shows the amounts of the budget allocated to groups B (pre-existing condition) and C (onset condition) by level of severity (budget allocation exercise) and questionnaire version. It was not possible to reject the null hypothesis (at the p=0.05 level) in any exercise that the amounts allocated to groups B and C were not different. This was so regardless of the order in which the scenarios were presented – i.e., in both version 1 and version 2.
Supplementary Table 2 compares the amounts of the budget allocated to group A (full health) in versions 1 and 2. It was not possible to reject the null hypothesis in any exercise that the amounts allocated to group A were not different, either in the A vs B or A vs C scenario.
Supplementary Table 3 compares the amounts of the budget allocated to group A in version 1 – i.e. by those who received the pre-existing case first – by the level of severity of groups B and C. It was not possible to reject the null hypothesis in either in the A vs B or A vs C scenario that the amounts allocated were not different.
Supplementary Table 4 compares the amounts of the budget allocated to group A in version 2 – i.e. by those who received the onset case first – by the level of severity of groups B and C. Columns 5–7 show that it was not possible to reject the null hypothesis in either in the A vs B or A vs C scenario that the amounts allocated to group A in exercises 1 to 3 were not different. However, columns 8–10 also show that the amounts of the budget allocated to group A in BA 4 were significantly different from the amounts allocated in exercises 1–3, in both the A vs B and A vs C scenarios. In other words, the preference for those who can be returned to full health (group A) was significantly greater when the QoL of the alternative groups (B and C) was at its worst (20%).
3.3 The Likert argument evaluations
The results of the Likert questions are given in Table 3. The arguments found most persuasive were those in favour of an equal division of the budget, and the arguments found least persuasive were those in favour of group B. Arguments (s) and (t), which focused on the similarities between groups B and C and their ‘present and future suffering’, achieved the highest scores overall and were judged persuasive by 91% of participants both in version 1 and version 2. In contrast, the three arguments in support of group B all received higher ‘not persuasive’ scores than ‘persuasive’ scores. Arguments (g), (h) and (i) are the three examples given in the introduction of arguments not explicitly considered in the Damschroder et al. study. Each refers directly or indirectly to Group B’s past health. The adaptation argument (r), also in support of group B, received a higher ‘not persuasive’ score in version 1 and equal ‘persuasive’ and ‘not persuasive’ scores (44%) in version 2. Support for group A was mixed. The arguments found most persuasive were (b) and (c): group A will be in a position to make a more substantial economic contribution, and giving them priority will maximise overall health. The percentage of respondents finding the arguments persuasive (score 5–7) and 95% confidence intervals are given in Supplementary Tables 5 and 6.
While some participants did offer their own reasons in support of their allocation decisions, none of them differed materially from the arguments in Table 3.
3.4 The comprehension questions
Of the 460 comprehension questions (66 participants, seven questions, two missing), 94.13% were answered correctly. The discussions confirm that few participants had difficulty understanding the questions.
4 Discussion
4.1 Budget allocation
The amounts allocated to groups A, B and C did not differ significantly between version 1 and version 2. This indicates that the order in which the questions were introduced had little impact on participant’s priority-setting choices. In brief, the order effect was effectively eliminated.
In each of the budget allocation exercises more was allocated to group A than groups B or C. This confirms that the size of the health improvement achieved by different patient groups is important (Nord et al., Reference Nord, Richardson, Street, Kuhse and Singer1995a; Abellan-Perpiñán and Prades, Reference Abellan-Perpiñán and Prades1999; Roberts et al., Reference Roberts, Bryan, Heginbotham and McCallum1999). However, if participants had sought to maximise health group A would have received 100% of the budget in each exercise. This was not the case. Even when the QALY gain to group B was 80% lower than group A (11 vs 55 QALYs in question 1, exercise 4), over a third of the budget (37.5%) was allocated to them, and when the QALY gain to group B was 45% lower than group A (30 vs 55 QALYs in question 1, exercise 1), nearly half of the budget (46.7%) was allocated to them (Figure 2). This confirms the findings of previous studies that the societal value of an intervention is not proportional to the size of the health improvement (Dolan and Cookson, Reference Dolan and Cookson2000; Nord et al., Reference Nord, Undrum Enge and Gundersen2010).
Also, the amounts allocated to groups B and C did not differ significantly in any of the exercises (Supplementary Table 1). This was so even in exercise 4 when there was an 80% difference in the pre-treatment health states of B and C. This is consistent with the results of the Likert questions, which showed stronger support for an equal division of the budget than for giving group B priority. It is possible the repetition of the exercise may have made respondents want to appear consistent, and thus biased them towards giving the same answer across the two questions within each budget allocation exercise. However, there are good reasons for treating groups B and C differently: for example, it may be considered fair to give more of the budget to group B to compensate them for their past health losses [argument (g)], or to equalise the lifetime health of the two groups [argument (h)] or because group B are members of the disability community [argument (i)]. There was no evidence from the discussions that respondents thought these arguments were inconsistent, or thought that support for them would be perceived by others as inconsistent. It is also worth noting that written answers to the budget allocation exercises were confidential. Here, also, respondents (on average) allocated similar amounts to groups B and C, although the question of how this would appear to others was not an issue.
The results show that past losses in QoL are of relatively little importance for priority setting compared with potential future losses. It cannot be concluded from this that past life-years – i.e. the age of a person, is of little importance, or that life-expectancy is of little importance. It follows that nothing about the life-year version of the fair-innings argument – the idea that people are entitled to a fair minimum length of life – can be inferred from the results of the present study. However, they do pose a challenge to recent studies reporting support for the generalised fair innings argument, which maintains that people are entitled to a fair lifetime allocation of QALYs (Stolk et al., Reference Stolk, Pickee, Ament and Busschbach2005; Dolan and Tsuchiya, Reference Dolan and Tsuchiya2012; Olsen, Reference Olsen2013; Ottersen et al., Reference Ottersen, Maestad and Norheim2014). The lifetime aspect of this view captures the relevance of the past, and the QALY component secures the relevance of QoL. It implies that past losses in QoL are no less important than future losses for the purposes of setting priorities, which is contrary to the findings of the present study. To be consistent with the results presented here, the generalised fair-innings argument would have to countenance applying different weights to past and future losses in QoL. The generalised fair-innings argument is captured in argument (h), which received the lowest ‘persuasive’ score in version 1 and the equal third lowest ‘persuasive’ score in version 2 (Table 3).
4.2 The Likert arguments
Some of the Likert arguments in support of group B received a higher rating in version 1 than version 2. This could be due to the order in which the arguments were presented, or to variations in the amount of time devoted to the different arguments in the different groups. On the other hand, there were also significant similarities between the two sub-samples. For example, in both version 1 and version 2 respondents found the arguments in favour of an equal division of the budget more persuasive than those in favour of group B. This was so both in scenario 1 and scenario 2 (Table 3). Also, both sub-samples gave arguments (s) and (t), which focused on the present and future suffering of groups B and C, their highest ‘persuasive’ scores (91%). Finally – and of most importance from a policy point of view – variations in the weight attached to some of the individual arguments did not translate into significant differences in how the budget was allocated.
Arguments (s) and (t), which achieved the highest Likert scores, support an equal division of the budget on the grounds that the current and prospective health status of groups B and C is the same with and without treatment (s), and that the past cannot be changed (t). The following quotes from the discussions, when respondents were directly comparing groups B and C (scenario 2), are typical of this view:
“The only difference is history…. I don’t think history is relevant, it’s just what benefit can be gleaned from the present point onwards”.
“In the end group C is sounding much the same as group B. Once they reach 25 they are in the same boat”.
“The futures are the same. It doesn’t really matter where you’ve come from”.
“Disregarding what … condition a patient was in yesterday, you’re looking at today … they’re going to be both the same”.
“At the end of the day they’re both equal in terms of treatment. If you’re looking at allocating money – you’ve got a limited budget – simply split down the middle, because they’re both equal … they’re both in a position where they’re going to be at 55 per cent capacity or they die”.
Argument (i) in Table 3 states: ‘The people in group B are members of the disability community and deserve special consideration’. The inclusion of this argument was prompted by Ubel et al.’s observation that “the pre-existing paraplegia scenario makes many people think about the importance of avoiding discrimination against people in the disability community”. Participants accepted that group B are members of the disability community on the basis that they have a permanent health problem that adversely affects their QoL. In more detail, the argument is that the disabled often have a harder life – they come up against significant barriers while trying to do the things others take for granted – both due to their health problems and to systematic social discrimination, and for this reason deserve special consideration. Opinions may differ about whether this is a good argument or not: ~30% of our participants found the argument that ‘the people in group B are members of the disability community and deserve special consideration’ persuasive.
Argument (i) differs from arguments (g) and (h) in the following way. In the discussions of arguments (g) and (h) the focus was on the effect of the disabilities on the individuals in group B. In the discussions of argument (i), which appeals to membership of the disability community, the focus broadened to include society’s response to those with disabilities, not just the effect of the disabilities themselves. The results show that respondents did not consider argument (i) identical to either argument (g) or (h): for example, 11% of version 1 respondents found argument (h) persuasive, while 23% found argument (i) persuasive, and 25% of version 2 respondents found argument (g) persuasive, while 37% found argument (i) persuasive.
4.3 Methodology
If a respondent who received version 1 of the questions allocated 70% of the budget to group A and 30% to group B, and they thought that group C should be a higher priority for treatment than group B, then they should allocate at least 30% to group C in the A vs C comparison. This is exactly what we observe from the budget allocation results. Transitivity of preference is a tricky notion [cf. Arrow’s impossibility theorem (Anand, Reference Anand1993)] and if respondents had violated transitivity it would not necessarily mean they were irrational: we would look for an explanation. But the fact that they did allocate this way strongly suggests that they understood the comparison of A vs C even though it was not directly discussed in version 1. They understood it and allocated the way they did because they had discussed the A vs B and B vs C comparisons and the arguments in Table 3. This is why only version 2 received scenario A vs C. It was included in version 2 because one of the sub-samples had to receive the onset scenario first in order to test for the order effect, but it was not necessary that version 1 receive it.
A unique feature of the present study was the use of group discussions to achieve deliberation with respect to the study questions. This sets the approach apart from self-administered postal surveys, web-based surveys and one-on-one interviews. Deliberation has the potential for producing more rational and informed choices, “because free discussion and open debate allow relevant information to be distributed, mistaken reasoning to be exposed, and all the reasons for and against [views] to be debated and considered” (Freeman, Reference Freeman2000: 383). Additionally, it encourages participants not just to reflect upon alternatives, but to reflect critically upon their own preferences and evaluate them as well-supported by the evidence, fair, and consistent with their other beliefs (Rawls, Reference Rawls1971). The public nature of the discussion groups encouraged participants to find solutions that are in the interests of everyone since justifications that serve narrow self-interest are challenged by others in the group (Jönsson, Reference Jönsson2009; Hakli et al., Reference Hakli, Miller and Tuomela2010). This is consistent with adopting a social rather than a self-interested decision-making perspective.
It is possible that participants who are more confident, or have a higher perceived social status, could have an undue influence on other participants (Morgan, Reference Morgan1997). Several measures were taken to minimise this. For example, the groups were divided into four age strata, which contributes to group cohesiveness and reduces the possibility of imbalances in power or social status that can inhibit discussion (Finch and Lewis, Reference Finch and Lewis2003; Hesse-Biber and Leavy, Reference Hesse-Biber and Leavy2006). One potential downside, however, is that younger participants do not hear the views of older participants, and vice versa. Also, participants were never asked to arrive at a consensus. This avoided creating a competitive situation where one view must prevail, and where dominant individuals may have an undue influence. Finally, the demeanour of the moderator is important in setting the tone and expectations of the discussions. If a respectful, supportive atmosphere is achieved participants are less afraid to participate, and less likely to be swayed by dominant individuals (Morgan and Spanish, Reference Morgan and Spanish1984; Stewart and Shamdasani, Reference Stewart and Shamdasani1990).
Another unique feature of the study was the presentation of the arguments in Table 3. It is possible that this could inhibit the free expression of ideas or bias the direction of discussion. However, it was important that participants were aware of the main arguments in support of different allocation principles and their implications if their choices were to be informed. To minimise bias the arguments were presented (both verbally and in writing) in objective language, the moderator was careful not to convey a personal viewpoint regarding them, and arguments for and against each option were impartially explored. Also, during the initial discussions participants had the opportunity to raise their own considerations before being presented with the arguments in Table 3 to avoid a potential anchoring effect. The aim was to ensure participants were informed about all of the major ethical considerations, while at the same time minimising the possibility of bias.
Some participants in the study may not have agreed that the health state descriptions used in the figures correspond accurately with the percentages. This is an implication of the fact that there is significant heterogeneity in individual preferences for health states (Roberts and Dolan, Reference Roberts and Dolan2004). However, participants were asked to judge from a social rather than a self-interested perspective, so it is appropriate they were given an indication of what the public associates with 70% of full health, 55% of full health, etc. The aim was to achieve an acceptable balance: descriptions were sought (1) that matched up reasonable well, though perhaps short of an exact mapping, with the percentages, and (2) that were relatively easy to remember, reduced the cognitive burden on participants, and provided a common focus for respondents that would lessen differences in interpretation. The EQ5D-5L was chosen because it met these criteria better than the alternatives. Had a more complex set of descriptions been used (e.g. from the SF-6D, HUI 3, 15D or AQoL) this would have increased the cognitive burden on participants. If no descriptions at all were used participants would have lacked a shared understanding of what the community (on average) associates with 70%, 55%, etc. of full health. The discussions confirm that participants accepted that the percentages represent the average social valuation of the health states irrespective of their personal valuation.
4.4 Elimination of the order effect
Three possible explanations for the order effect were considered previously: depending on the order in which the scenarios are received, participants may or may not think about the importance of avoiding discrimination, exaggerate the negative impact of new onset of paraplegia, or focus on the ineffective treatment. While differing in their details, all three explanations appeal to a form of anchoring: respondents have an immediate reaction to the first question (either the pre-existing or onset scenario) which significantly influences their answer to the second. In the present study participants engaged in a process of critical self-examination that allowed them to move beyond their first reactions. This was facilitated by the direct comparison of the pre-existing and onset scenarios, the opportunity for deliberation with others, and presentation and discussion of the Likert arguments. It would be possible to measure the relative influence of these factors by varying one while holding the others constant. However, the purpose of the present study was not to investigate the precise causes of the order effect, but to cast light on respondent’s consistent, underlying preferences and the reasons for them.
The thought might occur that the differences between the results in the present study and those in the earlier studies could be due to the choice of health states. If they are less severe than paraplegia – the health state used in the Ubel et al. and Damschroder et al. studies – this could explain the absence of an order effect. However, in BA 4 both patient groups would remain in, or be left in, severe pain or discomfort and severe anxiety or depression without treatment. This rates 0.20 on the EQ5D-5L and a number of other scales (Patrick et al., Reference Patrick, Starks, Cain, Uhlmann and Pearlman1994), whereas paraplegia rates about 0.48 (Bahena-Salgado and Bernal-Márquez, Reference Bahena-Salgado and Bernal-Márquez2007). The latter study measured self-reported QoL among 23 paraplegic patients using the Functional Independence Measure scale and the EQ-5D. It is unlikely then that the differences between the results are attributable to the choice of health states. In fact, including health states both worse than and better than those used in the previous studies provided a test of whether the order effect is a function of the level of severity.
The possibility cannot be ruled out that for some unknown reason, or purely by chance, the recruitment of subjects lead to atypical groups that were resistant to order effects from the outset. However, we know from the previous studies that people are susceptible to the order effect, and there is nothing to suggest our participants were different in this regard. Participants were recruited by a professional recruitment company to achieve gender balance and a range of age, income and educational levels. There was an element of self-selection since all subjects volunteered to register with the recruitment company. But there is no obvious connection between this and lack of susceptibility to framing effects. Further, the opening questions revealed no significant differences between our sample and the earlier studies on this topic. While it remains a possibility that our sample was atypical of the general public and resistant to the order effect, we think the more plausible explanation is that the opportunity for deliberation, the direct comparison of the pre-existing and onset cases, and exposure to the Likert arguments eliminated inconsistency.
4.5 Study limitations
The study was subject to a number of limitations and caveats. The first was the small sample size. There were practical reasons for this. Group discussions like those described here (as well as one-on-one interviews) are expensive to run on a large scale. Postal or online surveys are relatively cheap by comparison, but provide limited opportunities for respondents to consider problems in depth or to benefit from deliberation. From a practical point of view the best approach to the investigation of preferences on conceptually and ethically challenging issues is a mixture of large-scale postal or online surveys in combination with a smaller number of more intensive studies where greater efforts can be taken to ensure that participants understand the questions and have to time reflect, deliberate and seek clarification of the task.
How the results of studies employing different data collection methods are to be combined is a challenging question. On the basis of ‘eyeballing’ the results of a number of preference studies on potential to benefit and severity of illness, Nord formulated ‘rules of thumb’ to guide decision-makers. He acknowledges that the evidence is “scattered and heterogeneous” (Nord, Reference Nord1999: 37), that the rules encapsulate social preferences “to a reasonable degree” (p. 43), and that quantitative models for estimating the societal value of health care activities should – ‘at least roughly’ (p. 43) – reflect the structure of concern encapsulated in the rules. Although this approach lacks a degree of precision in the early stages, as new data is accumulated the ‘rules of thumb’ can be modified, re-tested and gradually made more precise.
Despite the relatively small number of participants, the opening questions revealed no significant differences between our sample and the earlier studies. While this does not demonstrate that our sample was fully representative of the broader population, it does provide evidence that our participants were not highly atypical in their opinions regarding this topic. Nevertheless, caution must be exercised in drawing general conclusions when sample sizes are small, and the present study should be considered exploratory in nature.
Other limitations arose from the need to reduce the cognitive burden on participants. For example, the result of non-treatment was always immediate death. This context was chosen to preserve comparability with the Ubel et al. and Damschroder et al. studies. Also, the need for treatment always occurred at age 25, which was chosen due to the importance of the social and economic contribution of people at this age. Another limitation was the small number of generic health states used. It is possible, for example, that people may be more willing to compensate for past pain than for past problems with mobility or self-care. It was beyond the scope of the present study to investigate these issues. Nevertheless, if these or other features of the scenarios were different results could potentially also differ.
5 Conclusion
The order effect jeopardises the task of determining how much value the public places on the health gains achieved by the permanently disabled and chronically ill. The present study effectively eliminated the order effect by giving participants the opportunity to directly compare the pre-existing and onset cases, by encouraging in-depth discussion of the issues and ensuring participants were ethically informed. The results show substantial support for the equal treatment of the disabled and chronically ill – allowing people to realise their potential for health even if this is limited – in the cases described here. This was so regardless of whether participants received the pre-existing or onset scenario first. Similarly, the equal treatment of the pre-existing group and the onset group implies support for policies that do not discriminate between patients on the basis of their prior disease status. In general, the results challenge economic evaluation studies that rank alternative programmes, services and policies simply according to their cost-effectiveness ratios and neglect distributional effects.
As well as the limitations and caveats mentioned above, more empirical work is needed before accurate estimates of the relevant equity-efficiency trade-offs can be made. But the results indicate that, when preferences are not confounded by the order effect, people are willing to trade-off health gains to benefit those with a limited potential to benefit from treatment and, in the context of life-saving treatment, support the equal treatment of those with pre-existing permanent disabilities and those who will be left with unavoidable long-term health problems as a result of treatment that is not entirely effective.
Acknowledgements
The research described in this article was made possible through a National Health and Medical Research Council project grant (ID: 1044470). Our thanks to Munir Khan and Gang Chen for help with the statistical analyses and to Jan Abel Olsen for helpful comments on an earlier draft.
The authors declare they have no conflicts of interest.
Supplementary material
To view supplementary material for this article, please visit https://doi.org/10.1017/S1744133118000154