I. INTRODUCTION
Improving the mechanical and structural properties of Mg alloys is needed for increasing their use in the automobile and aircraft industries. However, low formability and strength, especially at high temperature, can limit their use in certain applications. It was found that the problems of such poor mechanical properties could be improved by adding proper amounts of alloying elements. For instance, Zn is one of the alloying elements added to Mg to improve its room temperature strength and corrosion resistance. Reference Ghosh, Mezbahul-Islam and Medraj1 Mg can dissolve small amount of Zn necessary for solution strengthening and precipitation hardening. Larger amounts of Zn result in the formation of Mg–Zn intermetallic compounds. Rare earth (RE) elements are also added to improve the mechanical properties of Mg–Zn alloys, because they form various intermetallic compounds with different crystal structures. Reference Pahlman and Smith2,Reference Ferro, Saccone and Borzone3 These compounds usually show high thermal stability and distribute along the grain boundaries in the form of fine precipitates. Reference Tao, Ouyang, Liu, Feng, Du, He and Jin4 The existence of such precipitates leads to enhancing the mechanical properties by hindering the dislocations motion which thereby provides the strengthening effect.
Among the available REs, diffusion of cerium (Ce) and neodymium (Nd) in magnesium (Mg) and zinc (Zn) will be investigated in this work. Commercial sources of Nd are commonly extracted from Monazite ores, which normally contain high Ce content. Reference Zhu and O'Nions5 Recently, many studies were carried out to produce sheet metals out of Mg alloys containing RE elements. Reference Stanford and Phelan6 Attempts were performed to replace Nd by Ce, since they show almost the same phase relationships with Mg and Zn. Furthermore, because Nd ores contain higher Ce content, using Ce could be the best economical choice on the industrial level.
Understanding the interatomic diffusion is very important to describe the solidification, crystal growth, and precipitation processes of different metallic systems. The main goal of this work is to determine the interdiffusion coefficients of Zn in Mg and Ce and Nd in both Mg and Zn using diffusion couples and Boltzmann–Matano analysis. Reference Matano7,Reference Shewmon8 Different diffusion couples between pure elements were prepared and annealed at different temperatures, in which several phases in thermodynamic equilibrium formed by diffusion reaction. Once the interdiffusion coefficients are determined, the activation energies and preexponential factors can be obtained using Arrhenius equation. Reference Callister and Rethwisch9
II. LITERATURE REVIEW
The diffusion coefficients of Ce and lanthanum (La) in Mg were first determined by Lal and Levy
Reference Lal and Levy10
using diffusion couple technique. The diffusion couples were made from pure Mg and MgRE (RE = Ce and La) end-members annealed at several temperatures for different time periods. Table I gives the diffusion coefficients along with the activation energy (Q
d) and preexponential factor
 $\left( {{{\tilde D}_{\rm{0}}}} \right)$
of Ce in Mg at different temperatures.
Diffusion coefficients along with the activation energy and preexponential factor of Ce in Mg at different temperatures. Reference Lal and Levy10

Many studies were made to find an alternative commercial source for neodymium (Nd) metal. Extracting Nd from Neodymium Iron Boron (NdFeB) magnet scrap was one of the suggested ideas. Xu et al. Reference Xu, Chumbley and Laabs11 developed a new approach to recycle magnets scrap. They Reference Xu, Chumbley and Laabs11 used liquid magnesium (Mg) to extract Nd from NdFeB scrap relying on the capability of Nd to form several intermediate compounds with Mg. Since iron (Fe) and boron (B) are immiscible in liquid Mg, they will not be accepted by liquid Mg. The average diffusion coefficients of Nd in liquid Mg were reported and given in Table II.
Calculated values of average diffusion coefficients of Nd in liquid Mg. Reference Xu, Chumbley and Laabs11

Later, the binary interdiffusion coefficients of dysprosium (Dy), Nd, and praseodymium (Pr) in Mg were measured by Xu et al. Reference Xu, Chumbley, Weigelt and Laabs12 using diffusion couple technique and Boltzmann–Matano analysis. The Nd/Mg diffusion couples were annealed at 500 °C for 300, 100, and 300 h, respectively. The composition profiles across the diffusion zones were measured using scanning electron microscopy (SEM)/energy-dispersive x-ray spectroscopy (EDS). The diffusion coefficients at each interface of the Mg/Nd diffusion couple, measured by Xu et al. Reference Xu, Chumbley, Weigelt and Laabs12 at 500 °C, are mentioned in Table III. In their Reference Xu, Chumbley, Weigelt and Laabs12 study, many compounds were missing; these compounds are: DyMg, DyMg2, Mg41Nd5, and MgPr. They presumed that the proposed phase diagrams were incomplete and with large amount of uncertainty. Also, they related the absence of these phases to the difficulty of working with Mg. In contrast, Mg41Nd5, for example, was observed in the work of Brennan et al. Reference Brennan, Bermudez, Sohn, Pool and Kainer13 who annealed three Mg/Nd diffusion couples at 400, 450, and 500 °C for 504, 360, and 240 h, respectively. However, Brennan et al. Reference Brennan, Bermudez, Sohn, Pool and Kainer13 missed the MgNd compound from all the diffusion couples. They Reference Brennan, Bermudez, Sohn, Pool and Kainer13 calculated the activation energy and preexponential factor of the Mg41Nd5 and Mg3Nd compounds as listed in Table IV. Resolving the difficulty of missing some of the compounds in the diffusion couples and explaining the possible reasons for this phenomenon will be attempted in this work.
Diffusion coefficients of Mg–Nd system at 500 °C. Reference Xu, Chumbley, Weigelt and Laabs12

Activation energy and preexponential factor for the growth of Mg41Nd5 and Mg3Nd phases according to Brennan et al. Reference Brennan, Bermudez, Sohn, Pool and Kainer13

According to Kulkarni and Luo, Reference Kulkarni and Luo14 two isothermal diffusion couple experiments at two different times are required to accurately determine the layer growth constant. Brennan et al. Reference Brennan, Bermudez, Sohn, Pool and Kainer13 determined the Mg41Nd5 and Mg3Nd layer growth constants at three different temperatures and one annealing time only. Thus, similar experiments with different annealing time periods were carried out in this work for obtaining more accurate results.
Sakakura and Sugino Reference Sakakura and Sugino15 calculated the growth constants and interdiffusion coefficients of Mg–Zn system using diffusion couples technique, considering the diffusion mechanism in the eutectic alloys. Diffusion couples were annealed at 250 °C for 100 and 148 h and at 300 °C for 72, 110, and 148 h. Two intermetallics were observed, MgZn2 and Mg2Zn11, and their growth rates were evaluated. The interdiffusion coefficient, activation energy, and preexponential factor of phase growth calculated by Sakakura and Sugino Reference Sakakura and Sugino15 are listed in Table V.
Interdiffusion coefficient, activation energy, and preexponential factor for the growth of MgZn2 and Mg2Zn3 phases according to Sakakura and Sugino. Reference Sakakura and Sugino15

Recently, Brennan et al. Reference Brennan, Bermudez, Kulkarni and Sohn16 calculated the activation energy of growth of MgZn2 and Mg2Zn3 phases using diffusion couples technique. Diffusion couples were annealed at 295, 315, and 325 °C for 384, 168, and 120 h, respectively. In their Reference Brennan, Bermudez, Kulkarni and Sohn16 work, the MgZn phase was not observed in all diffusion couples. Also, the activation energy and preexponential factor of the layer growth was calculated for MgZn2 and Mg2Zn3 only, as listed in Table VI. These will be obtained for all the stable Mg–Zn compounds in this work up to 300 °C.
Activation energies and preexponential factors for the growth of Mg2Zn3 and MgZn2 phases according to Brennan et al. Reference Brennan, Bermudez, Kulkarni and Sohn16

No data regarding the interdiffusion coefficients of Zn–{Ce, Nd} intermetallics could be found in the literature. Thus, it is essential to provide the diffusion information about these systems as well.
III. ANALYTICAL BACKGROUND
The Boltzmann–Matano analysis
Reference Matano7,Reference Shewmon8
is widely used to measure the composition-dependent interdiffusion coefficients
 $\tilde D\left( {{C^{\rm{0}}}} \right)$
from experimental composition profiles. The composition profiles are usually obtained by elemental analysis techniques across the diffusion zones in the diffusion couples experiments. Once the composition profiles are measured, then,
 $\tilde D\left( C \right)$
can be obtained as
Reference Matano7,Reference Shewmon8
:
 $$\tilde D\left( {C'} \right) = {\left. {\left( { - {1 \over {2t}}{{{\rm{d}}x} \over {{\rm{d}}C}}} \right)}\! \right|_{C'}}\int_{{C^ - }}^{C'} {\left( {x - {x_0}} \right){\rm{d}}C} \quad ,$$
where C is the concentration and
 $C'$
is the concentration at a specific location x
0,
 ${C^ - }$
is the concentration of the terminal component, x is the diffusion distance, and t is the time. The position of Boltzmann–Matano plane, x
0, can be determined based on mass balance by the following equation
Reference Kulkarni and Luo14,Reference Du, Zhang, Cui, Zhao, Liu, Zhang, Sun and Jie17
:
 $$\int_{{x^ - }}^{{x_0}} {\left( {C' - {C^ - }} \right){\rm{d}}x} = \int_{{x_0}}^{{x^ + }} {\left( {{C^ + } - C'} \right){\rm{d}}x} \quad ,$$
where
 ${C^ + }$
and
 ${C^ - }$
are the concentrations of the terminal components of the diffusion couple and x
+ and x
− are the left and right far distances from Boltzmann–Matano plane x
0. According to Mehrer,
Reference Mehrer18
if the following boundary conditions are applied
 $$\eqalign{ & C = {C^ - }\;{\rm{for}}\;\left( {x \,\lt \,0,t = 0} \right)\quad , \cr & C = {C^ + }\;{\rm{for}}\;\left( {x > 0,t = 0} \right)\quad . \cr}$$
The following integrals balance across the Matano plane
 $$\int_{{C^ + }}^{C'} {x{\rm{d}}C} + \int_{C'}^{{C^ - }} {x{\rm{d}}C} = 0\quad .$$
This method is applicable for both single- and multiphase systems since the assumption is valid even when there is a discontinuity at the phase boundary in the concentration profiles. Reference Wallach19
For measuring the activation energy (Q
d) and preexponential factor (D
0) at any interface in a diffusion couple, diffusion couple experiments are carried out at different temperatures. After obtaining
 $\tilde D\left( {{C^{\rm{0}}}} \right)$
for each temperature, Arrhenius equation
Reference Callister and Rethwisch9
can be applied as following:
 $$\tilde D = {\tilde D_0}\exp \left( { - {{{Q_{\rm{d}}}} \over {RT}}} \right)\quad ,$$
where Q
d and
 ${\tilde D_0}$
are the activation energy and the preexponential factor for interdiffusion, respectively, R is the gas constant, and T is the absolute temperature. Equation (5) suggests that the Q
d and
 ${\tilde D_0}$
for interdiffusion can be determined by plotting
 $\log \tilde D$
versus 1/T,
Reference Kulkarni and Luo14
in which the slope of the linear segment is equal to −Q
d/2.3R and the intercept at 1/T = 0 is the value of
 $\log {\tilde D_0}$
.
Reference Callister and Rethwisch9
IV. EXPERIMENTAL PROCEDURE
Diffusion couples were prepared from pure Mg (99.8%), Ce (99.96%), Nd (99.98%), and Zn (99.99%) metals. The contacting surfaces were ground gradually up to 1200 silicon carbide (SiC) paper using 99% pure ethanol as a lubricant and to protect metals from oxidation. After that, the ground surfaces were metallographically polished to 1 µm using alcohol-based alumina suspension. The end-members were ultrasonically cleaned in pure ethanol and then clamped together using stainless steel clamping rings. The clamped end-members were then wrapped in tantalum foils, to eliminate direct contact with the tube walls, and encapsulated inside an argon-flushed quartz tube with a vacuum of around 1 × 10⁻² Torr. The diffusion couples were then annealed at the target temperature in a box furnace with a temperature control of ±3 °C. The annealing time periods of the Mg–Nd diffusion couples were chosen carefully based on our systematic annealing and quenching studies and benefiting from the literature data. Reference Xu, Chumbley, Weigelt and Laabs12,Reference Brennan, Bermudez, Sohn, Pool and Kainer13 For instance, Xu et al. Reference Xu, Chumbley, Weigelt and Laabs12 annealed the Mg/Nd diffusion couple at 500 °C for 100 h, but their micrographs showed the formation of MgNd and Mg3Nd layers only. On the other hand, Brennan et al. Reference Brennan, Bermudez, Sohn, Pool and Kainer13 annealed the Mg/Nd diffusion couples at 400, 450, and 500 °C for 504, 15, and 24 h, respectively. Their Reference Brennan, Bermudez, Sohn, Pool and Kainer13 micrographs showed the formation of Mg41Nd5 and Mg3Nd layers only. The MgNd phase was not observed. This could be due to overannealing which makes other phases dominate the MgNd layer. Hence, in this work, different annealing temperatures and times were tried to obtain all the compounds in all the studied systems. After the diffusion annealing, the diffusion couples were quenched from the annealing temperature into cold water for obtaining the high temperature structure.
The composition profiles were obtained using Hitachi S-3400 SEM (Tokyo, Japan) equipped with wavelength dispersive spectroscopy (WDS) and EDS detectors. The WDS error of measurements was estimated to be ±1.0 at.% for Mg, Nd, and Zn, whereas Ce oxidation resulted in higher error of about ±2.0 at.%, in the worst case, because Ce end-member was used as calibration standard for WDS measurements. It is worth noting that in some layers the error was significantly lower than this limit, e.g., CeMg layer. Besides, this is not expected to give significant errors in the diffusion coefficients calculations because composition gradient is more critical for interdiffusion coefficients calculation than the absolute composition values.
V. RESULTS AND DISCUSSION
The diffusion couples of five binary systems studied in this work were evaluated, and the diffusion layers, representing intermetallic compounds, were compared with the equilibrium diagram of each system to gain confidence about the reliability of the results. For each system, composition profiles were measured using EDS/WDS line-scans across the diffusion zones. Accordingly, position of Matano plane Reference Matano7 was identified at the interface between each two diffusion layers. Composition-dependence diffusion coefficients were measured from the concentration profiles using Boltzmann–Matano analysis. The activation energies and preexponential factors of the intermetallic phases were calculated using Arrhenius equation.
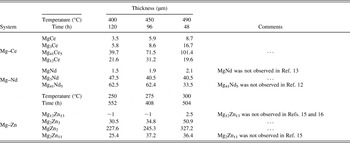
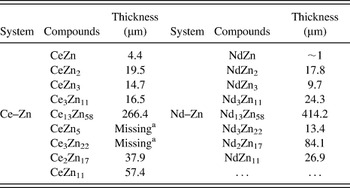
In this section, the results of the diffusion couples are presented in two groups. The first group contains Mg–{Ce, Nd, Zn} diffusion couples annealed at three different temperatures for different time intervals. Thus, the activation energies and preexponential factors along with composition dependent diffusion coefficients are provided. The second group contains Zn–{Ce, Nd} diffusion couples annealed at 400 °C for 240 h. For this group, only the composition-dependent diffusion coefficients are presented. It is highly challenging to obtain all the expected phases for such systems at every annealing temperature, because they have large number of intermetallic compounds. The detection of these compounds is also difficult, since there is no big difference in their composition, specifically in the Zn-rich side. Thus, there would be higher chance for experimental errors than for the first group. The experimental data of the first group diffusion couples are summarized in Table VII, and the results of the second group are in Table VIII.
Annealing conditions of the Mg–Ce, Mg–Nd, and Mg–Zn diffusion couples and the layers thickness of intermetallics.

The layers thickness of intermetallics in Ce–Zn and Nd–Zn diffusion couples annealed at 400 °C for 240 h.

a These compounds were observed in the diffusion couple annealed at 400 °C for 48 h.
A. Mg–{Ce, Nd, Zn} binary systems
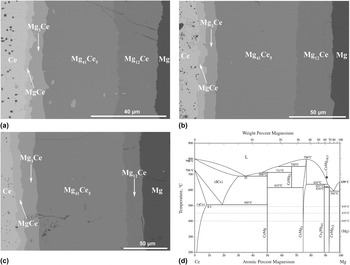
Backscattered electron images of the Mg–Ce diffusion couples, annealed at 400, 450, and 490 °C for 120, 96, and 48 h, respectively, are shown in Figs. 1(a)–1(c). Four diffusion layers were observed in all the diffusion couples. WDS spot-analysis confirmed the presence of four compounds, namely, MgCe, Mg3Ce, Mg41Ce5, and Mg12Ce. This is consistent with the Mg–Ce phase diagram, Reference Okamoto20 shown in Fig. 1(d), in the temperature range between 400 and 490 °C. The interface between diffusion layers indicates the local equilibria between the corresponding compounds. The occurrence of the correct number of layers and associated compounds is necessary for sound interdiffusion analysis using diffusion couples.
Backscattered electron images of Mg–Ce diffusion couples annealed at (a) 400 °C for 120 h, (b) 450 °C for 96 h, (c) 490 °C for 48 h, and (d) Ce–Mg binary phase diagram Reference Okamoto20 with the annealing temperatures marked as dashed lines.

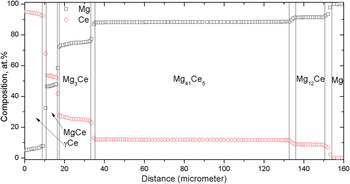
WDS line-scans were performed across the diffusion zones between the end-members. The composition profile of Mg–Ce diffusion couple, annealed at 490 °C and 48 h, is presented in Fig. 2. The composition profiles within the Mg12Ce and Mg41Ce5 layers show constant compositions of 92 and 88.6 at.% Mg, respectively. This means that these compounds are stoichiometric. The diffusion layers of MgCe and Mg3Ce show deviation from constant composition. Thus, Mg3Ce is a solid solution with a homogeneity range of 1.0, 1.3, and 2.3 at.% at 400, 450, and 490 °C, respectively. Although the Mg and Ce terminal far ends of the diffusion couples were used as standard metals for WDS calibration, the stoichiometry in the MgCe phase was not 1:1 in the three diffusion couples. However, this deviation is not expected to give significant errors in the diffusion coefficients calculations.
Composition profiles of the Mg–Ce diffusion couples annealed at 490 °C and 48 h.

The dark spots in the Ce end-member are residues from the hard constituents of the polishing paste as inferred from the WDS analysis. The same residues were seen in the pure Ce end-member in the work of Kevorkov and Pekguleryuz. Reference Kevorkov and Pekguleryuz21 This is because pure Ce is very soft. Despite ultrasonic cleaning in alcohol bath, alumina particles were embedded in Ce and were difficult to remove.
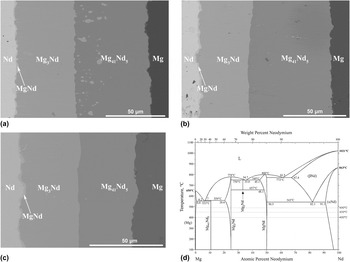
Backscattered electron images of Mg–Nd diffusion couples, annealed at 400, 450, and 490 °C for 120, 96, and 4 h, respectively, are shown in Figs. 3(a)–3(c). Three diffusion layers appeared in all diffusion couples. These three layers are MgNd, Mg3Nd, and Mg41Nd5. This agrees with the Mg–Nd phase diagram Reference Okamoto22 shown in Fig. 3(d). WDS line-scans were used to determine the homogeneity ranges of the terminal members and intermediate compounds. The terminal solubility of Mg in Nd was determined from the three diffusion couples as 6.3, 7.6, and 8.2 at.% Mg, at 400, 450, and 490 °C, respectively.
Backscattered electron images of Mg–Nd diffusion couples annealed at (a) 400 °C for 120 h, (b) 450 °C for 96 h, (c) 490 °C for 48 h, and (d) the Mg–Nd phase diagram Reference Okamoto22 with the annealing temperatures marked as dashed lines.

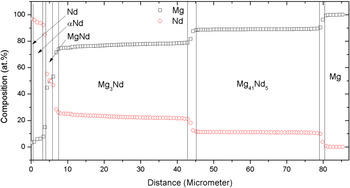
The plot of composition profile of the diffusion couple annealed at 490 °C and 48 h is presented in Fig. 4. The composition profiles within the Mg41Nd5 layer show constant composition of ∼88.6 at.% Mg; whereas, the diffusion layers of Mg3Nd appeared with a slope, which indicates the presence of a homogeneity range at 400, 450, and 490 °C as 3.35, 3.61, and 3.85 at.% Mg, respectively. MgNd occurred in all diffusion couples with very low thicknesses of 1.5, 1.9, and 2.1 µm at 400, 450, and 490 °C, respectively. The spatial displacement of WDS line-scans was reduced to ∼0.5 µm across the MgNd diffusion layer to acquire more readings from its thin layer.
Composition profile of the Mg–Nd diffusion couple annealed at 490 °C and 48 h.

The Mg41Nd5 diffusion layer, in the couple annealed at 400 °C for 120 h, shown in Fig. 3(a), appeared with remaining traces of Mg3Nd. Similar to this was observed in the Mg–Ce diffusion couple annealed under the same conditions, Fig. 1(a). It seems that the growth rate of the Mg41Ce5 and Mg41Nd5 compounds at the Mg3RE/Mg41RE5 interface is relatively high at 400 °C. This will be discussed in more details with experimental evidence in the interdiffusion coefficient calculations of this section.
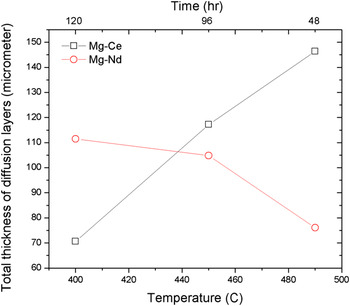
The activation energy and preexponential factor of the growth of the Mg–Ce compounds were found higher than those of Mg–Nd compounds, as can be concluded from Table IX. This means that higher energy is required for the Ce–Mg compounds to grow at the same rate as those of Nd–Mg. Thus, the total thickness of Ce–Mg diffusion layers is higher than those of Mg–Nd, in spite of the fact that the Mg–Ce and Mg–Nd diffusion couples were annealed at the same time and temperature as demonstrated in Fig. 5. The increase in the activation energy of Mg–Ce compounds can be correlated to the larger atomic radius of Ce. This was proved using density-functional theory (DFT), where all RE elements exhibit significant increase in the activation energy with increasing the solute volume. Reference Huber, Elfimov, Rottler and Militzer23
Interdiffusion coefficients at Boltzmann–Matano planes at the interfaces of the Mg–{Ce, Nd, Zn} diffusion layers.

The total thickness of Mg–Ce and Mg–Nd diffusion zones with temperature regardless the annealing time.

Huber et al. Reference Huber, Elfimov, Rottler and Militzer23 used DFT to calculate activation energies for diffusion of aluminum (Al), calcium (Ca), and several RE elements in Mg. The predicted solute-vacancy binding and exchange energies increase and decrease, respectively, with increasing solute size. Using the eight-frequency model for hcp lattices, they Reference Huber, Elfimov, Rottler and Militzer23 determined correlation factors for each solute.
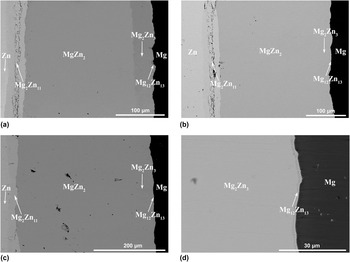
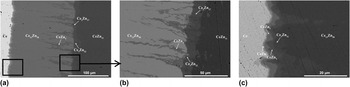
Backscattered electron images of Mg–Zn diffusion couples, annealed at 250, 275, and 300 °C for 552, 408, and 504 h, are shown in Figs. 6(a)–6(c). The 300 °C diffusion couple was first annealed for 350 h to follow the growth trend, i.e., higher temperature would require less annealing time. All the phases at 300 °C were observed; nevertheless, the cracks in the Mg2Zn11 diffusion layer did not allow for determining the interfaces on both sides clearly. This could be due to brittleness of this compound as well as the presence of the original diffusion interface. Thus, the same diffusion couple was annealed for 504 h to overcome the cracking problem by obtaining thicker Mg2Zn11 layer. Four intermetallic compounds, namely, Mg12Zn13, Mg2Zn3, MgZn2, and Mg2Zn11, were observed. Figure 6(d) shows the Mg12Zn13 as a thin layer growing between Mg2Zn3 and pure Mg. The Mg51Zn20 was not observed in the Mg–Zn diffusion couples, because the annealing temperatures were intentionally selected below its stability temperature. This provides more practical diffusion data regarding the low temperature compounds that are present in Mg alloys at service temperature.
Backscattered electron images of Mg–Zn diffusion couples annealed at (a) 250 °C for 552 h, (b) 275 °C for 408 h, (c) 300 °C for 504 h, and (d) magnified image from (c).

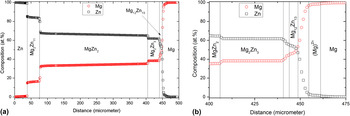
The composition profile across Mg–Zn diffusion couple, annealed at 300 °C for 504 h, is shown in Figs. 7(a) and 7(b). The composition profiles confirmed the existence of three stoichiometric compounds (Mg12Zn13, Mg2Zn3, and Mg2Zn11) and one intermediate solid solution, MgZn2. The solubility range of MgZn2 was determined at 250, 275, and 300 °C as ∼1, 1.3, and 2.1 at.%, respectively. Figure 7(b) represents part of the composition profile shown in Fig. 7(a) to emphasis on the solubility of Zn in Mg. Accordingly, the solubility of Zn in Mg was determined as 1.5 at.% Zn at 300 °C.
(a) and (b) The composition profile across Mg–Zn diffusion couple annealed at 300 °C for 504 h.

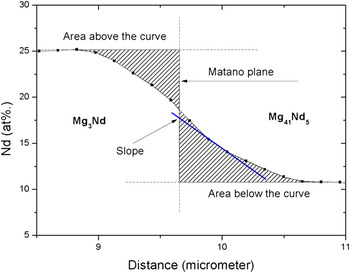
The experimental composition profiles determined by WDS line-scans for all diffusion couples were analyzed for interdiffusion coefficients using Boltzmann–Matano method, Reference Matano7,Reference Shewmon8 in which interdiffusion fluxes can be measured at any location of a diffusion couple. Reference Matano7 In this work, the position of Boltzmann–Matano interface was determined from the composition profiles when the integrated areas above and under the curve are equal [Eq. (4)]. Using this method, Boltzmann–Matano plane position was determined at every intermetallic interface within the Mg–{Ce, Nd, Zn} and Zn–{Ce, Nd} diffusion couples. Once the plane position is known, the composition-dependent diffusion coefficient can be calculated for any given composition based on Eq. (1). The following example illustrates the calculation of composition-dependent interdiffusion coefficient at the Mg3Nd/Mg41Nd5 interface at 450 °C. The composition of Nd falls across the interface from 25 at.% until it reaches 10.8 at.% as shown in Fig. 8. Then, the integrated areas above and below the curve can be calculated while changing the location of the vertical line until the areas are equal. The point at which the areas are equal represents Boltzmann–Matano plane location. The same procedure is followed to determine Boltzmann–Matano plane at the other interfaces.
Demonstration of Boltzmann–Matano plane determination at the Mg3Nd/Mg41Nd5 interface.

The value of
 $\tilde D$
can be calculated at any given composition C by measuring the area
 $\int_{{C^0}}^C {\left( {x - {x_0}} \right){\rm{d}}C}$
and the slope
 ${{{\rm{d}}x} \over {{\rm{d}}C}}$
. For Mg3Nd/Mg41Nd5 interface,
 $\int_{{C^0}}^C {\left( {x - {x_0}} \right){\rm{d}}C} = 5.173 \times {10^{ - 4}}$
,
 ${{{\rm{d}}x} \over {{\rm{d}}C}} = - 19,145$
. Thus according to Eq. (1),
 $\tilde D = 3.0 \times 10^{ - 13} \,{\rm{cm}}^2 /$
s. Similarly calculations at other interfaces in all the studied systems were performed. Table IX summarizes the Boltzmann–Matano plane positions and the calculated interdiffusion coefficients at every interface and temperature of Mg–{Ce, Nd, Zn} diffusion couples.
Figures 1 and 3(a) show that apparent two phase regions exist in the Mg–Ce and Mg–Nd diffusion couples annealed at 400 °C for 120 h. The interdiffusion coefficients of Mg3Ce/Mg41Ce5 and Mg3Nd/Mg41Nd5 interfaces, at 400 °C, show higher values than for the other adjacent interfaces, Table IX. This means that the interatomic diffusion of Mg atoms through Mg41{Ce,Nd}5 compound layers is faster than those of neighboring compounds at 400 °C resulting in a very wavy interface that appears as two phase region. Also, this could be the reason of having traces of Mg3{Ce,Nd} compounds in the Mg41{Ce,Nd}5 diffusion layers.
Lal and Levy Reference Lal and Levy10 measured the diffusion coefficient of Ce–Mg system considering a solid solution having a continuous composition profile assuming complete miscibility between the two components. However, the Ce–Mg should be treated as multiple-phase system, since four stable intermetallic compounds exist in the temperature range of 550–600 °C.
Xu et al. Reference Xu, Chumbley and Laabs11 measured the diffusion coefficients of Mg–Nd system as a result of solid–liquid diffusion reaction. Therefore their measured coefficients were much higher than those obtained by Xu et al., Reference Xu, Chumbley, Weigelt and Laabs12 who used solid–solid diffusion reaction. Because Mg3Nd/Mg41Nd5 and Mg41Nd5/Mg interfaces were missing in the work of Xu et al., Reference Xu, Chumbley, Weigelt and Laabs12 the diffusion coefficient at the Mg3Nd/Mg interface could not be compared with their work. Comparing the interdiffusion coefficients of Mg–Nd intermetallics calculated in this work, Table IX, with the values reported by Xu et al., Reference Xu, Chumbley, Weigelt and Laabs12 Table III, the diffusion coefficients at the Nd/MgNd and MgNd/Mg3Nd interfaces show the same order of magnitude. However, the magnitude of the current values is much higher than those calculated by Brennan et al. Reference Brennan, Bermudez, Sohn, Pool and Kainer13 Same observation was noticed regarding the magnitude of interdiffusion coefficients of the growth of the Mg–Zn compounds. There is an agreement between Sakakura and Sugino Reference Sakakura and Sugino15 and Brennan et al., Reference Brennan, Bermudez, Kulkarni and Sohn16 whereas the values provided in this work are much lower. This is due to the fact that the interdiffusion coefficients were measured within each individual intermetallic layer Reference Brennan, Bermudez, Sohn, Pool and Kainer13,Reference Brennan, Bermudez, Kulkarni and Sohn16 using the parabolic growth constant formula Reference Philibert24 instead of the diffusion at the interface. Boltzmann–Matano interface is defined as being the plane across which an equal number of atoms have crossed in both directions. Reference Green, Humphreys, Mackenzie and Jones25 The current work focuses on providing these coefficients at the interface of the intermetallic compounds. Thus, our results are in good agreement with Xu et al. Reference Xu, Chumbley, Weigelt and Laabs12 who also obtained the diffusion coefficients at the interfaces.
Matano
Reference Matano7
considered the value of
 $\tilde D$
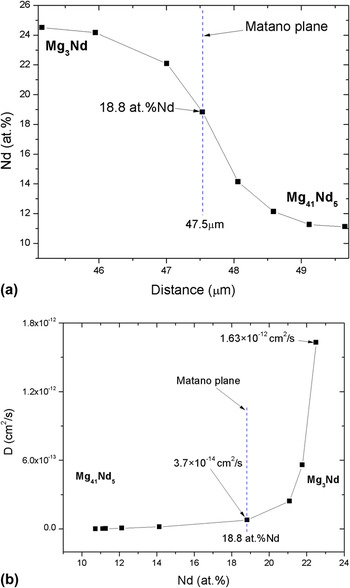
as a function of composition where the coefficient of diffusion decreases rapidly with composition; except at some point, where the values retained nearly the same even though the composition is changing. The point where the diffusion coefficient becomes almost constant represents the location of Matano plane. This implies that, once we move away from the interface, the diffusion coefficient value changes. This is illustrated in Fig. 9, which represents the drop in the
 $\tilde D$
value with composition and then the value remains almost constant where Matano plane exists. Thus, the calculated coefficients here could be more or less close to the values given in Refs. Reference Brennan, Bermudez, Sohn, Pool and Kainer13, Reference Sakakura and Sugino15, and Reference Brennan, Bermudez, Kulkarni and Sohn16, if one considers the transient diffusion values and not those at the interface. The
 $\tilde D$
value near Mg3Nd diffusion layer at 450 °C, in Fig. 9, reads as 1.63 × 10⁻¹² cm2/s, which is still close to 1.7 × 10⁻¹¹ cm2/s that was reported by Brennan et al.
Reference Brennan, Bermudez, Sohn, Pool and Kainer13
at the same temperature. This indicates that farther from the interface toward the center of the Mg3Nd layer, the diffusion coefficient becomes closer to the values measured by Brennan et al.
Reference Brennan, Bermudez, Sohn, Pool and Kainer13
The same applies to other intermetallic compounds.
(a) The composition profile at the Mg3Nd/Mg41Nd5 interface, and (b) corresponding interdiffusion coefficient versus at.% Nd composition at the Mg3Nd/Mg41Nd5 interface.

The composition-dependent interdiffusion coefficients were then used to calculate the activation energies and the preexponential factors at the interfaces of the Mg–{Ce, Nd, Zn} diffusion couples based on Eq. (5). The plots of
 $\log {\tilde D_0}$
against 1/T are presented in Figs. 10(a)–10(c).
 ${\rm{Log}}{\tilde D_0}$
against 1/T plots at the intermetallic interfaces of (a) Mg–Ce, (b) Mg–Nd, and (c) Mg–Zn diffusion layers.

These plots were used to estimate the activation energy and preexponential factor, for the growth of the Mg–Ce, Mg–Nd, and Mg–Zn diffusion layers at every interface, based on the data provided in Table IX and Arrhenius equation. The activation energy and preexponential factor of the growth of the Mg–Ce, Mg–Nd, and Mg–Zn layers are listed in Table X.
Activation energy and preexponential factor of the growth of the Mg–Ce, Mg–Nd, and Mg–Zn diffusion layers.

The compound formation and growth take place at the interface where two substances of dissimilar chemical natures react with one another. So, the growth rate depends on the chemical composition of the initial phases. The layer of the same intermetallic compound may grow at the interface between pure elements, between another compound and pure element, or between two other compounds. Reference Dybkov26 Hence, it is concluded that the compound itself does not diffuse and the interdiffusion coefficient, activation energy, and preexponential factor are characteristics of the diffusing atoms at certain location in the diffusion couple.
According to the results obtained from Table X, the activation energy values of the growth of the Mg–Zn intermetallics, obtained from this work, were comparable to those calculated by Sakakura and Sugino. Reference Sakakura and Sugino15 On the other hand, the preexponential factor of the same compounds is much lower, because of the difference in the interdiffusion coefficients values. The activation energy of the growth of the Mg–Nd compounds obtained from this work was lower than the values reported by Brennan et al. Reference Brennan, Bermudez, Sohn, Pool and Kainer13 This might be due to imposing a parabolic diffusion-controlled growth equation to calculate the interdiffusion coefficients of the corresponding phases without taking the diffusion reaction at the interfaces into account. Parabolic diffusion equations can only be used to examine whether the phases grow by a diffusion-controlled process, because the growth constant is calculated based on the total layer thickness. This may be correct for isomorphous systems but for systems that form intermediate compounds, such as the systems tackled in this article, Boltzmann–Matano method is more appropriate.
B. Zn–{Ce–Nd} binary systems
Many attempts were carried out to obtain successful Zn–{Ce, Nd} diffusion couples by the current authors. Formation of all expected diffusion layers while preventing Zn evaporation is a real challenge. In the following two systems, pure Zn disappeared from the contacting interface of the two end-members after annealing at 400 °C for 240 h. However, the diffusion reaction took place and all the expected compounds formed. It was observed that the diffusion reaction took place due to the migration of Zn atoms toward RE end-members. No diffusion reaction took place upon annealing at 300 °C for up to 504 h. Annealing at 300 °C for longer time might result in diffusion. However, this could lead to increasing the gap between the two end-members due to Zn volatility and Kirkendall effect. Reference Kirkendall27
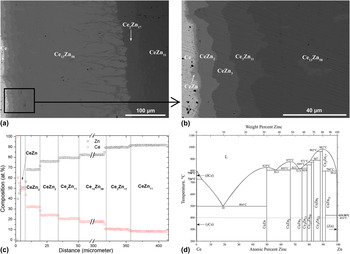
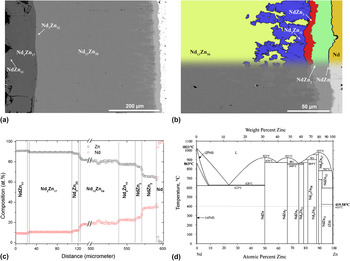
Backscattered electron image of Ce–Zn diffusion couple, annealed at 400 °C for 240 h, is shown in Fig. 11(a). Figure 11(b) represents the diffusion layers adjacent to Ce end-member. Seven diffusion layers, representing CeZn, CeZn2, CeZn3, Ce3Zn11, Ce13Zn58, Ce2Zn17, and CeZn11, were observed and determined using WDS spot analysis. Two sublayers were also observed at the Ce13Zn58/Ce2Zn17 interface. WDS line-scan was performed to measure the composition profile across the diffusion layers as shown in Fig. 11(c). For showing the composition of all the observed phases clearly, the data ranged from 60 to 300 µm, located in the very wide layer of Ce13Zn58, were cut from the graph. Two intermetallic compounds were not detected by the WDS line-scan, because they formed in sublayers with nonuniform interfaces. These compounds are: CeZn5 and Ce3Zn22, which are located between Ce13Zn58 and Ce2Zn17. However, these compounds were observed in other Ce–Zn diffusion couple annealed at 400 °C for 48 h, which means that they are stable at this temperature. The couple annealed at 400 °C for 48 h was not used for interdiffusion calculations, because the diffusion layers were very thin.
(a) and (b) backscattered electron images of Ce–Zn diffusion couples annealed at 400 °C for 240 h, (c) WDS composition profile, and (d) the Ce–Zn phase diagram Reference Dybkov30 with the annealing temperature marked as dashed line.

In a binary diffusion couple, the number of the intermetallic compounds in every diffusion layer cannot exceed one except at the interface. However, the diffusion layers of Ce13Zn58 and Ce2Zn17 show the growth of sublayers at the interface, as shown in Fig. 11(a). As a result, two intermetallic compounds, CeZn5 and Ce3Zn22, were presumed missing. It is highly probable that all the intermetallic compounds of the Ce–Zn system were formed in the diffusion couple, because of the presence of the Ce-rich CeZn and the Zn-rich Ce2Zn11 compounds in the sublayers. This was based on the fact that the layer-growth kinetics in a diffusion couple is sequential and not simultaneous. Reference Okamoto28 This means that the two far-end compound layers grow initially, at the interface with the pure elements, due to the participation of diffusing atoms of one of two components and surface atoms of the other component. Once these layers reach their maximum thickness, they are consumed partially to form the next layers. Reference Dybkov29 From the Ce–Zn diffusion couple annealed at 400 °C for 48 h, Fig. 12(a), it was noticed that the compounds CeZn5 and Ce3Zn22 were imbedded in the Ce13Zn58 and Ce2Zn17 diffusion layers, representing Ce13Zn58 + CeZn5 and Ce3Zn22 + Ce2Zn17 sublayers as shown in Fig. 12(b). In total, nine intermetallic compounds were found in this diffusion couple, which are equal to the number of the stable compounds at 400 °C of the Ce–Zn binary phase diagram Reference Dybkov30 shown in Fig. 11(d). Figure 12(c) shows the wavy growth of Ce, CeZn2, CeZn3, Ce3Zn11, and Ce13Zn58 diffusion layers. This is attributed to the anisotropic diffusion of Ce and Zn resulting in uneven growth of these layers as will be discussed in the Nd–Zn diffusion couple part of this work.
(a) Backscattered electron image of the Ce–Zn diffusion couple annealed at 400 °C for 48 h, (b) diffusion sublayer formation at the Ce13Zn5/Ce3Zn22 interface, and (c) anisotropic diffusion and irregular growth of the CeZn, CeZn2, CeZn3, Ce3Zn11, and Ce13Zn58 diffusion layers.

Thus, CeZn5 and Ce3Zn22 compounds might have been consumed upon the formation of Ce13Zn58 and Ce2Zn17 in the Ce–Zn diffusion couple annealed for 240 h. In addition, the fast formation kinetics of Ce13Zn58, which has obviously larger thickness (266.4 µm) than other layers, led to the consumption of the diffusing Zn atoms contributing further to the consumption of the CeZn5 and Ce3Zn22 compounds. Similarly, Loo and Rieck Reference van-Loo and Rieck31 and Wöhlert and Bormann Reference Wöhlert and Bormann32 reported the absence of phases other than TiAl3 in the Al–Ti diffusion couples. Wöhlert and Bormann Reference Wöhlert and Bormann32 made their diffusion couples using α2-Ti3Al and γ-TiAl sandwiched between Ti and Al layers. The results indicated that the phase absence in favor of Ti3Al was caused by different growth velocities due to different diffusion fluxes. The kinetics of layers consumption was tackled thoroughly by Dybkov. Reference Okamoto28,Reference Dybkov29
Backscattered electron image of Nd–Zn diffusion couple, annealed at 400 °C for 20 h, is shown in Fig. 13(a). Figure 13(b) represents an enlarged part near Nd end-member. Eight diffusion layers, representing NdZn, NdZn2, NdZn3, Nd3Zn11, Nd13Zn58, Nd3Zn22, Nd2Zn17, and NdZn11 intermetallic compounds, were observed and determined using WDS spot analysis. WDS line-scan was performed across these layers to measure the composition profile shown in Fig. 13(c).
(a) and (b) Backscattered electron images of Nd–Zn diffusion couples annealed at 400 °C and 240 h, (c) WDS composition profile, and (d) the Nd–Zn phase diagram Reference Okamoto33 with the annealing temperature marked as dashed line.

Although the diffusion layer of NdZn could be observed in the micrograph [Fig. 13(b)], it could not be detected in the composition profile because it is very thin. Similar to Fig. 11(c), the data ranged from 140 to 500 µm were cut from the graph for clarity. Based on the Nd–Zn phase diagram, Reference Okamoto33 shown in Fig. 13(d), all the expected stable phases at 400 °C were detected.
The composition profile in Fig. 13(c) shows that a few values deviated from the stoichiometric composition of Nd13Zn58 (18.3 at.% Nd and 81.6 at.% Zn) near the interface with Nd3Zn11. This can be explained from the backscattered electron image in Fig. 13(b), which shows a sublayer containing Mg13Zn58 dendrites extending in Nd3Zn11 layer. Therefore, the WDS line-scan provided the composition of Nd3Zn11 for some points and an average composition of the two phases for other points.
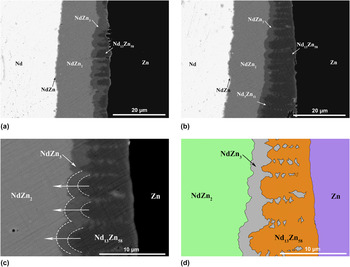
Initially, it was difficult to explain the existence of the sublayers near the Nd13Zn58/Nd3Zn11 interface without experimental proof. Also, the interfaces between the layers are wavy indicating an isotropic diffusion between Mg and Nd. The same applies to Mg and Ce diffusion. In this work, an explanation is provided based on extensive experimental studies of the Nd–Zn diffusion couple annealed at 300 °C for 576 h. The evolution of the diffusion process is discussed in Fig. 14. Backscattered electron images of this diffusion couple are shown in Figs. 14(a)–14(c). These micrographs were taken along the diffusion interface, where the diffusion process has just started at one location at the interface but progressed in another location. The contrast of these micrographs was modified to show details of the diffusion layers. The colored-schematic, shown in Fig. 14(d), was developed from Fig. 14(c) using image processing software to show the dendritic growth mechanism of Nd13Zn58.
Evolution of phase growth in the Nd–Zn diffusion couple annealed at 300 °C for 576 h. (a) Initial diffusion stage, (b) advanced diffusion stage, (c) dendritic growth representation, and (d) colored-schematic showing the dendritic growth of Nd13Zn58. Reader is encouraged to refer to the online version for colored image.

Figure 14(a) is an initial diffusion stage showing that the thickness of NdZn2 layer is the largest among other layers. At this stage, Nd13Zn58 dendrites were initially growing in the NdZn3 layer. According to the Nd–Zn phase diagram, Fig. 13(d), NdZn3 cannot be in equilibrium with Nd13Zn58. There must be an intermediate layer representing Nd3Zn11 compound, equilibrating with both NdZn3 and Nd13Zn58 compounds. Also, if the diffusion process is interrupted at this stage, a two-compound layer, NdZn3 + Nd13Zn58, can appear. Figure 14(b) shows an advanced diffusion stage, where Nd13Zn58 dendrites are continuously growing, displacing both interfaces, NdZn3/Nd13Zn58 and NdZn3/NdZn2, forward at the expense of NdZn2 layer. In other words, part of NdZn2 is consumed to form NdZn3 and part of NdZn3 is consumed to form Nd13Zn58. The consumption means that more Zn atoms are transferred within NdZn3 layer toward NdZn2. This was demonstrated with dotted arrows in Fig. 14(c). At the bottom of Fig. 14(b), Nd3Zn11 started to form, which means that Nd13Zn58 reached its maximum thickness. In Fig. 14(c), the NdZn2/NdZn3 interface seems not to be straight; dotted curves were drawn to show that the wavy interface was due to the growth of Nd13Zn58 dendrites. With the aid of Fig. 14(d), it is concluded that the Nd13Zn58 dendrites were growing longitudinally across the NdZn3 layer. The dendrites, then, became wider due to the side expansion resulted from the formation of secondary dendrites branched from the primary ones. The expansion continues with time, and the gaps between these branches, representing NdZn3, become smaller until they disappear. This explanation might give an approach to understand that the growth mechanism of every diffusion layer is unique.
The location of Boltzmann–Matano plane and the composition-dependent interdiffusion coefficients of the Zn–{Ce, Nd} intermetallics are listed in Table XI. Zn–{Ce, Nd} systems are considered among the difficult systems to be studied by diffusion couple experiments, because they contain large number of intermetallic compounds and the compositions of the Zn-rich compounds are very close to each other. In this work, two successful diffusion couples, i.e., Ce–Zn and Nd–Zn, were obtained and the diffusion data of the 15 observed compounds are provided. The interdiffusion coefficients of the components of the Ce–Zn system were not calculated at six metallic interfaces, because three phases, namely, CeZn5, Ce3Zn22, and Zn, were formed in the sublayers which were not parallel to the original interface. These compounds might be partially consumed during the diffusion process, as discussed earlier in the Zn–{Ce, Nd} diffusion couples section. These interfaces were marked with letter (a). Also, the experimentally observed interfaces, determined despite the missing compounds, were marked with bold font and letter (b), as indicated in Table XI. The same procedure was applied to the interfaces in the Nd–Zn diffusion couple. Although NdZn diffusion layer was discovered by WDS spot analysis to be very thin, the interdiffusion calculations were not performed at the corresponding interfaces for the accuracy.
Boltzmann–Matano plane locations and composition-dependent interdiffusion coefficients at the interface of the Zn–{Ce, Nd} diffusion layers.

a Indicates the missing interfaces based on the WDS composition profiles.
b Indicates the location of the experimentally available interfaces.
VI. SUMMARY
Diffusion couple experiments were used to measure the interdiffusion coefficients at the intermetallic interfaces of the Mg–{Ce, Nd, Zn} and Zn–{Ce, Nd} systems. Mg–{Ce, Nd} diffusion couples were annealed at 400, 450, and 490 °C for 120, 96, and 4 h, respectively. Mg–Zn diffusion couples were annealed at 250, 275, and 300 °C for 552, 408, and 504 h, respectively. Zn–{Ce, Nd} diffusion couples were annealed at 400 °C for 240 h. WDS line-scans were performed across diffusion layers of every diffusion couple to obtain the composition profiles. The obtained profiles were, then, analyzed using Boltzmann–Matano method to calculate the composition-dependent interdiffusion coefficients at every intermetallic interface. Arrhenius equation was also applied to calculate the activation energy and preexponential factor of the growth of the intermetallic compounds.
This work resolved the problem encountered in the literature of the missing phases in the Mg–{Ce, Nd, Zn} systems. The composition-dependent interdiffusion coefficient, activation energy and preexponential factor at the interfaces of the Mg–{Ce, Nd, Zn} intermetallic compounds were calculated.
Although Zn–{Ce, Nd} systems are considered to be among the difficult systems to be studied via diffusion couple experiments, two successful diffusion couples, annealed at 400 °C for 240 h, were obtained. The difficulty stems from the presence of large number of intermetallic compounds in a narrow range of composition. In addition, some of these compounds appeared as very thin layers. Nine intermetallic compounds were detected in the Ce–Zn diffusion couple and eight compounds were detected in the Nd–Zn diffusion couple. The diffusion couples were analyzed thoroughly and their results were discussed and supported using the established phase diagrams. Explanation of the evolution of phases in the Nd–Zn system and the anisotropic diffusion behavior, resulting in wavy interfaces, were provided. Sequential instead of spontaneous layer formation was observed and the layer consumption of Ce–Zn compounds was also discussed. The composition-dependent interdiffusion coefficients at the intermetallic interfaces of these systems are also provided in this work.
ACKNOWLEDGMENT
The authors would like to acknowledge National Sciences and Engineering Research Council (NSERC) for the financial support of the project through Magnesium Network (MagNET) for excellence. More information on the Network can be found at www.magnet.ubc.ca.