1 Introduction
The violent collapse of a bubble, when driven by unbalanced pressures outside and inside, is known for its dynamic properties, such as focusing mechanical energy to a collapsing centre and producing jets, shock waves and even light (Brujan et al. Reference Brujan, Nahen, Schmidt and Vogel2001; Didenko & Suslick Reference Didenko and Suslick2002; Lindau & Lauterborn Reference Lindau and Lauterborn2003; Flannigan & Suslick Reference Flannigan and Suslick2005; Shaw & Spelt Reference Shaw and Spelt2010; Supponen et al. Reference Supponen, Obreschkow, Tinguely, Kobel, Dorsaz and Farhat2016, etc.). Its nature has not yet been fully revealed. With such properties, bubbles can cause undesirable damage to material surfaces, for example hydraulic machinery (Huang et al. Reference Huang, Young, Wang and Shyy2013; Hsiao et al. Reference Hsiao, Jayaprakash, Kapahi, Choi and Chahine2014; Ji et al. Reference Ji, Luo, Arndt and Wu2014; Zhang et al. Reference Zhang, Zhang, Qian, Ji and Wu2016, etc.) and human tissues (Curtiss et al. Reference Curtiss, Leppinen, Wang and Blake2013; Goh et al. Reference Goh, Gong, Ohl and Khoo2017, etc.). Nevertheless, these effects are essential to ultrasound cleaning (Lamminen, Walker & Weavers Reference Lamminen, Walker and Weavers2004; Mason Reference Mason2016, etc.), extracorporeal lithotripsy (Ter Haar Reference Ter Haar2007; Jamaluddin et al. Reference Jamaluddin, Ball, Turangan and Leighton2011, etc.), sonoporation (Ohl et al. Reference Ohl, Arora, Ikink, de Jong, Versluis, Delius and Lohse2006; Helfield et al. Reference Helfield, Chen, Watkins and Villanueva2016, etc.) and many other chemical, medical and microfluidic applications (Stride & Saffari Reference Stride and Saffari2003; Dijkink & Ohl Reference Dijkink and Ohl2008; Stride & Coussios Reference Stride and Coussios2010; Krasovitski et al. Reference Krasovitski, Frenkel, Shoham and Kimmel2011; Xie et al. Reference Xie, Chindam, Nama, Yang, Lu, Zhao, Mai, Costanzo and Huang2015, etc.). They are even used by a predator shrimp to stun its prey (Versluis & Schmitz Reference Versluis, Schmitz, von der Heydt and Lohse2000; Lohse, Schmitz & Versluis Reference Lohse, Schmitz and Versluis2001). On a larger scale, the same effects are used by underwater explosion bubbles generated by weapons such as torpedoes to destroy ship structures (Cole Reference Cole1948; Klaseboer et al. Reference Klaseboer, Hung, Wang, Wang, Khoo, Boyce, Debono and Charlier2005; Lee, Klaseboer & Khoo Reference Lee, Klaseboer and Khoo2007; Brett & Yiannakopolous Reference Brett and Yiannakopolous2008; Hung & Hwangfu Reference Hung and Hwangfu2010). However, the understanding of the mechanism behind the damaging effect is still not complete and it has long been debated what factors are more important, especially the bubble jet and the shock wave emitted upon the bubble collapse. Bubble jets develop under pressure gradients in a liquid, such as that due to gravity or a nearby boundary (Benjamin & Ellis Reference Benjamin and Ellis1966; Lauterborn & Thomas Reference Lauterborn and Thomas2010; Obreschkow et al. Reference Obreschkow, Tinguely, Dorsaz, Kobel, De Bosset and Farhat2011; Blake, Leppinen & Wang Reference Blake, Leppinen and Wang2015; Supponen et al. Reference Supponen, Obreschkow, Tinguely, Kobel, Dorsaz and Farhat2016). Jets can reach a speed of hundreds of metres per second and thus the impingement of the jet on material surfaces is believed to be an important mechanism of damage (Vogel, Lauterborn & Timm Reference Vogel, Lauterborn and Timm1989; Philipp & Lauterborn Reference Philipp and Lauterborn1998; Brujan et al. Reference Brujan, Nahen, Schmidt and Vogel2001, Reference Brujan, Keen, Vogel and Blake2002). Shock waves also contribute to the bubble’s damaging potential, which is mainly caused by the rapid rebound of a bubble driven by its highly compressed contents subsequent to collapse (Shima et al. Reference Shima, Takayama, Tomita and Miura1981; Vogel et al. Reference Vogel, Lauterborn and Timm1989; Brujan et al. Reference Brujan, Keen, Vogel and Blake2002; Brujan, Ikeda & Matsumoto Reference Brujan, Ikeda and Matsumoto2005), and sometimes by impact of the jet with the liquid on the opposite side of a bubble’s boundary (Lindau & Lauterborn Reference Lindau and Lauterborn2003). Pressures of GPa were estimated for the shock from bubbles of millimetres in diameter (Philipp & Lauterborn Reference Philipp and Lauterborn1998; Chahine et al. Reference Chahine, Kapahi, Choi and Hsiao2016).
The cavitation-induced high pressure and the resultant material erosion and fracture are of particular interest due to their wide application. Studies of cavitation erosion revealed that damage pits are formed on material surfaces exposed to the collapse of a single cavitation bubble (Shutler & Mesler Reference Shutler and Mesler1965; Tomita & Shima Reference Tomita and Shima1986; Philipp & Lauterborn Reference Philipp and Lauterborn1998). The variation of the pit shapes from dots to rings with the standoff distance suggested that both the jets and the shock waves created during the bubble collapse were relevant to the damage. Detailed numerical simulations (Hsiao et al. Reference Hsiao, Jayaprakash, Kapahi, Choi and Chahine2014; Chahine et al. Reference Chahine, Kapahi, Choi and Hsiao2016) revealed that the main pressure loadings are due to the re-entrant jet impact and the collapse of the remaining bubble ring. Cavitation is also an important factor contributing to stone comminution in shock wave lithotripsy (Zhu et al. Reference Zhu, Cocks, Preminger and Zhong2002; Zhong Reference Zhong2013). The fracturing of the stones and other brittle materials is mainly attributed to the high local stresses induced by high intensity pressure waves and their interactions. Such pressure waves can be generated by the violent collapse of cavitation bubbles or the impact of the high-speed jet caused by non-spherical bubble collapse. The resultant shock wave generation and propagation may cause damage such as spalling in solids. Besides causing damage, cavitation bubbles can also trigger solidification. The nucleation of the solid phase in a super-cooled liquid can be initiated by different mechanisms (Chalmers Reference Chalmers1964) and one is by ultrasonic vibration (sonocrystallization) which is mediated by cavitation bubble collapse (Hunt & Jackson Reference Hunt and Jackson1966; Chow et al. Reference Chow, Blindt, Chivers and Povey2005; Ruecroft et al. Reference Ruecroft, Hipkiss, Ly, Maxted and Cains2005). For instance, it has been shown that homogenous nucleation can be induced by the strong compression due to the shock wave emitted by collapsing cavitation bubbles in super-cooled water (Lindinger et al. Reference Lindinger, Mettin, Chow and Lauterborn2007).
The damaging effect of bubbles can be used in various ways. It is intuitive to think of using such an effect to break the ice in frozen waterways, nevertheless, no such research or practice has been carried out to the best knowledge of the authors. Using bubbles for ice breaking has some inherent advantages such as avoiding the ramming of the icebreaker ship structures against the ice. The collapsing bubbles can be generated in various ways, for example, by electric discharges (Avila, Song & Ohl Reference Avila, Song and Ohl2015; Zhang et al. Reference Zhang, Cui, Cui and Wang2015), lasers (Han et al. Reference Han, Köhler, Jungnickel, Mettin, Lauterborn and Vogel2015; Avila & Ohl Reference Avila and Ohl2016), underwater explosions (Klaseboer et al. Reference Klaseboer, Hung, Wang, Wang, Khoo, Boyce, Debono and Charlier2005; Hung & Hwangfu Reference Hung and Hwangfu2010) and seismic air guns (Johnson Reference Johnson1994). Among them, the high-energy electric discharge (Buogo & Vokurka Reference Buogo and Vokurka2010) and the air guns can produce large-scale bubbles and pressure waves during the bubble collapse (Ziolkowski Reference Ziolkowski1970; de Graaf, Brandner & Penesis Reference de Graaf, Brandner and Penesis2014) without generating hazardous products such as that from the detonation of an explosive charge. Hence, they might be more suitable for ice breaking, especially in polar explorations in the future.
Given the varying bubble behaviour and the unique mechanical properties of the ice, the process of bubble-induced ice breaking can be complex and demands a closer look. The bubble jet and the shock wave have different damaging effects, but the total energy of the bubble is limited. Therefore, it is important to find out which is more effective in ice breaking to maximize the damage. In this paper, the process of ice breaking subject to bubble collapse is investigated experimentally. The damaging effect of both the jet and the shock wave to the ice are visualized and analysed. The thickness of the ice and the bubble–ice distance are varied, and their effects on the bubble behaviour, including the bubble shape, the jet formation and the shock wave emission, etc. are considered. On this basis, the different patterns of the ice fracturing are summarized and the underlying physics is discussed.
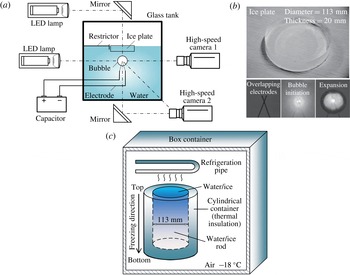
Experiment set-up. (a) Experiment set-up in side view. The bubble was generated below a piece of a circular ice plate with different standoff distances. The ice plate can be floating with a restrictor limiting its horizontal motion (shown here) or fixed rigidly with clutches (not shown). Images were captured with two high-speed cameras from three different viewing angles (side, bottom and oblique), with illumination from LED lamps. (b) Pictures of an ice plate sample (top) and the overlapping electrodes, the initiation and the expansion of a bubble (bottom). (c) The making of an ice rod from which an ice plate was cut.

2 Experiment set-up
The experimental set-up is shown in figure 1(a). Experiments were carried out in a cubic glass water tank of 0.3 m in length. A piece of ice plate was placed at the centre of the water surface and interacted with a bubble generated below. The ice plate is circular with a diameter of 113 mm and its thickness varies from 10 to 46 mm. An example is shown in figure 1(b). The ice plate was prepared using a topless cylindrical container with a 113 mm inner diameter made of thermal insulation materials. The cylindrical container was filled with water degassed by repeated boiling and placed beneath a refrigeration device in a box container. The air temperature in the box container was maintained at
 $-18^{\circ }$
. The set-up is shown in figure 1(c). The freezing process of the water was gradual and directed from the top to the bottom due to the thermal insulation at the lateral and the bottom parts of the cylindrical container. Eventually, a cylindrical ice rod was obtained after 36 h. As a result of the freezing process, its top part is free of entrapped air bubbles. Then the ice plates used in this experiment were cut from the top of the rods. The top-to-bottom freezing process also mimics the natural freezing process of river and ocean ice. The ice used here is randomly oriented poly crystals with the crystal structure type
 $I_{h}$
, which is the common terrestrial form. The typical values of Young’s modulus and Poisson’s ratio of ice are 9.0 MPa and 0.33 at
 $-5^{\circ }$
(Hobbs Reference Hobbs1974). The tensile strength of ice is independent of the strain rate, slightly dependent on the temperature and decreases with increasing grain size and brine inclusion (Schulson, Lim & Lee Reference Schulson, Lim and Lee1984). In this work we set out to explore possible ways of using collapsing bubbles to cause ice breaking with the most common type of ice. The results can be useful reference for future works that extend to different ice properties and types. The water temperature in the tank was lowered to near the freezing point to slow down thawing during the experiment. Two methods were used to hold the ice plate in position. One was using a restrictor limiting the horizontal motion to keep the ice from drifting away, while the ice floats on the water surface and is moveable in the vertical direction if driven by the bubble. The other way was fixing the circumference of the ice plate rigidly by clutches mounted on the wall of the water tank. The fixed ice plate was held at the same depth in the water as the floating one. The results from the two set-ups were compared.
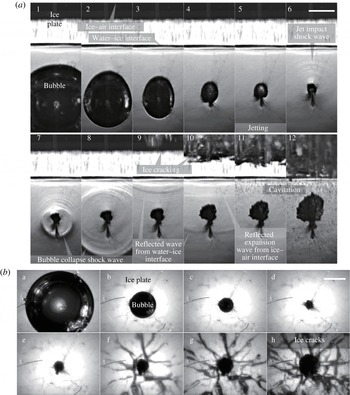
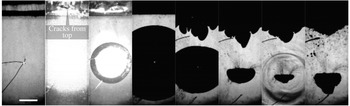
High-speed images of a bubble collapsing under a 20 mm-thick ice plate in time sequence with
 $\unicode[STIX]{x1D6FE}=1.43$
, in both side view (a) and bottom view (b). Scale bars, 10 mm. Ice plate free floating. The bubble develops a jet towards the ice while contracting but neither the bubble nor the jet makes contact with the ice plate before it breaks. Shock waves are visualized in the side view. The shock waves include those induced by the jet impact on the opposite bubble wall and the collapse and rebound of the bubble, as well as the reflections from both the water–ice and the ice–air interfaces. Cracks in the ice develop from the top following the reflected waves.

Bubbles were generated by underwater electric discharges. The discharging device is improved from that of Khoo (Turangan et al.
Reference Turangan, Ong, Klaseboer and Khoo2006). The power supply is a 400
 $\unicode[STIX]{x03BC}$
F capacitor charged to 600 V (unless otherwise specified). The positive and the negative electrodes are copper wires, 0.20 mm in diameter, and overlap with each other as a cross. Upon discharge, water is heated up around the overlapping point in a very short period of time, whereby a gaseous bubble initiates and rapidly expands, as shown in figure 1(b). The bubble begins to collapse as it reaches the maximum expansion, followed by a jet and shock waves that inflict damage on the ice plate. The melting and burning of the copper electrodes during the discharge produce some remnant particles suspended in the water. When the bubble collapses, these small particles follow the motion of the bubble wall and become part of the wakes (for example below the bubble in figure 2). These remnants may have weakened the jet when it penetrates through the bubble, and have a negative effect on its damaging potential. Nevertheless, only a small segment (less than 1.0 mm) of the electrode near the overlapping point was ‘consumed’ during the discharge and the total mass of the remnants are small. Also, the particle sizes were small (a few of the largest were up to approximately 0.1 mm but most are undistinguishable) compared to the bubble diameter (approximately 36 mm with 600 V discharge). Therefore, their effects on the bubble and the jet motion may be limited.
The maximum bubble radius,
 $R_{m}$
, is determined by the average of the maximum radii measured in over 100 experiments with the same discharge voltage. For 600 V,
 $R_{m}$
is calculated as 18.0 mm with a standard deviation of 0.54 mm. The overlapping point of the electrodes is under the centre of the ice plate and taken as the initial centre of the bubble. A non-dimensional standoff distance is defined as the distance from the initial bubble centre to the lower surface of the ice,
 $d$
, scaled to the maximum bubble radius
 $R_{m}$
as
 $$\begin{eqnarray}\displaystyle & \displaystyle \unicode[STIX]{x1D6FE}=d/R_{m}, & \displaystyle\end{eqnarray}$$
on which the bubble behaviour is highly dependent.
The ice breaking process was captured by 2 high-speed cameras (Vision Research Phantom V711 and Phantom V12.1) shooting from different viewing angles, as demonstrated in figure 1(a). Camera 1 provides a side view showing the bubble migration, the shock waves and the ice cracking in the vertical direction; camera 2 provides a bottom view showing the bubble jet, the ring-shaped bubble and the ice cracking in the horizontal direction. Two sets of LED lamps were used as backlight and placed opposite to the camera lens to produces shadowgraphs. The shock waves can be visualized as they cause changes to the water density that deflect the backlight. To improve the contrast of the shock wave images, the beams of the backlight were adjusted as parallel. This has, however, prevented a clear visualization of the bubble’s interior, because the parallel light was deflected by the curved bubble surface. To compensate for this, an oblique view was provided with camera 2 whereby the interior of the bubble was clearly photographed with diffusive illumination from the bubble’s lateral side. In the shadowgraphs, the exposure time is
 $0.5~\unicode[STIX]{x03BC}\text{s}$
which ensures the shock wave fronts are sharp in the images captured. The spatial resolution of the images in side view is up to 5.0 pixels per millimetre and 6.8 in the bottom view. In the following sections, representative results are shown in figures 2–9 with images displayed in time sequence to demonstrate the bubble dynamics and the fracture propagation in the ice.
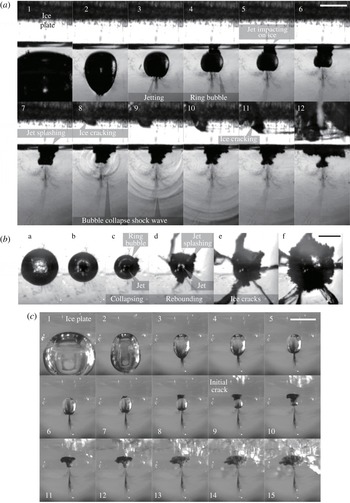
High-speed image series of a bubble collapsing under a 20 mm-thick ice plate with
 $\unicode[STIX]{x1D6FE}=1.06$
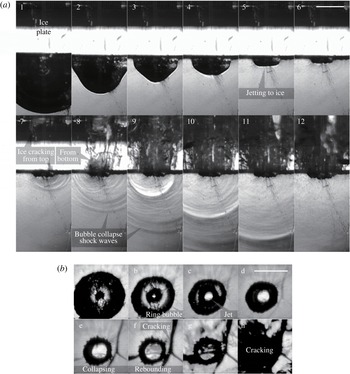
, in (a) side view, (b) bottom view and (c) oblique view. Scale bars, 10 mm. Ice plate free floating. A jet is shown in the three views to form from the bubble’s bottom and pierce through the bubble. The bubble becomes a ring and the jet impacts the ice surface. No damage is observed on the spot of the jet impact. The bubble then reaches the minimum volume between frames 7–8, c–d and 10–11 in panels (a), (b) and (c), respectively. Shock waves are visualized in (a). Small and large cracks appear after the jet impact and the shock wave incidence, respectively, all developing from the top of the ice plate.

High-speed images in time sequence of a bubble collapsing under a 20 mm-thick ice plate with
 $\unicode[STIX]{x1D6FE}=0.47$
, in (a) side view, (b) bottom view and (c) oblique view. Scale bars, 10 mm. Ice plate free floating. A jet forms from the bubble bottom. It directly impacts on the ice plate and deflects. Small cracks in the ice initiate shortly thereafter. The bubble collapses to its minimum volume around frames 6, g and 15 in (a), (b) and (c), respectively. Large cracks appear after the shock wave incidence. All cracks develop from the top of the ice plate.

High-speed image series of a bubble collapsing under an ice plate with
 $\unicode[STIX]{x1D6FE}=0.31$
, in both side view (a) and bottom view (b). Scale bars, 10 mm. Ice plate free floating. A jet forms from the bubble bottom at a late stage of the collapse. It impacts the ice very shortly before the bubble reaches the minimum volume. Cracks initiate from the top of the ice plate around the last stage of the collapse. The shock wave incidence directly causes fracturing from the bottom of the ice plate.

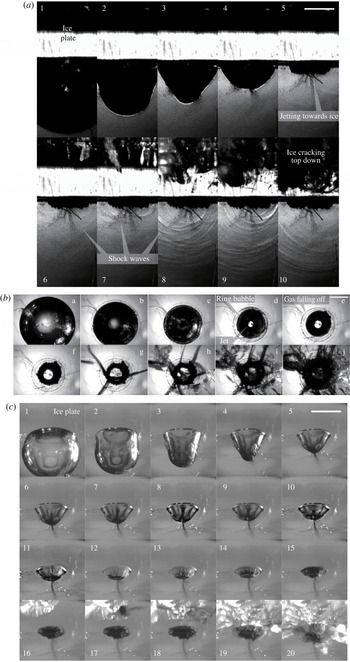
High-speed image series of a bubble collapsing under a 20 mm-thick ice plate with
 $\unicode[STIX]{x1D6FE}=0.07$
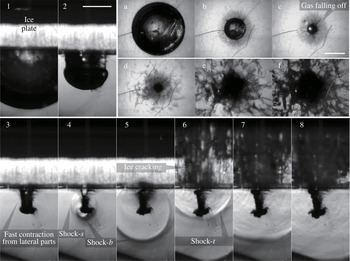
, in both side view (1–8) and bottom view (a–f). Scale bars, 10 mm. Ice plate free floating. The lateral boundaries of the bubble move faster during the collapse and the bubble splits. A shock wave (shock-
 $s$
) is emitted with the split. After the split, the bottom and the top parts of the bubble collapse to the minimum volumes with shock wave emissions (shock-
 $b$
and shock-
 $t$
), respectively.

3 Results
3.1 Ice breaking with large bubble–ice distances
In this section, the bubble is initiated at a distance such that no contact occurs between the ice plate and the bubble during the first bubble collapse. In figure 2, a bubble is initiated at
 $\unicode[STIX]{x1D6FE}=1.43$
below a floating ice plate. The bubble is elongated in the vertical direction during the collapse and this will be discussed later in § 3.5. The bubble top is attracted to the ice while the bottom part contracts faster and turns into a jet. An initial shock wave is released when the jet impacts on the upper boundary of the bubble. This shock wave is shown in frame 6 and followed by a series of stronger shock waves in frames 7–8 that are emitted from the collapse of the bubble. The wave fronts appear as circles in the shadowgraphs. They are slightly non-concentric because they are emitted from a bubble ring formed after the jet penetration rather than a spherical bubble. Nevertheless, the emissions at the different parts of the ring are almost simultaneous. Two succeeding reflected waves appear after the shock wave incidence as in frames 9–10, figure 2. The first reflection is from the water–ice surface (the lower surface of the ice plate) and the second from the ice–air interface (the upper surface of the ice plate). They should be compression waves and expansion waves, respectively, given the properties of the reflecting interfaces. This is supported by the cavitation that appears after the second wave which indicates tension in the water. Subsequently, the ice breaks in frames 9–12. Interestingly, cracks only emerge after the reflection waves and develop from the top of the ice plate to the bottom. The development follows the same direction with the reflection waves. Since ice is much more vulnerable to tension than compression, this indicates that the cracks are caused by the tension due to the reflection of the shock waves at the ice–air interface.
The breaking up of the ice is also displayed in the bottom view (frames f–h) showing that the cracks radiate from the centre of the ice plate. This is also in alignment with the propagation of the reflection waves which are spherical. In this process, neither the bubble nor the jet make contact with the ice. Thus, the shock waves, or more precisely the reflected expansion waves, should be the predominant cause of ice breaking.
3.2 Ice breaking with medium ice–bubble distances
With the medium bubble–ice distance, a jet forms during the bubble collapse and impacts on the floating ice plate before the bubble reaches the minimum volume. Figure 3 shows another case with
 $\unicode[STIX]{x1D6FE}=1.06$
where only a small gap is left between the bubble and the ice plate before the jet forms. The jet penetrates the gap, impinges on the ice and is then deflected along the ice surface, as shown in frames 5–7 in figure 3(a), frame d in (b) and frames 7–8 in (c). However, the ice is not fractured immediately. Subsequently, the bubble (in a ring shape after the jet penetration) reaches a minimum volume and emits a series of shock waves from different parts of the ring in a rapid succession in frames 8–10 in (a).
Small cracks appear shortly after the jet tip reaches the ice plate, see frame 8 in (a) and frames 9–10 in (c). They further develop into larger cracks after the shock wave emission, see frames 9–12 in (a), d–f in (b) and 11–15 in (c). All visible cracks develop downwards from the top of the ice plate. The large cracks, as previously explained, should be attributed to the tension caused by the expansion wave formed by reflection of the shock waves at the ice–air interface. However, the small cracks appear before the bubble collapses to the minimum volume, hence they are possibly caused by the tension due to the reflection of pressure waves generated by the impact between the jet and the water or the ice, or caused by the hogging moment due to the jet impact. In addition, no fractures are observed at the centre of the ice plate’s bottom where the jet impacts, see frames 5–7 in (a) and 8–11 in (c).
3.3 Ice breaking with small ice–bubble distances
In this section, the bubbles are initiated close to the floating ice plates, and make contact with the ice before the collapse. In the experiment, shown in figure 4,
 $\unicode[STIX]{x1D6FE}$
is reduced to 0.47. The bubble expands over the ice surface and clings to it during the collapse phase that follows. Here the jet directly impacts on the ice plate without any cushioning since the liquid between the bubble and the ice has been squeezed away before the maximum bubble expansion. In frames d–g the ring bubble that forms after the jetting is shown. The jet, when impacting with the ice, appears as the opening in the centre of the bubble. The process of the jet penetrating through the bubble and impacting onto the ice can be seen clearly in figure 4(c), frames 6–10. After the impact, the jet liquid deflects and expands along the ice surface, and corrupts the ring bubble’s surface, see frames 11–15. Nevertheless, no fracture on the ice surface is observed where the impact occurred. The fractures only appear later from the other side of the ice plate. Subsequently, the ring bubble collapses and a series of shock waves are released, as visualized in frames 7–9, figure 4(a). The shock wave emissions are not simultaneous because different parts of the ring bubble reach the minimum volume with slight time differences which may be due to the irrigation caused by the deflected jet liquid.
As shown in figure 4(a), small cracks first develop from the upper side of the ice plate (frame 6). As explained before, this should be a result of tension caused by the reflection of pressure waves at the ice–air interface or by the hogging moment applied to the ice plate by the jet impact. Possible sources of the pressure waves include the impact between the jet and the ice as well as the collapse of a part of the ring bubble that occurs earlier than the other parts. Later, stronger shock waves are released from the collapse of the ring bubble (frame 7 in a) and the fracturing is extended (frames h–j, b and 16–20, c).
With a further reduced standoff distance,
 $\unicode[STIX]{x1D6FE}=0.31$
, figure 5 shows another experimental case with similar bubble behaviour but different characteristics of ice fracturing. Again, cracks are observed to form from the top of the ice plate and then expand, which can be attributed to the expansion waves formed by the reflection of the shock waves at the upper ice surface. The difference is, however, that fractures also appear at the bottom of the ice plate right after the incidence of the shock waves, as in frames 7–8. This indicates that the shock waves are able to directly crack the ice without turning into expansion waves, presumably due to their high strength. As a result, fractures grow from a point adjacent to the collapsed bubble (frame 8 and onwards), joining those developing from the top, and cause damage through the whole section of the ice plate. This enhanced damage effect can be attributed to the bubble collapse which is more violent than in the previous case. With a smaller
 $\unicode[STIX]{x1D6FE}$
, the jet formation is delayed. The splashing of the jet liquid and its interruption of the collapsing bubble is lessened. Therefore, the bubble can reach a higher collapse speed and compression to initiate stronger shock waves.
The jet impacts the ice and appears as the opening at the centre of the torus (frame b, figure 5). The impact will result in pressure wave generation and propagation (Philipp & Lauterborn Reference Philipp and Lauterborn1998) inside the ice, however, fractures are again not present at the impact site. The small cracks that appeared before the bubble rebounds (frames 7 and e) may be attributed to the reflection of this pressure wave. This is similar to the cases where
 $\unicode[STIX]{x1D6FE}=1.06$
and 0.47.
A more interesting scenario of bubble behaviour is shown with
 $\unicode[STIX]{x1D6FE}=0.07$
in figure 6. Near the end of the collapse, the bubble’s bottom part tends to split off from the main part instead of developing into a re-entrant jet as a result of the faster contraction on the bubble’s lateral parts, see frames 2–4. Repeated tests show that the split only occurs with the floating ice plates (figure 6) rather than the fixed ones (a comparison is shown in figure 8
b). The ice plate is moving towards the bubble centre before the bubble splits. It directs the horizontal fluid motion near the top of the bubble vertically downward, which causes the bottom of the bubble to pinch off. Besides, the images in frames b–c, figure 6 as well as frame d–e, figure 4(b) suggest that gas is detaching from the bubble as it contracts, probably due to friction, and this may contribute to the split as well. The liquid collides where the split occurs, releasing a shock wave (denoted by shock-
 $s$
, see frame 4).
Subsequently, the bottom part and the top part of the bubble collapse separately, each emitting a shock wave (marked as shock-
 $b$
and shock-
 $t$
and shown in frames 4–6, respectively). The shock wave from the bottom part may induce a jet towards the ice plate at the top part of the bubble. The jet impact may have contributed to the fracturing of the ice in frames 5–6. The stress caused by the shock wave incidence at the bottom of the ice plate is another likely reason for the fracturing. Also, the shock waves reflect into expansion waves and may cause ice fracturing by tension. Such fracturing initiates from the top, and is shown in the images with a higher frame rate in figure 8(a) (the first row). The combination of these effects causes severe damage throughout the ice plate.
High-speed images of the crack development in the ice plates with thicknesses of 20 mm and 28 mm (i.e. the dimensionless thickness
 $k$
being 1.11 and 1.56, respectively).
 $\unicode[STIX]{x1D6FE}=1.06$
in both cases. Scale bar, 10 mm. Ice plate free floating. For the 20 mm plate, the initial cracks develop from the side opposite to the jet impact before the bubble reaches the minimum volume. For the 28 mm, such cracks are not observed. Larger fractures are induced after the bubble rebound in both cases.

3.4 Ice breaking with different thicknesses
In the above experiments, ice plates with a thickness of 20 mm were used to demonstrate the bubble behaviour and the ice fracturing. In the following sections, the thickness of the ice plate is varied to extend the observations. Here, we define the dimensionless ice thickness as
 $$\begin{eqnarray}\displaystyle & \displaystyle k=T/R_{m}, & \displaystyle\end{eqnarray}$$
where
 $T$
is the thickness of the ice plate and
 $R_{m}$
is the maximum bubble radius. In this section,
 $k$
is from 0.56 to 2.56 (i.e. the thickness is from 10 mm to 46 mm). Some representative results are shown in figures 7–9. The larger thickness increases the distance the shock waves propagate in the ice, therefore the tension caused by the reflected waves would be lower and less effective in fracturing the ice. A comparison is shown in figure 7. With
 $k=1.11$
, small cracks are observed at the top of the ice plate after the jet impacts on the ice, before the bubble collapses to the minimum volume. They are possibly induced by the reflection of the pressure waves from the impact (as is discussed in § 3.2), and they are no longer observed when the thickness is increased to
 $k=1.56$
and higher. Similarly, when the ice thickness further increases, it is hard to induce fractures at the top of the ice plate, even for the shock waves emitted by the bubble collapse. For example, for the ice plate with
 $k=1.89$
, fractures from the ice–air interface are absent within
 $\unicode[STIX]{x1D6FE}\approx 0.7{-}1.1$
. In this range, the bubble shape is affected by the jet and highly non-spherical when collapsing to the minimum volume. Therefore the shock wave emissions are not as concentrated. This, and the relatively longer travelling distance in the ice, weaken the wave strength, thus the reflected waves fail to cause ice fracture.
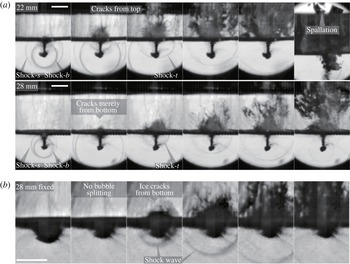
High-speed images of the bubble collapse and the fracturing of the ice plates. (a) Floating ice plates with different thicknesses (22 and 28 mm,
 $k=1.22$
and 1.56, respectively). Shock-
 $s$
, -
 $t$
and -
 $b$
denote the shock waves emitted during the bubble split, the collapse of the top part and the collapse of the bottom part of the bubble, respectively. (b) Fixed ice plate, 28 mm in thickness, shock wave emitted only at the end of the bubble collapse. Scale bars, 10 mm.

Another change in the fracturing due to the variation in the thickness is shown in figure 8(a). As mentioned before, a bubble with a very small standoff distance (
 $\unicode[STIX]{x1D6FE}<0.2$
, approximately) to the floating ice plate will split in the last stage of the collapse. Shock waves are emitted by the split and the subsequent collapses of the top and the bottom parts of the bubble (denoted as shock-
 $s$
, shock-
 $t$
and shock-
 $b$
, respectively). These shock waves are shown in figure 8(a), where they act upon two ice plates of different thicknesses. For the thinner ice plate, some of the cracks initiate from the top of the ice plate, which is possibly caused by the reflection of the earlier-emitted shock-
 $s$
, see the third frame in the first row. Spallation is observed (the last frame) at the ice–air interface, where ice fragments are ejected from the ice plate as a result of tension. However, for the thicker ice plate, the cracks initiate and expand merely from the bottom, because the shock wave decayed while travelling through the thicker ice and its reflection fails to fracture the ice from the top. In contrast, when the ice plate is fixed, the splitting and the multiple shock waves will no longer occur. An example with a fixed 28 mm-thick ice plate is given in figure 8(b), where the bubble collapses to a minimum volume without splitting and shock waves are only emitted by the final collapse.
When the thickness is further reduced, the ice plate fractures when subjected to the bubble expansion. An example is shown in figure 9, where the ice plate thickness is only 10 mm (
 $k=0.56$
). The rapid bubble expansion applies a hogging moment on the ice plate, and fractures are seen traversing the ice plate from the top to the bottom. The bubble subsequently collapses and migrates downward instead of being attracted towards the ice plate. This is similar to the bubble collapsing under a free surface, because the broken ice plate no longer acts as a solid wall for the bubble. Experiments showed that fracturing during the bubble expansion generally occurs with
 $\unicode[STIX]{x1D6FE}<1.5$
for
 $k=0.56$
. In addition, results showed that the patterns of the ice fracturing are essentially the same between the floating and the fixed ice plates. For example, compared to a floating ice plate (
 $k=1.22$
), the fracturing of a fixed ice plate with the same
 $k$
also develops from the top for large and medium
 $\unicode[STIX]{x1D6FE}$
, and from the bottom upon shock wave incidence for sufficiently small
 $\unicode[STIX]{x1D6FE}$
. One exception is that the fracturing induced by the shock waves from a splitting bubble is not repeated, because the split is only observed with a movable boundary in the experiment.
High-speed image series of the bubble behaviour and the fracturing of a free floating 10 mm-thick ice plate (
 $k=0.56$
) with
 $\unicode[STIX]{x1D6FE}=1.44$
. Scale bar, 10 mm. The ice fractures when subjected to the expansion of the bubble.

3.5 Bubble characteristics and ice plate motion
In this section, bubble characteristics such as the jet speed, the bubble shape and the motion of the ice plate are analysed. Floating and fixed ice plates with various thicknesses (16–46 mm) are considered. The floating ice plate is driven by the bubble and heaves in the vertical direction, which in turn affects the bubble behaviour. Figure 10(a) depicts the time curves of the dimensionless heave motion, from bubble inception to the impact between the jet and the ice plate. The ice plate rises and falls with the expansion and collapse of the bubble. The bubble top is attracted towards the ice plate and its downward motion is reduced during the collapse. The maximum heaving displacement decreases with the thickness of the ice plate. The heaving is no more than 10 % of the maximum bubble radius, but there are obvious changes in the bubble shape and the jet speed compared to those with fixed ice plates.
(a) Time curves of the vertical displacements of the floating ice plates with different thicknesses. For reference, the displacements of the top and the bottom of a bubble under a 22 mm-thick ice plate are also plotted. All displacements are scaled to the maximum bubble radius.
 $\unicode[STIX]{x1D6FE}=0.96$
. (b) The time curves of the bubble elongation with different ice plates.
 $\unicode[STIX]{x1D6FE}=1.36$
. The elongation is defined as the ratio of the vertical span of a bubble to the horizontal span. It increases as the bubble collapses but drops after the jet forms.
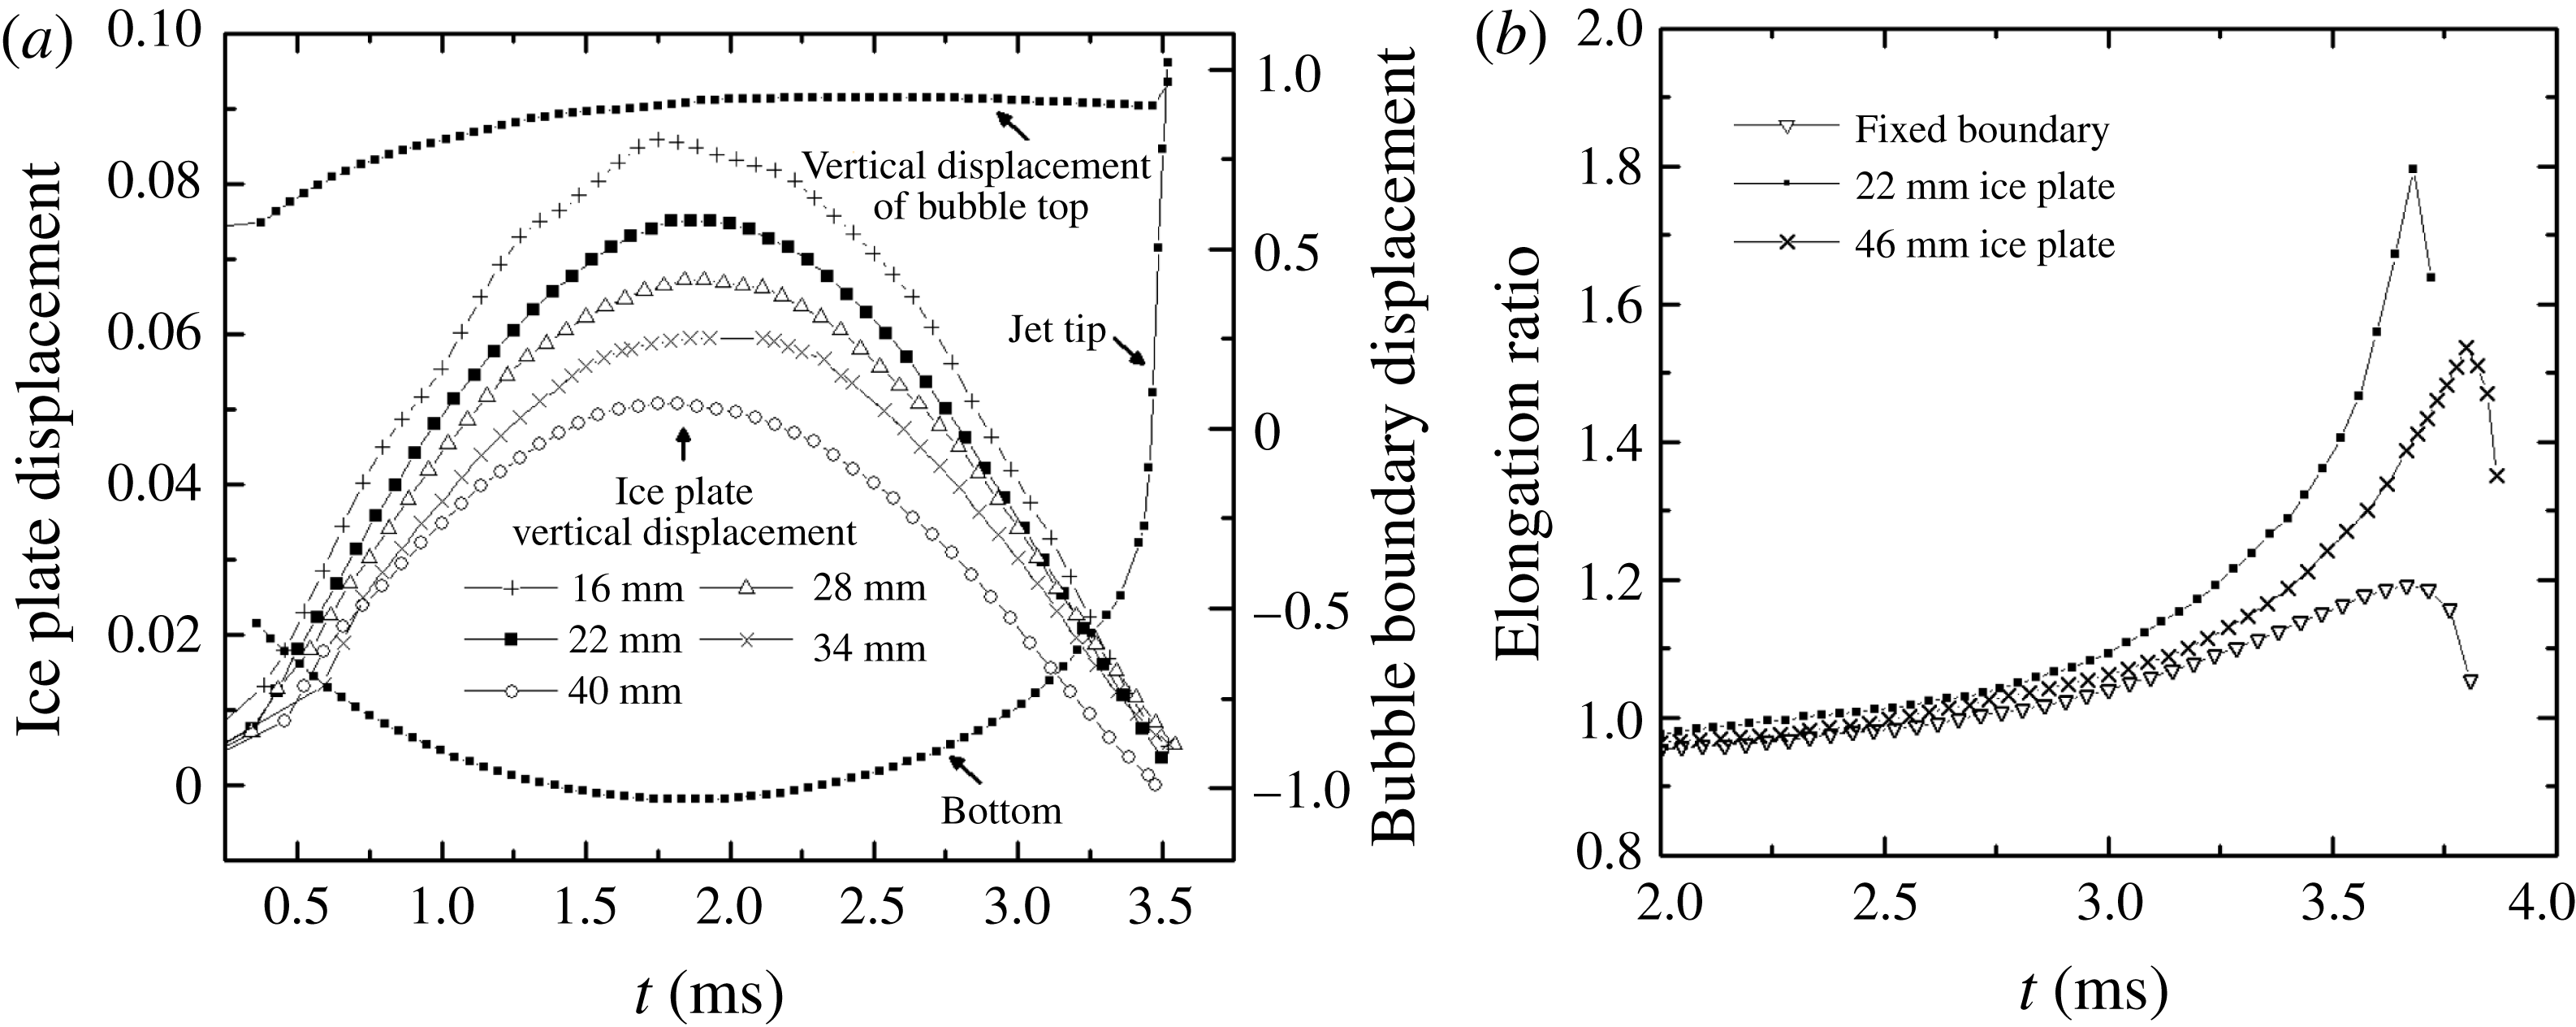
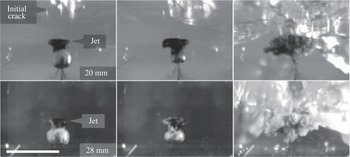
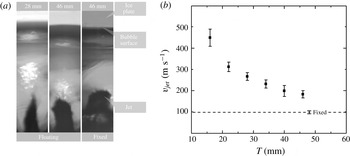
The bubble is elongated in the vertical direction during the collapse, see figures 2 and 3 for example. Here, the elongation is defined as the ratio between the vertical and the horizontal lengths of the bubble. The lateral boundaries of the bubble contract faster than the bottom, and the elongation continues to increase, until the jet forms at the bottom. Some examples of the elongation time curves are plotted in figure 10(b). The maximum elongation is larger when the ice plate is floating rather than fixed. It also increases with reduced ice plate thickness. The reason for the difference in the elongation may include the following. With a smaller thickness, the plate will be pushed further during bubble expansion and the bubble top will extend further. The plate is pulled back during the collapse and the counter-effect elongates the bubble top. The contraction of the bubble’s lateral boundaries is less hindered by the ice plate with a smaller thickness. All these contribute to the elongation. The maximum speed of the bubble jet also increases with smaller ice thickness. The maximum jet speed during the jet progression inside the bubble were measured at the jet tip and plotted in figure 11(b) with
 $\unicode[STIX]{x1D6FE}=0.93$
. The maximum jet speed is the lowest when the ice plate is fixed (approximately
 $100~\text{m}~\text{s}^{-1}$
). Nevertheless, the speed is larger when the ice plate is floating, increasing drastically to around
 $300~\text{m}~\text{s}^{-1}$
for the 22 mm-thick ice plate and almost
 $450~\text{m}~\text{s}^{-1}$
for the 16 mm-thick ice plate. A possible explanation is as follows. The contraction from the bubble’s lateral part is greater when the ice plate is thinner and easier to heave. As a result, the bubble’s bottom becomes slimmer and so does the re-entrant jet (the jet widths are compared in figure 11
a). As pointed out in previous numerical studies (Brujan et al.
Reference Brujan, Keen, Vogel and Blake2002; Zhang, Li & Cui Reference Zhang, Li and Cui2015; Koukouvinis et al.
Reference Koukouvinis, Gavaises, Supponen and Farhat2016)), the jet is driven by the high pressure in the water near the far end of the bubble that is collapsing near a solid wall. Therefore, the slimmer jet gains a higher speed.
(a) Magnified images of the high-speed jets with different widths piercing through the bubble,
 $\unicode[STIX]{x1D6FE}=0.93$
. Frame width, 2.88 mm. The ice plate thicknesses and conditions are marked. (b) The maximum jet speed
 $v_{jet}$
as a function of the thickness
 $T$
of the floating ice plate, measured at the tip of the jet during its penetration through the bubble.
 $\unicode[STIX]{x1D6FE}=0.93$
. Each filled box and error bar represent the average value and the standard deviation, respectively, of 30 measurements. The dash line represents the maximum jet speed with a fixed ice plate.

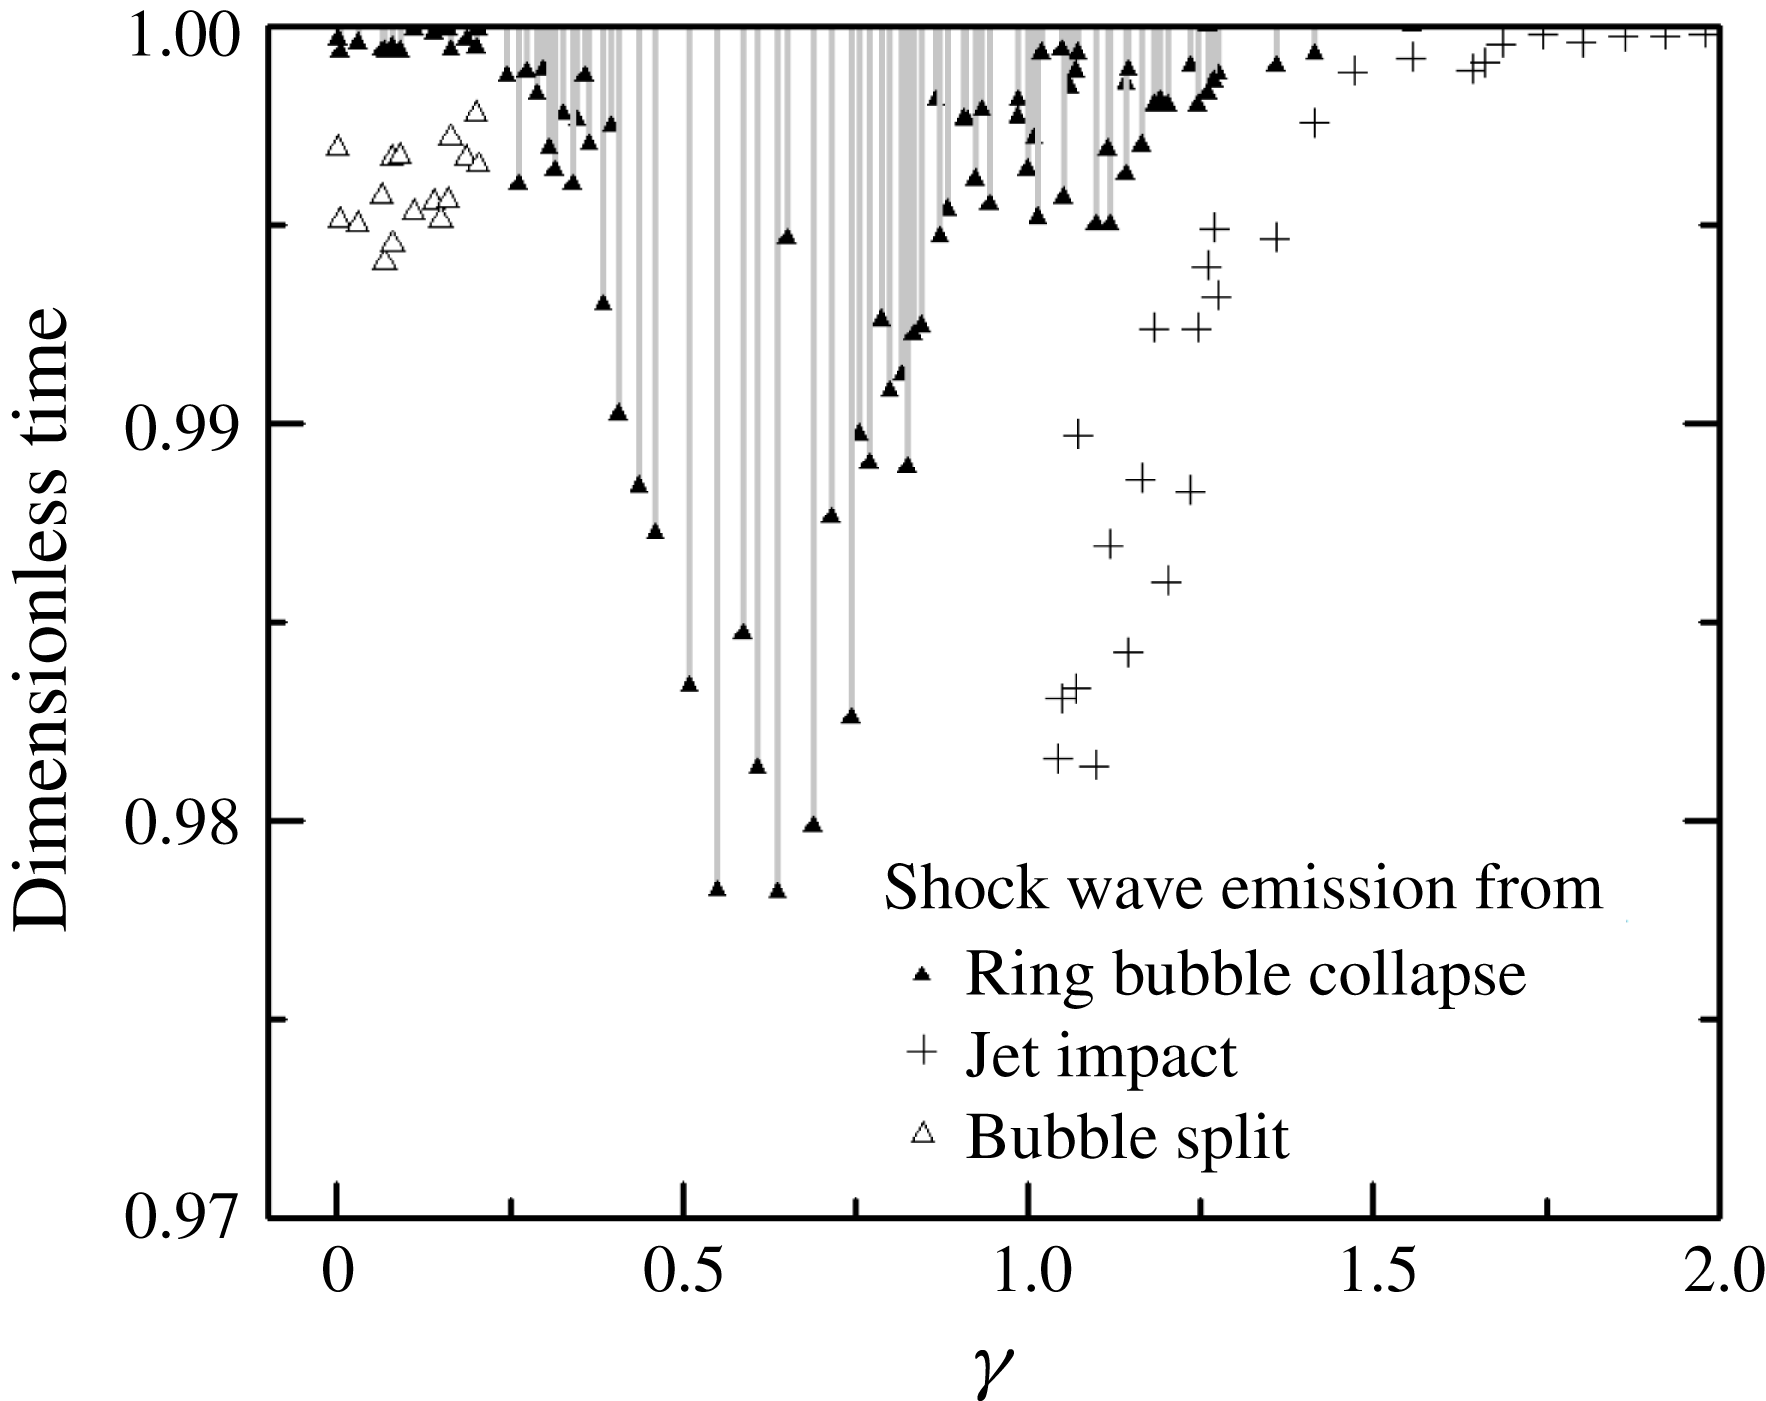
In this experiment, shock waves are emitted at different stages during the collapse of the bubble. The time of the shock wave emission is plotted as a function of the dimensionless standoff distance
 $\unicode[STIX]{x1D6FE}$
in figure 12. All emissions occur within the last 3 % of the first oscillation cycle of the bubble. First, shock waves are emitted by the impact between the jet and the opposite bubble wall (see figure 2
a, for example). The impact/emission time (denoted by
 $+$
) is advanced as
 $\unicode[STIX]{x1D6FE}$
reduces. Then the ring bubble formed after jet penetration collapses. From the ring bubble, a series of shock waves are emitted consecutively over the time spans represented by the drop lines in figure 12. The emissions are not concentrated (see figure 4
a, for example) because the collapse of the different parts of the ring are not simultaneous. The time span of the shock wave emissions is the longest at approximately
 $\unicode[STIX]{x1D6FE}=0.6$
. For smaller
 $\unicode[STIX]{x1D6FE}$
, the bubble splits and then collapses at both the far end and the near end (see figure 8
a, for example). The shock wave emitted from the split is very close in time to that from the collapse at the far end of the bubble (not plotted), but is approximately
 $5{-}15~\unicode[STIX]{x03BC}\text{s}$
ahead of the shock wave emission at the near end.
Shock wave emission time for different standoff distances. A 22 mm-thick floating ice plate was used. The time (vertical axis) is scaled to the duration of the first expansion and collapse of the bubble. The shock wave emissions are observed when the jet impacts on the opposite bubble wall (denoted by
 $+$
), when the bubble splits (▵) and when the ring bubble, after being penetrated by the jet, collapses to a minimum volume (▴). The different parts of the ring bubble collapses asynchronously and a series of shock waves are emitted over a time span represented by the drop line.

3.6 Demarcation of different ice breaking patterns
In this section, the standoff distance (
 $\unicode[STIX]{x1D6FE}$
) limit for ice breaking is tested with differently sized bubbles, and the ice breaking patterns as functions of
 $\unicode[STIX]{x1D6FE}$
and the ice plate thickness are summarized. First, bubbles are generated by discharges from 200 up to 700 V with varying
 $\unicode[STIX]{x1D6FE}$
for a floating 20 mm-thick ice plate to find the upper limit of
 $\unicode[STIX]{x1D6FE}$
for successful ice breaking. The capacitance in the experiment is constant. The electric energy released by the discharge converts into light, heat and mechanical work, including an initial wave and the mechanical energy of the bubble,
 $E_{b}$
(Chahine et al.
Reference Chahine, Frederick, Lambrecht, Harris and Mair1995). Since the ice breaking is observed only after the spark (in most cases, after the bubble collapse), we assume that the energy that causes ice breaking only comes from
 $E_{b}$
.
 $E_{b}$
can be estimated by the work done by the displaced water during the expansion of the bubble from initiation to the maximum radius,
 $R_{m}$
, against the ambient pressure,
 $P_{\infty }$
, as in the following equation (Buogo & Cannelli Reference Buogo and Cannelli2002; Tomita, Tsubota & Annaka Reference Tomita, Tsubota and Annaka2003), where
 $P_{v}$
is the saturated vapour pressure:
 $$\begin{eqnarray}\displaystyle & \displaystyle E_{b}={\textstyle \frac{4}{3}}\unicode[STIX]{x03C0}R_{m}^{3}(P_{\infty }-P_{v}). & \displaystyle\end{eqnarray}$$
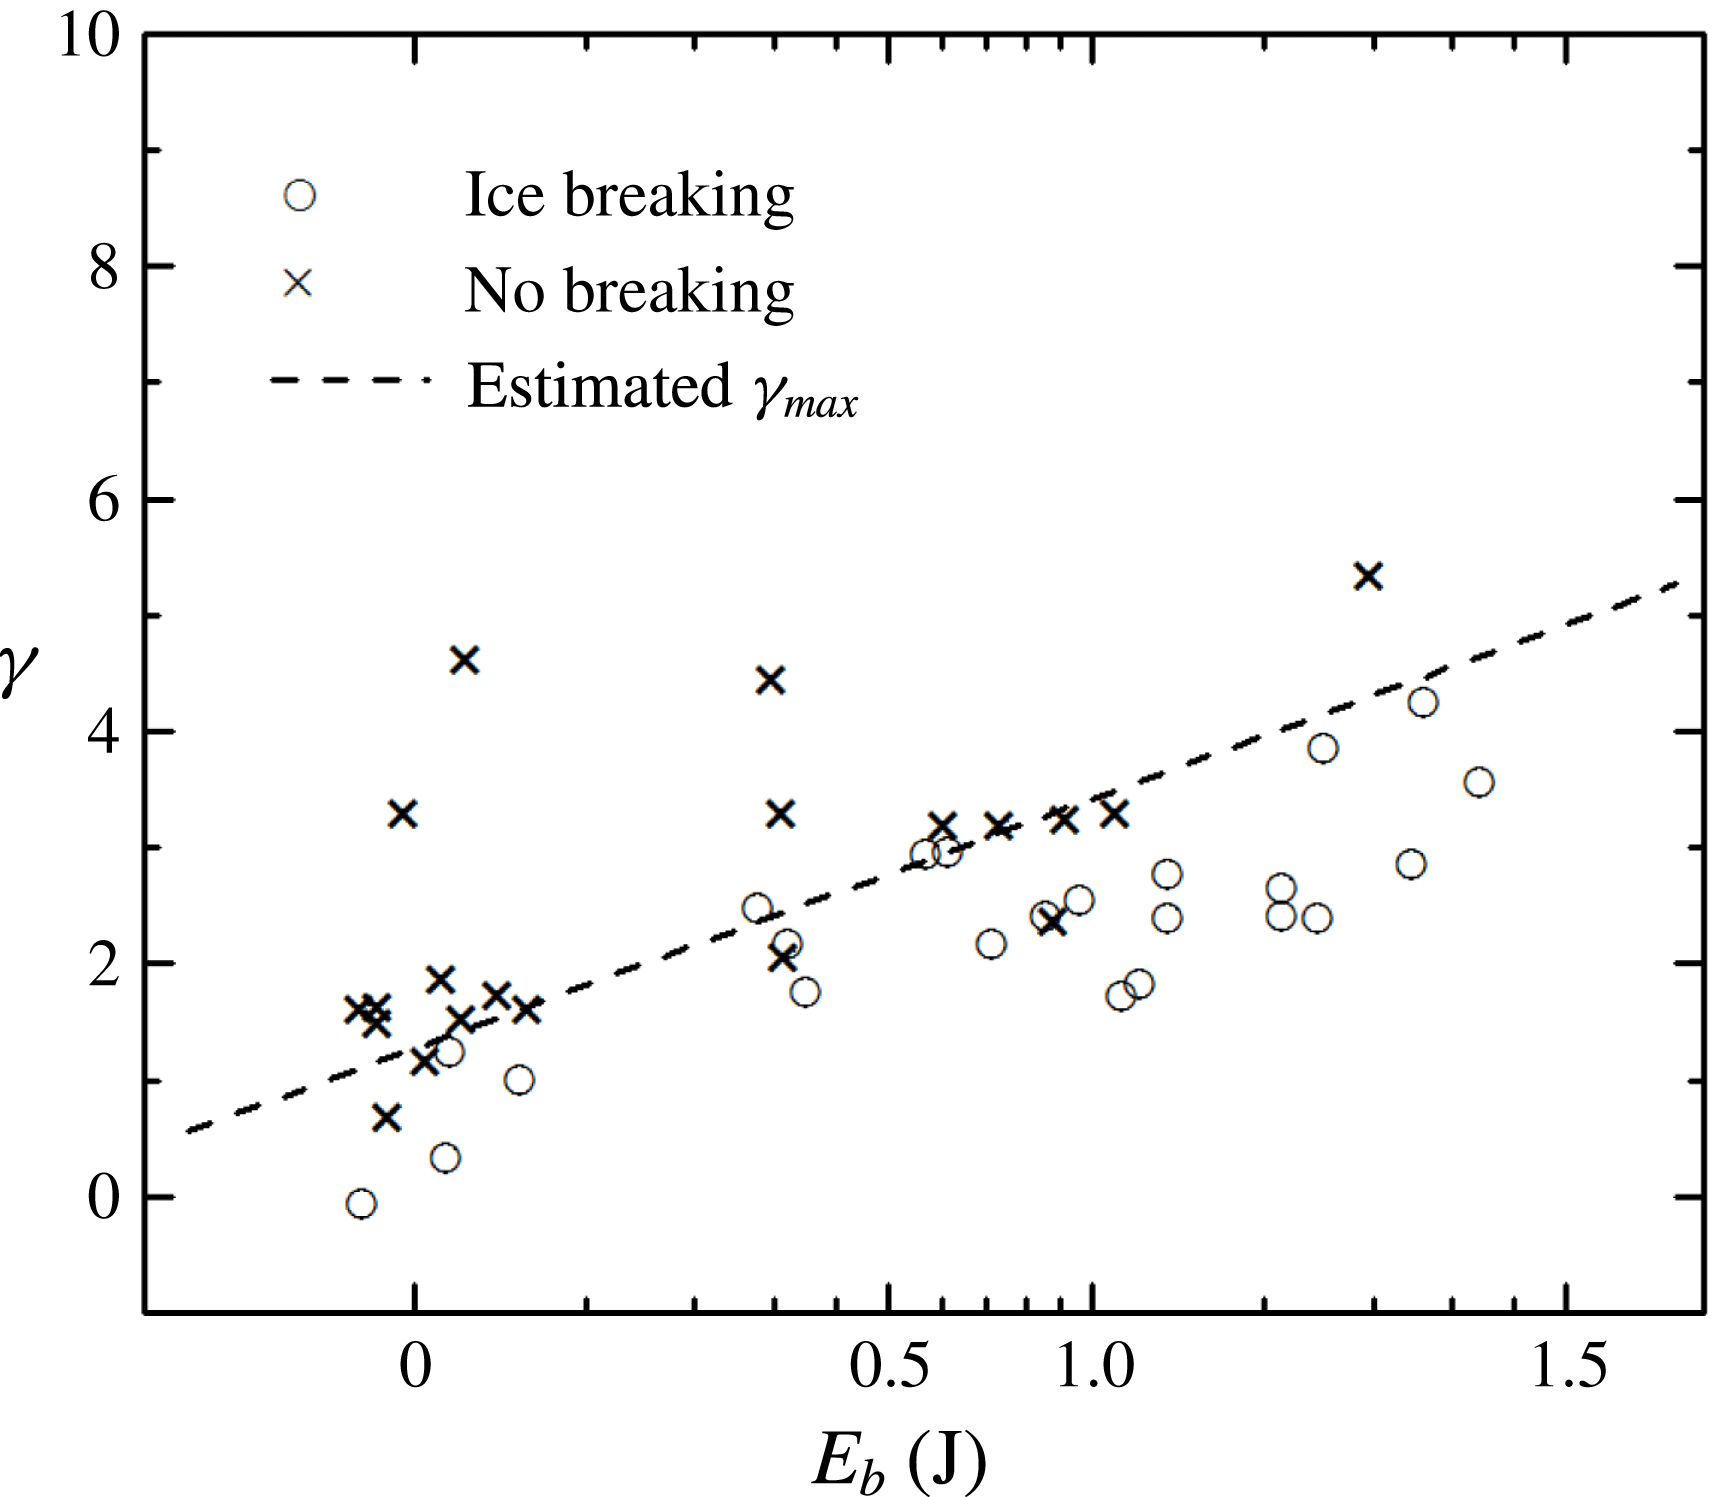
As discussed before, the ice breaking with relatively large
 $\unicode[STIX]{x1D6FE}$
is due to the tension at the top of the ice plate caused by the reflection of the shock waves. Despite the different voltage, this ice breaking pattern is not changed. When
 $\unicode[STIX]{x1D6FE}$
increases, the reflection wave weakens until it is unable to cause ice fracturing. Thus there exists an upper limit of
 $\unicode[STIX]{x1D6FE}$
, denoted as
 $\unicode[STIX]{x1D6FE}_{max}$
, for successful ice breaking. With higher energy
 $E_{b}$
, the bubble collapse is able to crack the ice from a further distance and
 $\unicode[STIX]{x1D6FE}_{max}$
is larger. The result of ice breaking as a function of
 $E_{b}$
is plotted in figure 13. As is indicated,
 $\unicode[STIX]{x1D6FE}_{max}$
increases logarithmically with
 $E_{b}$
.
Ice breaking test results as functions of the dimensionless standoff distance
 $\unicode[STIX]{x1D6FE}$
and the mechanical bubble energy
 $E_{b}$
, and an estimation on the variation of
 $\unicode[STIX]{x1D6FE}_{max}$
(the upper limit of
 $\unicode[STIX]{x1D6FE}$
for successful ice breaking) with
 $E_{b}$
. Ice plate thickness 20 mm, free floating.

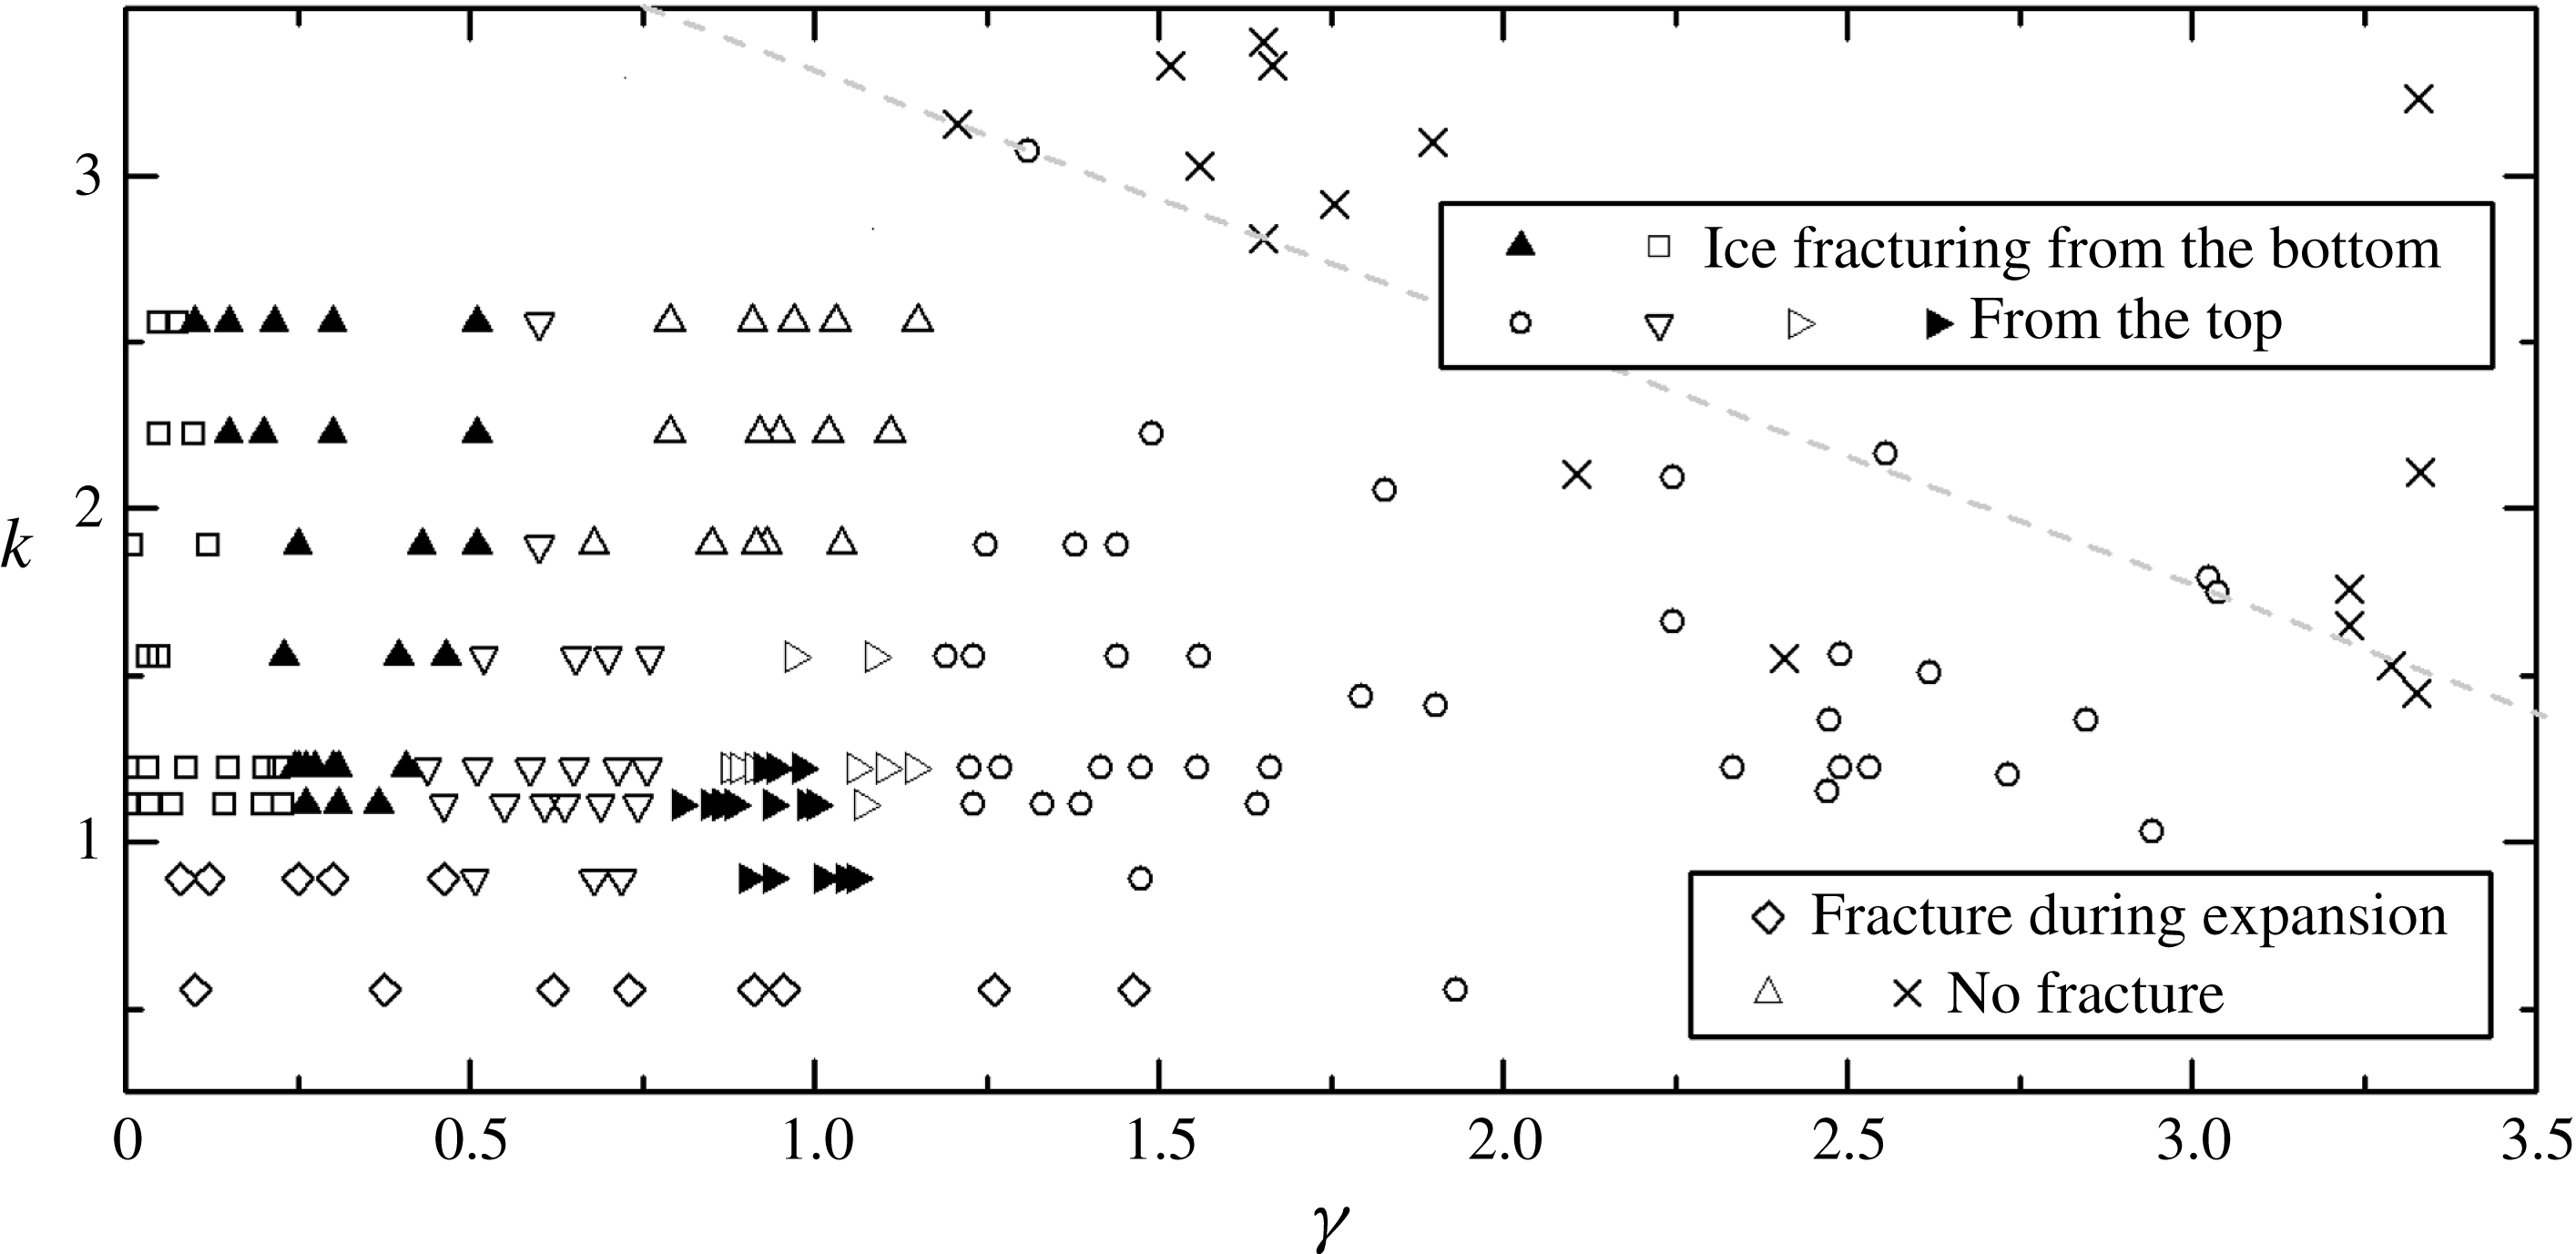
Ice fracturing patterns as a function of the dimensionless thickness of the ice,
 $k$
, and the dimensionless standoff distance,
 $\unicode[STIX]{x1D6FE}$
. ▫ ice fracturing due to the shock waves from the bubble split; ▴/▿ ice fracturing from the both sides/the top side due to the shock waves from the collapse of the ring bubble in contact with the ice; ▸/▹ ice fracturing due to the collapse of the ring bubble out of contact with the ice, with/without small cracks appearing at the top of the ice plate before the collapse-induced shock wave occurs; ▵ no fracturing, ring bubble collapsing in contact with the ice; ♢ ice fracturing when subjected to bubble expansion; ○/
 $\times$
ice fracturing/no fracturing, no contact between the ice and the bubble or the jet.

The fracturing patterns of the floating ice plates are summarized in figure 14 as functions of the dimensionless thickness of the ice,
 $k$
, and the dimensionless standoff distance,
 $\unicode[STIX]{x1D6FE}$
. The experiment cases with no fracturing due to large bubble–ice distances are denoted by
 $\times$
. When
 $k$
is small, the ice plate will be fractured when subjected to the expansion of the bubble (denoted by ♢). Except that the bubble collapse and the shock waves are the main causes of the ice breaking. With a relatively large
 $\unicode[STIX]{x1D6FE}$
, the ice is fractured by the reflection of the shock waves emitted from the bubble collapse, before the jet impacts the ice plate (denoted by ○). With a relatively small
 $\unicode[STIX]{x1D6FE}$
, the ice is fractured from the bottom by the shock waves emitted upon the split and the subsequent collapse of the bubble (denoted by ▫). With medium
 $\unicode[STIX]{x1D6FE}$
, the ice plate is subjected to the impact of the bubble jet before the bubble reaches the minimum volume. The bubble then collapses in a ring shape and emits a series of shock waves. This corresponds to the region with triangles. In the region scattered with ▸ and ▹, the jet impacts on the ice after penetrating a gap between the bubble and the ice plate, while in the region with ▿, the bubble is in direct contact with the ice plate. In these cases the ice plate fractures from the top mainly as a result of the reflection of the shock waves emitted by the collapse of the ring bubble, except that in the cases denoted by ▸, small cracks form at the top of the ice plate before the bubble reaches the minimum volume. For the region scattered with ▴, the ring bubble ends up with a stronger collapse and a more concentrated shock wave emission that directly fractures the ice from the bottom. Finally, as the thickness increases, the ice plate will no longer be fractured by the reflection of the shock wave from the ring bubble. Such cases are denoted by ▵.
4 Conclusion
In order to investigate the mechanism of ice breaking by a collapsing bubble, experiments on the interaction between an underwater electric discharge bubble and a circular ice plate have been carried out, and the shock waves and the fracturing of the ice have been visualized. The ice plates were either fixed or floating on the water surface and have different thicknesses. The distance between the bubble and the ice plate ranged from several times the maximum bubble radius to almost zero. Possible causes of ice breaking include the incidence and the reflection of the shock waves generated by the bubble collapse, the jet impact and the hogging moment caused by the bubble.
The observed bubble behaviour generally falls into two types. The first type includes a jet directed towards the ice and a subsequent ring-shaped bubble. Shock waves are emitted from the collapse and rebound of the bubble, or the impact of the jet on the opposite side of the bubble. For the second type, the bubble pinches off at the far end and collapses onto the ice at the near end. Shock waves are emitted at both ends and also from the split. This type of bubble behaviour was observed only with a floating ice plate and a small
 $\unicode[STIX]{x1D6FE}$
. The characteristics of the bubbles are different under the fixed and the floating ice plates. When the ice plate is floating, it undergoes a heave motion driven by the bubble. As a result, the bubble shape is elongated in the vertical direction, and the maximum jet speed is higher. When the thickness of the ice plate is increased, both the heave motion and the elongation decrease. Correspondingly, the bubble jet towards the ice plate becomes wider and its maximum speed is reduced.
The collapsing bubble is capable of causing ice breaking. The pattern of fracturing is dependent on the dimensionless ice thickness
 $k$
and the dimensionless standoff distance
 $\unicode[STIX]{x1D6FE}$
. It is indicated that the shock waves mentioned above are a main reason for the damage to the ice in the current set-up. The shock waves reflect at the ice–air interface (the top surface of the ice plate) into expansion waves that cause tension, and thus the ice fractures from the top. This can happen even without contact between the ice and the bubble or the jet, as long as
 $\unicode[STIX]{x1D6FE}$
is below a certain value,
 $\unicode[STIX]{x1D6FE}_{max}$
. Results indicate that
 $\unicode[STIX]{x1D6FE}_{max}$
increases logarithmically with the mechanical energy of the bubble
 $E_{b}$
. Meanwhile, the ice can also be fractured upon the incidence of the shock waves. This requires small bubble–ice distances whereby the bubble collapses onto the ice surface or splits with multiple shock wave emissions. When the thickness of the ice increases, it becomes harder to induce fractures on the top of the ice plate by the shock wave reflection. However, the fracturing from the bottom, corresponding to the shock wave incidence, is hardly affected by the ice thickness. Ice plates with small thickness also break when subjected to the bubble expansion.
Also, it is intriguing that the bubble jet is found to be less effective in fracturing the ice compared to the shock waves from the same bubble. In the experiments, the jet impacts on the centre of the ice plate surface but no fracture occurs on the spot. This is in agreement with previous numerical results (Hsiao et al. Reference Hsiao, Jayaprakash, Kapahi, Choi and Chahine2014; Chahine et al. Reference Chahine, Kapahi, Choi and Hsiao2016) where, during bubble collapse near a solid wall, the pressure peak caused by the collapse of the remaining bubble ring can reach even twice that of the jet. Some small cracks may initiate in the ice from the side opposite to the jet impact. These are presumably associated with the pressure waves and the hogging moment caused by the impact, but the damage is minor compared to that due to the shock waves from the bubble collapse. In addition, the ice plate served as an effective indicator in that, by observing its fracturing pattern, one can distinguish the potential of different damaging sources. Based on the above observations, the design of ice breaking equipment can be optimized to maximize the power of the bubbles in the future.
Acknowledgements
This work is supported by the Natural Science Foundation of China (NSFC) (11672081 and 51709057).