

Racism has been consistently linked with negative mental health outcomes in various minority racial/ethnic groups in various societies with immigrant and Indigenous populations (Cunningham & Paradies, Reference Cunningham and Paradies2013; Dunn & Geeraert, Reference Dunn and Geeraert2003; Harris et al., Reference Harris, Tobias, Jeffreys, Waldegrave, Karlsen and Nazroo2006; Larson, Gillies, Howard, & Coffin, Reference Larson, Gillies, Howard and Coffin2007; Paradies, Reference Paradies2006; Williams, Neighbors, & Jackson, Reference Williams, Neighbors and Jackson2008). Most racism research, however, focuses on the effects of racism on its victims, while overlooking the factors that produce racism and preclude racial, ethnic, cultural and religious acceptance.
Internationally, various measures of racist attitudes exist, but these generally concentrate on anti-African American attitudes and are validated only for US populations. Since differences in context and cultural milieu preclude direct extrapolation of US findings to Australia (Pedersen, Beven, Walker, & Griffiths, Reference Pedersen, Beven, Walker and Griffiths2004), several Australian measures have been developed. However, these either focus on one group (e.g., Indigenous Australians; Pedersen et al., Reference Pedersen, Beven, Walker and Griffiths2004) or have not been empirically developed and appropriately validated (e.g., Dunn & Geeraert, Reference Dunn and Geeraert2003). For youth, the available instruments are limited to measures of social distance and stereotyping (e.g., Doyle & Aboud, Reference Doyle and Aboud1995; Walker & Crogan, Reference Walker and Crogan1998), scales that have been adapted from non-Australian measures, but have not subsequently undergone further validation (e.g., White & Gleitzman, Reference White and Gleitzman2006), or complex surveys requiring extrapolation of participant prejudice levels from their interpretation of the seriousness of prejudice-laden scenarios, leading to questions of reliability and validity (e.g., White & Abu-Raya, Reference White and Abu-Raya2012). Hence, there is a dearth of developmentally appropriate tools for accurately measuring racism across groups in Australia. As no Australian instrument has been developed utilising advanced psychometric analyses, such as item response theory (IRT), nor appropriately validated across racial/ethnic or age groups, the accurate evaluation of interventions addressing racist attitudes, in both educational institutions and throughout the community, is inhibited.
This research aimed to address these concerns by exploring racism as experienced by Australians from diverse backgrounds. Using an accepted scientific process of scale development (DeVellis, Reference DeVellis2012), a measure of racial, ethnic, cultural and religious acceptance was developed, with an overarching goal for the measure to be appropriate for evaluating the effectiveness of anti-racism and pro-diversity initiatives in Australian schools and throughout the community. Initial stages explored conceptualisations of racism based on data from in-depth semi-structured interviews and focus groups with young people from various racial/ethnic backgrounds, which were utilised to develop the preliminary items. Secondary stages examined the underlying latent factor structure of the measure across multiple age groups. Final stages validated the psychometric properties of this scale in adolescents and adults from the Australian community. Ethics approval for each stage was provided by Monash University Human Research Ethics Committee.
Study 1: Item Development
Qualitative research was conducted from December 2011 to March 2012 on young Australian conceptualisations of, and experiences with, racism to generate sufficient data to form the basis of a scale (detailed elsewhere; Grigg & Manderson, Reference Grigg and Manderson2014a). The qualitative data were supplemented by an extensive and comprehensive literature review of the conceptual racism literature and existing instruments to create the preliminary items. Racism is a complex social issue, about which a variety of explanations, perspectives and theories have been advanced, with evolving hypotheses appearing in distinct phases and forms in different epochs and localities. As there was minimal existing data on understandings of racism within contemporary Australia, efforts were made to ensure that the development of the items was atheoretical and primarily driven by the data collected in qualitative research, rather than rigidly conforming to a chosen theory of racism. Consequently, the items developed can be thought of as representing the multidimensional nature of contemporary racism in Australia, spanning a number of theoretical positions, including symbolic racism (Kinder & Sears, Reference Kinder and Sears1981), modern racism (McConahay, Reference McConahay1983), aversive racism (Gaertner & Dovidio, Reference Gaertner and Dovidio1977; Kovel, Reference Kovel1970), and more recently, subtle and blatant prejudice (Pettigrew & Meertens, Reference Pettigrew and Meertens1995) and colour-blind racism (Neville, Lilly, Lee, Duran, & Browne, Reference Neville, Lilly, Lee, Duran and Browne2000).
The purpose of the final instrument was to inform anti-racism and pro-diversity initiatives. Items were therefore designed to measure acceptance of difference and racism viewed along a continuum. Harris (Reference Harris2010) makes an important distinction between the terms tolerance and acceptance, which may be appropriately applied to race relations. Explained in the context of unwanted feelings, tolerance is said to be a struggle with, and a hope that, the feelings will disappear. In contrast, acceptance allows these feelings to exist without struggle or distress. We considered it important to focus on acceptance of difference, rather than the tolerance of different individuals and groups (cf. VicHealth, 2007).
An initial item pool of 420 statements was developed based on the aforementioned qualitative data, in addition to a comprehensive review of the child, adolescent and adult racism literature, to ensure both lay and academic conceptualisations of racism informed the item content. Items were reviewed for appropriateness, comprehensiveness, redundancy and clarity of items; the item pool was reviewed by two experts in the racism field (one of Indigenous Australian and Chinese background and one of non-Indigenous Australian background) and then reduced to 40 statements covering 14 themes, including comfort with and acceptance of difference, perceptions of safety with difference, and acts of racism. The preliminary scale contained 15 items, with higher scores indicating greater acceptance and 25 items with higher scores indicating lower acceptance. Items were reworded to ensure a balance of positive and negative items, to avoid response bias due to the sensitivity of the attitudes under evaluation (Schriesheim & Hill, Reference Schriesheim and Hill1981; Schweizer & Schreiner, Reference Schweizer and Schreiner2010) and to explore both positive (acceptance) and negative (racism) attitudes, which have been found to be functionally independent (i.e., positive attitudes are stronger predictors of positive behaviours and negative attitudes are stronger predictors of negative behaviours; cf. Pedersen et al., Reference Pedersen, Beven, Walker and Griffiths2004; Pittinsky, Rosenthal, & Montoya, Reference Pittinsky, Rosenthal and Montoya2011) and conceptually distinct (Phillips & Ziller, Reference Phillips and Ziller1997). A 10-item version of the Marlowe-Crowne Social Desirability Scale (MCSDS; Fischer & Fick, Reference Fischer and Fick1993; Strahan & Gerbasi, Reference Strahan and Gerbasi1972) was also amended and included in the preliminary scale (MCSDS-A) to assess self-presentation bias in Australia. Socially desirable responding was considered important to assess and is often included in addition to the primary measure of interest when scales address potentially uncomfortable or anxiety provoking topics (Anastasi & Urbina, Reference Anastasi and Urbina1996; Loewenthal, Reference Loewenthal2001). This is especially a concern when measuring sensitive concepts, such as those related to racism (Phillips & Ziller, Reference Phillips and Ziller1997).
The items were randomised, with each eliciting a response on a 4-point Likert-type scale, from strongly disagree to strongly agree (half reverse scored). A neutral option was omitted to ensure ambivalent participants offer a meaningful response and to encourage effort-minimising participants to more deeply consider their opinions when responding to the survey (Nowlis, Kahn, & Dhar, Reference Nowlis, Kahn and Dhar2002). The preliminary scale was reviewed by six primary school principals and an experienced clinical child psychologist; introductory instructions were subsequently expanded and simplified. The scale was reviewed by participants in three focus groups (14–22 years, N = 17; Grigg & Manderson, Reference Grigg and Manderson2014a) and a preliminary scale reliability analysis was performed. Cronbach's alpha was very high (.94). Four items had low item-total correlations (< .20), but none were removed as all were considered important. The preliminary scale was suitable for children with a Grade 4 reading level (as per Gunning Fog and Flesch Kincaid Grade level indices). The scale was pilot tested with eight children aged 9–12 years for review of item clarity and developmental appropriateness. Cognitive interviewing techniques (Willis, Reference Willis2005) were utilised to ensure that young children could comprehend the intended meaning and appropriately respond to each question. Participants were asked to (1) read each question, (2) verbalise their thoughts, (3) explain what the question was asking, and (4) define any key terms or words. No items required removal, but some were reworded.
Study 2–4 Preliminary Data Analysis
Each of the data sets (primary school, combined community, 15–20 years, and 21+ years) utilised in Study 2–4 were collated and cleaned in IBM SPSS Statistics 20. Data were screened for univariate outliers (nil), missing data were identified, and all cases with more than 5% missing data were removed. Regression analysis was utilised to deal with the remaining missing data. Exploratory analyses were performed to assess the distribution of the data. Although the Shapiro-Wilk test of normality indicated that each of the 40 measured variables across all data sets were significantly univariately skewed (p < .001), for the purpose of performing principal components analysis (PCA), exploratory factor analysis (EFA) and confirmatory factor analysis (CFA), the data were considered appropriate due to assumption of sampling distribution normality for sample sizes >30 (Field, Reference Field2009; Games, Reference Games1984; Tabachnick & Fidell, Reference Tabachnick and Fidell2007).
The minimum amount of data for factor analysis was satisfied (Tabachnick & Fidell, Reference Tabachnick and Fidell2007). Initial ratios of cases per variable were approximately 3:1 for the primary school data set and 7:1 for the overall community data set (4:1 for 15–20 years and 3:1 for 21+ years). These ratios improved as items were deleted from the preliminary scale (final ratios 8:1, 6:1, and 5:1 respectively).
Study 2: Principal Components and Exploratory Factor Analyses
This component aimed to identify the underlying latent structure of the measure according to classical test theory (CTT).
Materials and Methods
Participants were 296 students enrolled in Years 5 or 6 at six primary schools from different socioeconomic and cultural backgrounds in a growth corridor in the southeast of Melbourne, Australia. Each school participated as part of the provision of a community-based anti-racism program in September 2012. Only 194 (66%) responses were usable and one participant did not provide complete demographic data, with 111 males and 82 females aged between 10–13 years (M = 11.38, SD = 0.73). Participants were demographically diverse: 25 (13%) born outside of Australia in addition to 54 (28%) mothers and 65 (34%) fathers.
Results
Principal components analysis
Data were examined using PCA to produce an initial empirical summary (Tabachnick & Fidell, Reference Tabachnick and Fidell2007). Oblimin rotation was performed with the primary school data set to estimate the number of components, absence of multicollinearity and factorability of the correlation matrices. Eleven components with initial Eigenvalues above 1 were extracted. None were internally consistent or well defined by the variables (highest squared multiple correlation .24). Conversely, communality values were adequate: the smallest was .53, above recommended minimum of .40 (Costello & Osborne, Reference Costello and Osborne2005). Sampling adequacy was acceptable: the Kaiser-Meyer-Olkin measure was .83, above recommended minimum of .60 (Tabachnick & Fidell, Reference Tabachnick and Fidell2007), and Bartlett's Test of Sphericity was significant (p < .001). Given these indicators, PCA appeared suitable with all 40 items. Inspection of the scree plot indicated the existence of between one to five components. Each of the first four factors explained more than 5% of the variance, considered to be a cut-off for useful factors (Polit & Beck, Reference Polit and Beck2003), with explained variance of 20.90%, 8.91%, 6.13%, and 5.04% respectively. The fifth factor was consequently omitted from further analysis.
Exploratory factor analysis
An EFA was considered appropriate for performing additional analyses (Tabachnick & Fidell, Reference Tabachnick and Fidell2007) and was conducted with each of one, two, three and four factors. Solutions were examined using oblimin rotations of the factor-loading matrix. All cross-loading items above .32 and items with factor loadings less than .32 were removed (Tabachnick & Fidell, Reference Tabachnick and Fidell2007). Items with communalities below .20 were removed, rather than below .40, to enable CFA to confirm the underlying factor structure and Rasch analysis to re-confirm the underlying latent structure and additionally to remove inconsistent items. The one-factor solution appeared to be a poor fit for the data, accounting for 19.03% of the variance after extraction. The two-factor solution initially accounted for 26.27% (19.20% and 7.07%) and the final solution (17 and 7 items) 34.91% (26.57% and 8.35%) of variance. The three-factor solution initially accounted for 30.99% (19.31%, 7.18% and 4.50%) and the final solution (15, 8, and 4 items) 37.30% (24.16%, 7.82% and 5.33%) of variance. The four-factor solution initially accounted for 34.65% (19.38%, 7.26%, 4.56% and 3.46%) and the final solution (15, 9, 6, and 4 items) 37.66% (20.65%, 7.99%, 5.06% and 4.05%) of variance.
The three-factor solution was preferred because of (1) variance added from the two- to three-factor solution, (2) minimal variance added from the three- to four-factor solution, and (3) small amount of variance (i.e., less than the cut-off of 5%) accounted for by final factor in the four-factor solution. The three-factor solution consisted of Accepting Attitudes (15 items), Racist Attitudes (8 items) and Ethnocentric Attitudes (4 items), subscales respectively considered to measure underlying attitudes reflecting out-group endorsement and acceptance, out-group denigration and derogation, and in-group favouritism and loyalty.
Study 3: Exploratory and Confirmatory Factor Analyses
This component examined the underlying latent factor structure of the measure.
Materials and Methods
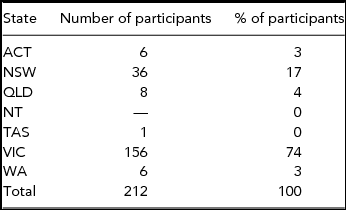
Participants were 402 community individuals aged 15 years or older, recruited from around Australia (see Table 1) via newspaper, radio and online advertising from March 2012 to April 2013. Responses were retrieved from an online survey database; four additional hard copy surveys were entered after online data collection ceased. Data were split by adolescents aged 15–20 years and adults aged 21+ years to explore consistency across age groups.
Community Sample Participant State of Origin

Note: Only 212 out of the 402 responses received provided a postcode.
Only 263 responses were usable (65%); one did not provide complete demographic data. Mean age of participants was 23.24 (9.72) years (71 M, 192 F), 147 aged 15–20 years (M = 18.31, SD = .41; 46 M, 101 F) and 116 aged 21–71 years (M = 29.49, SD = 11.93; 25 M, 91 F). Participants were demographically diverse: 81 (31%) born outside of Australia in addition to 130 (49%) mothers and 133 (51%) fathers.
Results
Exploratory factor analysis
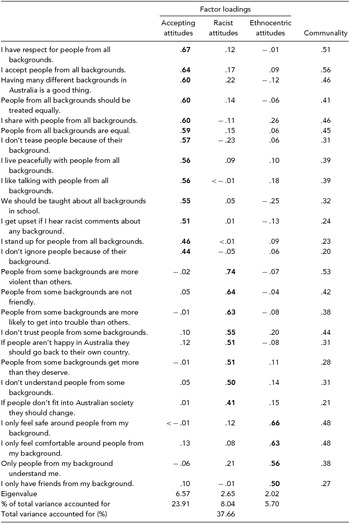
Due to age differences between the primary school data set and the community data sets, we examined the measure with two child-specific items removed (‘I play with people from all backgrounds’ and ‘I like having people from other backgrounds in my school’). The 25 remaining items (13, 8 and 4 items) were re-examined with the primary school data set using oblimin rotations of the factor-loading matrix. The three-factor solution retained the same structure and content labels, with greater variance after extraction. The Kaiser-Meyer-Olkin measure of sampling adequacy was .84 and Bartlett's test of sphericity was significant (p < .001). Given these indicators, the three-factor model with 25 items appeared an improvement and appropriate for additional CFA (see Table 2).
Primary School Sample Factor Loadings for 25-Item Three-Factor Solution RACES

Note: Extraction method: Maximum likelihood; Rotation method: Oblimin with Kaiser normalisation; 5 iterations; bold denotes the subscale each item is drawn from.
Internal consistency was examined using Cronbach's alpha; the 25-item RACES and each of the subscales separately possessed adequate internal consistency (>.70; Nunnally, Reference Nunnally1978). No substantial increases in alpha for any of the subscales, or the overall measure, could be achieved by eliminating additional items (see Table 3).
Primary School Sample Cronbach's Alpha for 25-Item Three-Factor Model RACES

Analyses indicate that three distinct internally consistent factors underlie child responses to the 25-item RACES.
Confirmatory factor analysis
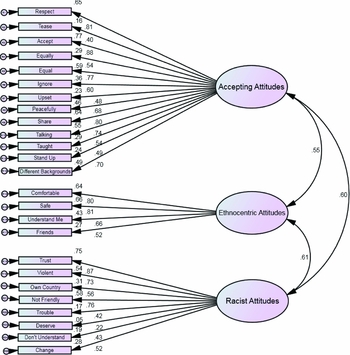
The three-factor solution was examined with each community data set independently (see Figures 1 and 2): ellipses represent latent variables, rectangles measured variables, and circles residuals. Direction of an arrow represents the direction of a hypothesised effect; absence of a line connecting variables implies no hypothesised direct effect. As per the PCA and EFA, a three-factor model of Accepting Attitudes, Racist Attitudes and Ethnocentric Attitudes was hypothesised.
CFA factor structure of 25-item RACES with 15–20 years age group.

CFA factor structure of 25-item RACES with 21+ years age group.

CFA based on the 15–20 years community data set was initially performed using IBM SPSS Amos 20 on the 25-item three factor model RACES. Moderate support was found for the hypothesised model. Although the χ2 statistic indicated a poor fit, χ2(272) = 467.23, p < .001, this statistic is overly sensitive to sample size (Tabachnick & Fidell, Reference Tabachnick and Fidell2007). To avoid model misspecification, we used multiple indices of fit with widely accepted cut-off criteria (Hu & Bentler, Reference Hu and Bentler1999; Schweizer, Reference Schweizer2010). CMIN/df is considered poor fit above 3.00 (Hu & Bentler, Reference Hu, Bentler and Hoyle1995); RMSEA poor fit above .10 (Tabachnick & Fidell, Reference Tabachnick and Fidell2007) and good fit below .08 (Browne & Cudeck, Reference Browne, Cudeck, Bollen and Long1993); IFI good fit above .90 (Marsh & Hau, Reference Marsh and Hau1996); and SRMR good fit below .10 (Kline, Reference Kline2004). On each of these indices, the model was of acceptable fit (1.72, .07, .88, and .07 respectively).
Additional CFA, based on the 21+ years data set, was performed, providing moderate additional support for the model's robustness in adults. The χ2 statistic indicated poor fit, χ2(272) = 406.63, p < .001, but on each of the CMIN/df (1.50), RMSEA (.07), IFI (.90) and SRMR (.07) indices, the model was of acceptable fit.
Results suggest that the hypothesised model, developed with school children, is acceptably replicated in age groups 15–20 years and 21+ years, supporting the RACES factorial validity (see Appendix A for supplementary CFA results).
Study 4: Item Response Theory Analyses
Given the heated debate about the psychometric superiority of IRT versus CTT techniques (DeVellis, Reference DeVellis2012; Furr & Bacharach, Reference Furr and Bacharach2008; Reise, Ainsworth, & Haviland, Reference Reise, Ainsworth and Haviland2005), both methods were integrated throughout the evaluation of the instrument (Embretson & Hershberger, Reference Embretson and Hershberger1999). This component explored the underlying factor structure of the measure using IRT to refine and finalise the measure. Full details of the IRT analyses and comprehensive results are available elsewhere (Grigg & Manderson, Reference Grigg and Manderson2014b).
Materials and Methods
The primary school, 15–20 years, and combined community data sets were utilised. The 21+ years data set failed to meet minimum IRT assumptions (Linacre, Reference Linacre2002a) and was omitted from independent analysis. For our purposes, a Rasch model known as a polytomous one-parameter rating scale model (RSM; Andrich, Reference Andrich1978) was considered appropriate. The RSM was utilised to examine both the underlying latent unidimensional structure of each subscale independently and of the three subscales as a single multidimensional scale. Model and item fit were assessed and items were removed according to recommended criteria (Linacre, Reference Linacre2002b).
Results
Data were collated and analysed in ACER ConQuest 3.0. Unidimensional analysis of the subscales as independent scales demonstrated that one item (‘I don't tease people because of their background’) was a poor fit across all indices for both the 15–20 years and the combined community data sets, and was removed from further analysis. All other items for each data set and each subscale functioned adequately and demonstrated acceptable infit and/or outfit (0.5–1.5).
Multidimensional analysis was utilised to confirm the underlying structure of the measure as multi-scale and demonstrated one item (‘I don't ignore people because of their background’) to be of less than ideal infit and outfit for the primary school data set. For both the 15–20 years and community data sets, one item (‘People from some backgrounds get more than they deserve’) was less than ideal infit and outfit. All other items were acceptable infit and/or outfit for each data set. No items were removed due to acceptable values across most items and the balance of the current version of the scale (i.e., 12 positive and 12 negative items). The final 24-item RACES consisted of three interdependent subscales, Accepting Attitudes (12 items), Racist Attitudes (8 items), and Ethnocentric Attitudes (4 items).
Study 5: Convergent and Discriminant Validity
The final component aimed to provide initial convergent and discriminant validation of the novel measure in its final 34-item form (i.e., 24-item RACES and 10-item MCSDS-A; see Appendix B).
Materials and Methods
The combined community data set was utilised with the Dunn and Geeraert (Reference Dunn and Geeraert2003) racism survey (DG), a 10-item instrument that purports to measure racist attitudes. DG items are responded to on a 4-point Likert-type scale ranging from strongly disagree to strongly agree; half are reverse scored so higher scores indicate higher levels of racist attitudes. The measure has not been adequately validated but was used for comparison because it is utilised nationwide and is the only existing Australian measure of racist attitudes not specific to a single group. In the present study, the internal consistencies were .63 (DG) and .73 (MCSDS-A), and the RACES total scale and subscales ranged from .79–.91.
Results
All cases with 5% or more data missing across the RACES, MCSDS-A or DG were removed, and separate regression analyses for each scale were conducted with remaining missing data. Data were then recombined into a single data set to maximise the sample size, using the same 263 responses detailed above.
Assumptions were examined via the inspection of normality plots; although some variables appeared non-normal, the sample size was sufficiently large to enable selected statistical analyses to be robust. No significant univariate or multivariate outliers were detected. All analyses were conducted utilising the general linear model, with casewise deletion dealing with any unpaired data. Descriptive statistics are shown in Table 4.
Community Sample Descriptives for Total Scales and RACES Subscales by Age

Note: Descriptive statistics were calculated separately for each analysis due to differing sample sizes.
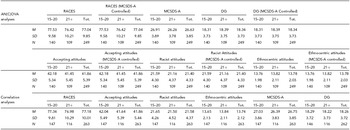
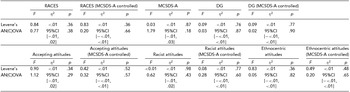
Six one-way ANOVAs with Group (15–20 years and 21+ years) as the factor were conducted to assess the effect of age on the RACES total score, subscale scores, the MCSDS-A and the DG. Five one-way ANCOVAs with Group as the factor and MCSDS-A as the covariate were conducted to assess the effect of age on the RACES total score, subscale scores and the DG, while controlling for the effect of socially desirable responding. All analyses met the assumption of homogeneity of variances (see Table 5).
Community Sample ANOVA and ANCOVA for Total Scales and RACES Subscales

Note: For all analyses df = 1, 247. *p < .05. **p < .01. ***p < .001.
There were no significant differences between the RACES total scale or subscale scores for the two age groups, effect sizes were trivial (Cohen, Reference Cohen1988), and each lower bound confidence interval was below zero. Use of the MCSDS-A as a covariate did not impact these results. This supports the discriminant validity of the RACES across multiple age groups.
Pearson's correlations were performed to examine the relationships between the measured variables across age group. These results were in the expected direction, with expected effect sizes and consistent confidence intervals. The RACES total scale and subscales were significantly positively related to each other, with moderate to near perfect effect, and with the MCSDS-A, with small to moderate effect. There was a significant negative relationship between the RACES total scale and subscales and the DG, with moderate to very large effect. The MCSDS-A was significantly negatively related to the DG, with small effect. Results suggest greater levels of acceptance are related to lower levels of racist attitudes and reinforce the potential impact of social desirability on attitudinal measures, supporting the inclusion of a social desirability scale in the novel measure.
Strong consistency of relationships existed between the measured variables across age group. The only observed unexpected correlation was between the EAS and MCSDS-A, with no relationship for participants aged 15–20 years but a positive relationship for participants ≥21 years.
General Discussion
Strong factorial validity appears in the 24-item RACES across primary school children, adolescents and adults. The RACES appears to be a reliable three-dimensional scale of Accepting Attitudes (12 items), Racist Attitudes (8 items), and Ethnocentric Attitudes (4 items), providing information about and discriminating between individuals across the range of the latent trait of acceptance.
The research demonstrates initial construct, convergent and discriminant validity of the RACES total scale and subscales, and their consistency for adolescents and adults. Expected relationships for the RACES total scale and subscales were established, with relationships replicated across adolescents and adults between the RACES total scale and subscales, a measure of racist attitudes, and a measure of social desirability.
This novel measure is the first general attitudinal measure of racism and acceptance to be designed and validated in Australia for use with multiple groups across the lifespan. The development phase ensured that the items are based on real experiences, understandings and conceptualisations from real people. This contrasts with other measures that draw on secondary data and pre-existing scales. The final scale includes a social desirability measure, enabling monitoring of response bias. Our measure was assessed using both CTT and IRT, giving greater confidence in its factorial validity, contrasting again with most other instruments developed in Australia and elsewhere.
Despite the promising preliminary results, there are some limitations that need to be acknowledged. Although a nationwide sample was sought, the achieved sample was based predominantly in Victoria (with the primary school data set and the qualitative component entirely based on Victorian participants), limiting the generalisability of the results. Minimum sample sizes for factor analysis and other analyses were met, but larger sample sizes would enhance confidence in the results. Strong consistency was found across age groups, but results were based on an unbalanced overall scale (i.e., 12, 8, and 4 items), which may bias findings utilising the total scale score. Results supported the adapted social desirability measure, but specific examination of the psychometric properties of this novel scale is warranted.
Future research is needed to confirm the psychometric properties of RACES in other contexts and populations, and to establish the temporal stability of the measure prior to its dissemination to evaluate anti-racism and pro-diversity initiatives. However, the RACES has the potential to assess the effectiveness of racism-reduction programs, by evaluating the attitudes of participants prior to and after intervention. Such evaluation would provide a strong evidence base for initiatives to reduce community levels of racism.
Acknowledgments
The authors would like to acknowledge the support of Windermere Child and Family Services and Professor James Ogloff throughout the research, in addition to the statistical advice of Professor Grahame Coleman.
Supplementary Material
To view supplementary material for this article, please visit http://dx.doi.org/10.1017/edp.2015.7