Dulce de leche (DL) is a dairy product popular for its pleasant sensorial characteristics. Nutritionally, it has high energetic value and high concentration of proteins, minerals and carbohydrates. Sensory characteristics (flavour, colour, aroma) of foods such as dulce de leche, sweetened condensed milk, and evaporated milk are mainly due to the Maillard reaction that occurs during production (Mehta & Deeth, Reference Mehta and Deeth2016; Rodriguez et al. Reference Rodriguez, Cuffia, Piagentini, Lema, Panizzolo and Rozycki2016). The chemical, organoleptic, nutritional, toxicological, and in vivo manifestations of the MR are at present subjects of great interest. Its extension can be monitored by the appearance of compounds, which allows the evaluation of the intensity of the thermal processing and its nutritional changes. Among these compounds are furosine, 5-hydroxymethylfurfural (HMF) and carboxymethyl-lysine (Rosatella et al. Reference Rosatella, Simeonov, Frade and Afonso2011; Mehta & Deeth, Reference Mehta and Deeth2016).
Negative consequences of food browning are the destruction or reduction of nutritional value of essential amino acids, in addition to the reduction of digestibility. In addition, it has been suggested that HMF may be related to DNA damage, formation of growth inhibitors, and cytotoxic, genotoxic, mutagenic, and carcinogenic activities (Malec et al. Reference Malec, Llosa and Vigo1999; Yildiz, Reference Yildiz2010). HMF is one of the most used markers of the thermal treatment in foods. Several studies seek to understand the impact of HMF on food, mainly evaluating its potential adverse effects on health (Husøy et al. Reference Husøy, Haugen, Murkovic, Jöbstl, Stølen, Bjellaas, Rønningborg, Glatt and Alexander2008; Yildiz, Reference Yildiz2010; Capuano & Fogliano, Reference Capuano and Fogliano2011; Sakkas et al. Reference Sakkas, Moutafi, Moschopoulou and Moatsou2014; Choudhary et al. Reference Choudhary, Arora, Kumari, Narwal and Sharma2017). However, there are few studies concerning the influence of MRs in dairy products such as DL and LC. Most studies of this reaction in milk and dairy concern UHT milk and powder. Also scarce are studies on the effects of pH, time, concentration, and sugar type on HMF or other MR markers. Most studies of DL have evaluated colour (colorimetry), sensorial, physicochemical, compositional, rheological, and microbiological characteristics. Different authors have sought to understand the influence of MRs in DL (Pinto & Wolfschoon-Pombo, Reference Pinto and Wolfschoon-Pombo1984; Pavlovic et al. Reference Pavlovic, Glória and Santos1993; Malec et al. Reference Malec, Llosa and Vigo1999; Malec et al. Reference Malec, Llosa, Naranjo and Vigo2005; Bellarde, Reference Bellarde2006; Newton et al. Reference Newton, Fairbanks, Golding, Andrewes and Gerrard2012; Francisquini et al. Reference Francisquini, Oliveira, Pereira, Stephani, Perrone and Silva2016).
We analysed the nutritional indicator 5-hydroxymethylfurfural and the intensity of heat treatment throughout DL manufacturing, to understand how different formulas influence this index. We also performed physicochemical and compositional analyses to verify the quality and uniformity of the experimental products.
Material and methods
Twelve DL fabrications (4 treatments × 3 repetitions) were produced following the procedure proposed by Perrone et al. (Reference Perrone, Stephani and Neves2011). The fabrications were carried out at the Federal University of Viçosa (UFV) in the Department of Food Technology – Inovaleite Platform. The products were processed in a stainless steel pan (Inoxul® brand, double wall) with a capacity for 15 kg of milk and equipped with a stirrer (50 rpm). Online Supplementary Figure S1 summarises the activities performed during the experiment.
The formulas were chosen to evaluate the effects of pH, heating time, concentration, and sugar type on the browning indicator. Four treatments were carried out with three repetitions: treatment 1 (milk + 20% sucrose + 12 g bicarbonate), treatment 2 (milk + 20% sucrose + 18 g bicarbonate), treatment 3 (milk + 18% Sucrose + 2% glucose + 12 g bicarbonate), and treatment 4 (milk + 18% sucrose + 2% glucose + 18 g bicarbonate). Syrup was defined as the mixture of milk, sugar, and bicarbonate of sodium. The samples were taken at six different time points during the production (syrup without heating, syrup with 15 min of heating, syrup with 30 min of heating, syrup with 45 min of heating, syrup with 60 min of heating, and DL), and 30 d after manufacturing.
The analysis of variance (ANOVA) and the means comparison test were determined by ASSISTAT (randomised block experiment with replicates). The graph of the evolution of these indicators was plotted using PRISMA. The statistical analysis of the centesimal composition and the physicochemical attributes, and the polynomial regression analysis of the behaviour of the free HMF index were established and also the determination of the descriptive statistics of free HMF and total HMF.
The determination of the moisture content was performed using the gravimetric method, while the lipid content was obtained using the Gerber method (both in duplicate). The crude protein was determined, in triplicate, by the micro Kjeldahl method. The determination of ash content was based on the volatilisation of the organic matter using a muffle furnace, in duplicate. The total carbohydrates were obtained by the mathematical difference of the other compositional analysed constituents.
Aw analysis was performed in duplicate and conducted on Aqua Lab 4 ATE equipment (Pullman, USA). The quantification of soluble solids content was obtained in triplicate by refractometry, using the Reichert AR200 equipment (Buffalo, USA).
Free HMF and total HMF indices were obtained by spectrophotometric analysis according to Keeney & Bassette (Reference Keeney and Bassette1959). For determination of free HMF, 5 ml of each dilution, as well as distilled water (blank), were transferred to a test tube. Thereafter, 5 ml of oxalic acid (0·3 m/l) and 5 ml of trichloroacetic acid (40% m/v) were added and then filtered on qualitative filter paper. From this filtrate, 4 ml was transferred into a test tube by adding 1 ml of thiobarbituric acid (0·05 m/l) and subjecting the system to a thermostatic bath heating at 40 °C for 30 min. After the determined time, it was read in Spectrophotometer UV/Visible ThermoScientific® model Evolution 60S at 443 nm. To quantify the total HMF index, 5 ml of each dilution, as well as distilled water (blank), was transferred to a test tube by adding 5 ml of oxalic acid and subjecting this system to a boiling bath for 60 min. After this time the sample was immediately cooled to room temperature. At this time, 5 ml of TCA was added. From this point on, the same sequence as described above was followed for the free HMF (filtration, addition of TBA, heating at 40 °C, reading at 443 nm).
In order to obtain the free HMF index at 1, 2, 3, and 4, the samples were analysed directly; at 5, 6, and 7 dilution equivalent to 5 g of DL in 10 ml. For total HMF, dilution of 0·25 g of DL in 100 ml of water was carried out for all sample withdrawal intervals. The analyses were performed in triplicate. The concentration of HMF in μm/kg was established from the construction of an analytical curve using different levels of HMF standard vs. absorbance.
Results and discussion
The experimental DLs were analysed for their composition and physicochemical attributes and the results can be visualised in Table 1.
Descriptive statistical analysis of the physicochemical and compositional attributes of experimental DL

Ranalli et al. (Reference Ranalli, Andrés and Califano2011) found an equivalent average DL moisture content of 31·5% (m/m), which is similar to the average obtained in the present work. For this attribute, we observed a relatively low coefficient of variation (CV), deviation, and amplitude, indicating reasonable standardisation. Such standardisation is important because it is directly related to characteristics such as stability, quality, composition, texture, storage, packaging, and food processing. Silva et al. (Reference Silva, Ferreira, Souza, Almeida, Stephani, Pirozi, Carvalho and Perrone2015) evaluated experimental DL and found an average of 6·8% (m/m) in the different treatments, a result that was in agreement with that found in the present study. The CV for ash content was relatively low, which shows homogeneity in relation to this requirement for DLs. The variation in carbohydrate content was low; the CV was 4·86, and the minimum and maximum values were between 55·13% (m/m) and 66·5% (m/m), respectively. The average obtained for both Aw and the soluble solids content are similar to those found in the literature. Ranalli et al. (Reference Ranalli, Andrés and Califano2011) encountered averages of 0·80 for Aw, whilst Silva et al. (Reference Silva, Ferreira, Souza, Almeida, Stephani, Pirozi, Carvalho and Perrone2015) obtained values between 66·7° Brix and 69·5° Brix. The results obtained by these authors corroborate the values found for the DL of the present study. The experimental fabrication was adequately conducted, as evidenced by the physicochemical and compositional characteristics observed.
The standard curve established for the HMF indices allowed us to obtain a linear regression equation, shown below:
 $$Y = 0 \cdot 0113\; X + 0 \cdot 0015\; (R^{\rm 2} = 0 \cdot {\rm 999})$$
The mathematical model used was sufficient to explain the observed values.
Descriptive statistics for the DLs indicated a low CV (7%) for free HMF, reaching homogeneity. Pinto & Wolfschoon-Pombo (Reference Pinto and Wolfschoon-Pombo1984) analysed DL and encountered high CV for free HMF. The authors attributed this high variability to the lack of standardisation during production. They found an average value of 56·6 µm/l and a maximum value of 103·5 µm/l for free HMF. The average result obtained in this study was 87 µm/kg and the maximum value was 96 µm/kg.
It has been assumed that the DLs formulated with greater experimental control are more consistent, in the sense that the free HMF index positively correlates with the nutritional characteristics of the product. It would be interesting to increase food product regularity in physicochemical, compositional, sensorial, and nutritional characteristics. Gaze et al. (Reference Gaze, Costa, Monteiro, Lavorato, Júnior, Raices, Cruz and Freitas2015) studied different DL samples and found significant differences in product colour. The authors attributed this variation to the different compositions of proteins and sugars, as well as to the different processing time, temperature, and pressure that are variable according to the protocol of each industry.
DL when compared with other analysed products in the literature presents relatively high HMF index. Claeys et al. (Reference Claeys, Van Loey and Hendrickx2003) found free HMF values in milk, ranging from 0·646 to 0·771 µm/l, over a period of one year. Hernández et al. (Reference Hernández, Leon, Corzo, Villanova and Romera2002) found an average of 1·9 mg/kg in powdered infant formula stored for 30 d. This observation is due to a formula and type of thermal treatment applied to the DL that favours MR speed-up and greater by-product formation (Malec et al. Reference Malec, Llosa and Vigo1999).
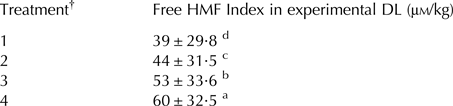
The analysis of variance for free HMF indicated a significant difference at the 1% level of probability for treatments and time. Thus, the Tukey test was performed to compare the means and verify the magnitude of the differences; the results are presented in Table 2.
Free HMF mean index in μm/kg, in the different treatments, for the experimental DLs during the manufacturing

† Treatment 1: milk + 12 g bicarbonate + sucrose; Treatment 2: milk + 18 g bicarbonate + sucrose; Treatment 3: milk + 12 g bicarbonate + sucrose + glucose; Treatment 4: milk + 18 g bicarbonate + sucrose + glucose
Treatment 4 presented the highest HMF index. This result implies that the determining factor for the increase of free HMF was the portion of glucose-substitution for sucrose, and the increase in the amount of sodium bicarbonate throughout the manufacturing. Data for individual treatments at individual time points are given in online Supplementary Figure S2.
At all times, the free HMF indices were higher in treatments 3 and 4 than in treatments 1 and 2. This can most probably be explained by the modification in the sodium bicarbonate dosage and the higher presence of glucose.
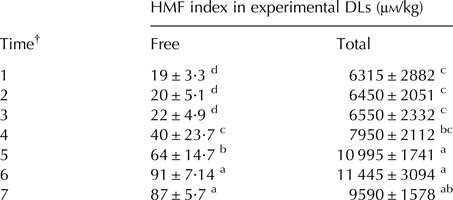
Malec et al. (Reference Malec, Llosa and Vigo1999) developed different formulas of DL, and analysed the availability of lysine. They observed changes in lysine availability, and attributed these changes to the differing DL compositions, and differing conditions of the heat treatment. These authors concluded that DL in the presence of glucose had lower availability of lysine there was a higher rate of MR, and a lower availability of essential amino acids. Table 3 shows averages for free and total HMF obtained at each sample collection time point during the manufacturing, and after 30 d storage.
Free and Total HMF mean index in μm/kg, in different collecting times, for the experimental DLs during the manufacturing

† Time point 1: no heating; Time point 2: 15 min.; Time point 3: 30 min.; Time point 4: 45 min.; Time point 5: 60 min.; Time point 6: End Product; Time point 7: 30-d stored product. Within a column, means followed by the same letter do not differ significantly from each other, assessed using Tukey test, at 5% probability
The concentration of free HMF appeared to rise over the course of production. A change in the rate of free HMF formation was confirmed for the time from 45 to 75 min, at which point this indicator began forming with greater intensity because of the prolonged heating. The DL made only with sucrose exhibited a change in the rate of free HMF formation between 60 and 75 min; it is known that this DL only exhibits lactose as the reducing sugar. For the DL made with sucrose and glucose, the rate of HMF production changed between 45 and 60 min; we interpret this change to indicate the presence of lactose and glucose.
The increase in the rate of free HMF formation at time point 4 indicates an accelerated formation of MR end products, producing the typical caramel coloration in the product.
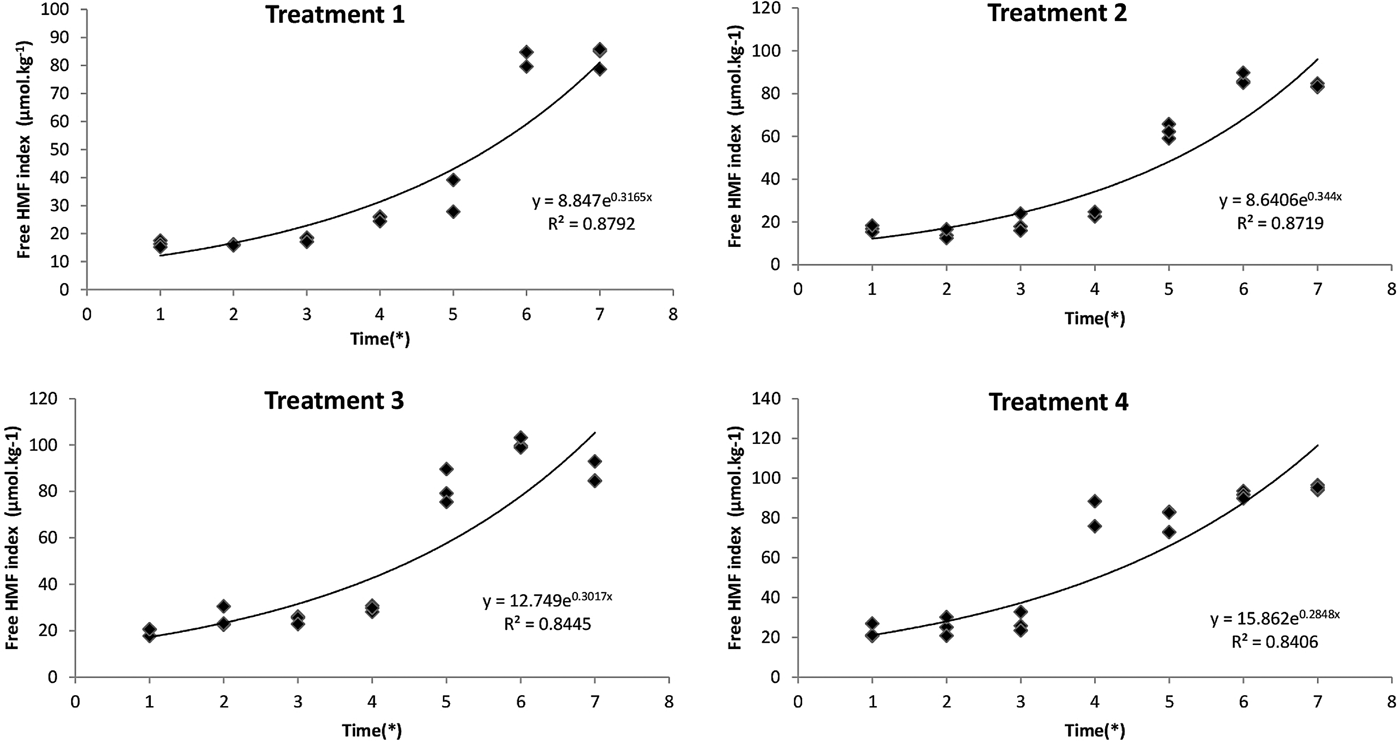
Using regression analysis, we followed the evolution of the free HMF index throughout the manufacturing and after 30 d of storage at room temperature. Figure 1 shows the results of the regression of the free HMF index (μm/kg).
Polynomial regression of the behaviour of the free HMF index, in treatment 1, 2, 3, and 4 in the experimental DLs during heat treatment and storage.

Samples in the four treatments invariably showed an increase in the concentration of free HMF throughout production and storage.
The determination of free HMF provided data that demonstrates how the severity of the heat treatment can be analytically monitored throughout manufacturing, heating, and storage, collaborating to control and prevent nutritional losses during heat treatment. The total HMF estimates the potential for browning, which is dependent on the intensity of the heat treatment, and is used to determine the heat-induced changes in the food (Pereda et al. Reference Pereda, Ferragut, Quevedo, Guamis and Trujillo2009). The CV (18%) found in this experiment was high and almost equal to the one found by Pinto & Wolfschoon-Pombo (Reference Pinto and Wolfschoon-Pombo1984) corresponding to 18·3%. These authors attributed the high variability of this index to the different types of ingredients used in DL manufacturing and to the processing conditions themselves.
In infant formulas, Gokmen & Suenyuva (Reference Gokmen and Suenyuva2006) found HMF values of 0·1–57 mg/kg (0·80–451·99 µm/kg). This HMF index variability is consistent with the results of the present study (minimum HMF: 1398 µm/kg; maximum HMF: 2791 µm/kg; average: 1918 µm/kg). Keeney & Bassette (Reference Keeney and Bassette1959) found in reconstituted skim milk powder in water total HMF with values ranging from 12·5 to 28·3 µm/kg. The total HMF indices reported in the present study are higher than those observed by Pinto & Wolfschoon-Pombo (Reference Pinto and Wolfschoon-Pombo1984); these authors found values of 3169–6432 µm/kg, and a mean of 4889 µm/kg.
The total HMF indices found in the literature are not uniform; authors attribute this unevenness to the inherent errors in the standardisation of the traditional method. Approximately 72% of the total HMF measured by this colorimetric procedure may be the result of other formed compounds that are identified based on the absorbance (Morales & Pérez, Reference Morales and Pérez1998). Besides this, the analysis of the HMF by spectrophotometer is negatively influenced by several factors such as the matrix, the dispersion of fats, the turbidity, the clarity of the solution, the dilution factors necessary to quantify different samples. Moreover the presence of some other compounds with a maximum of absorbance at 280 nm can overestimate the concentration of HMF in samples.
The analysis of variance indicated that there was no significant difference in total HMF (P > 0·05) among treatments. Neither the amount of bicarbonate nor the type of sugar employed influenced the final value of total HMF. Neves et al. (Reference Neves, Marinho, Zamagno, Lauro, Barboza and Silva2015) found similar values of total HMF in UHT milk, and attributed this similarity to the fact that this index is linked to the degree of extension of the total HMF formation reaction, and this extension correlated with the availability, degree of reactivity of the substrate, and conditions of the food medium.
Total HMF index varied significantly with processing time. Tukey's test was performed to compare the means of those results that were significantly different (Table 3). The total HMF index reached its maximal values within 60 min of manufacture; this index proxies for the estimated formation potential of the darkening reaction. The total HMF index gradually and continuously increased during the manufacturing of DL, as reported by Van Boekel (Reference Van Boekel1998).
There was a non-significant reduction in the total HMF index from time point 6 to time point 7. Morales & Pérez (Reference Morales and Pérez1998) analysed milk samples and remarked that at low temperatures, there is a linear increase in HMF with time, but at high temperatures, HMF appears to degrade. They attribute this effect to either a degradation of protein-bound Amadori products by intense heating, interaction of HMF with other reactive compounds, or a combination thereof.
Rosatella et al. (Reference Rosatella, Simeonov, Frade and Afonso2011) suggest a safe daily intake of HMF of 30–150 mg/d (238–1189 µm/d) for a 60 kg person. To achieve this HMF, it is necessary to consume 17–86 servings/d of the DL formulated by the present study, with each portion comprising 20 g DL. Only when ingested in very high amounts would DL increase the endogenous pool of HMF.
Throughout the manufacturing, there was an increase in the HMF index, which could be attributed to the different formulas. It is possible to assume that the addition of glucose and the increase in the amount of sodium bicarbonate were responsible for the increase of this indicator. This is because sodium bicarbonate acts as an acid reducer, increasing the pH of the product. Meanwhile glucose, being a reducing sugar, increases the amount of substrate available for condensation with the amino group. Thus, the two situations cause the velocity acceleration of the Maillard reaction in dulce de leche to occur.
Free HMF presented more uniform results than total HMF. Thus, the free HMF index was more useful than the total HMF index in understanding formula influences on DL manufacturing. The large difference between free HMF and total HMF in dulce de leche could be related to high formation of melanoidins during production (one hour and a half under boiling), the same results were found by Pinto & Wolfschoon-Pombo (Reference Pinto and Wolfschoon-Pombo1984).
Supplementary material
The supplementary material for this article can be found at https://doi.org/10.1017/S0022029918000353
The authors thank the Brazilian agencies FAPEMIG, CNPq, and CAPES for financial support.