


Introduction
The notion of work-to-family conflict (WFC) is grounded in role strain and role stress theories, which posit that individuals juggle multiple roles, each with its own set of obligations demanding specific behaviours, time commitments, resources or physical presence (Goode, Reference Goode1960; Pearlin, Reference Pearlin1989). The familial and occupational spheres represent crucial roles characterised by persistent demands, expectations and societal pressures to adhere to their respective norms. As a result, clashes between work and family responsibilities are inevitable (Goode, Reference Goode1960; Pearlin, Reference Pearlin1989), leading to inter-role strain and stress that manifests as WFC (Greenhaus and Beutell, Reference Greenhaus and Beutell1985). WFC can occur when professional responsibilities impact on family life, while family-to-work conflict (FWC) arises when domestic and family obligations hinder work performance (Greenhaus and Beutell, Reference Greenhaus and Beutell1985; Frone et al., Reference Frone, Russell and Cooper1992). Both forms of conflict can precipitate stress, diminish overall well-being and reduce satisfaction in both work and family life (Frone et al., Reference Frone, Russell and Cooper1992; Byron, Reference Byron2005). The bidirectional nature of WFC underscores the complex interplay between these two fundamental aspects of life, and the need to distinguish analytically between the two dimensions of WFC (Byron, Reference Byron2005).
Role strain theory elucidates how societal expectations of gender mould parental roles, allocating distinct responsibilities and exerting substantial pressure on individuals to conform to these culturally prescribed norms (Goode, Reference Goode1960). Historically, fathers were viewed as breadwinners, their parental duties intrinsically linked to their capacity to financially support their families through paid work (Churchill and Craig, Reference Churchill and Craig2022). In contrast, mothers were traditionally cast as homemakers and primary caregivers, often disconnected from formal employment roles (Goode, Reference Goode1960). This historical context partially explains why, despite the significant increase in maternal employment in Australia, reaching 72% by 2021, the distribution between full-time (35%) and part-time (37%) work among women is similar (Organisation for Economic Co-operation and Development, 2022). Moreover, women continue to predominantly shoulder the responsibility of primary caregiver, allocating more time to familial duties compared to their male counterparts (Ruppanner et al., Reference Ruppanner, Perales and Baxter2018). Gender-driven imbalances continue to exist in the fluidity between work and home life domains: it is generally more socially acceptable for family obligations to encroach upon women’s work lives, potentially resulting in higher levels of WFC for women. Conversely, men may experience greater FWC due to societal expectations prioritising their professional commitments over family responsibilities (Ford et al., Reference Ford, Heinen and Langkamer2007; Ervin et al., Reference Ervin, Taouk, Hewitt and King2023).
Mental health conditions are increasingly prevalent in Australia. Recent data indicate that approximately 22% of adults have experienced a mental disorder in the preceding 12 months, and an estimated 43% have experienced a mental illness at some point in their lifetime. The prevalence of depression and anxiety is highest among younger adults (15–34 years), and trends suggest increasing levels of psychological distress, particularly since the onset of the COVID-19 pandemic (Australian Institute of Health and Welfare, 2025). Parents represent a subgroup facing distinct mental health challenges associated with caregiving responsibilities, financial pressures and work–family demands. Such pressures also exist within a broader social context that has seen an increase in two-income families, meaning more and more families are juggling work and care responsibilities. Findings from a survey of 2,555 Australian parents with children aged 4–14 years show that more than 70% report moderate to very high levels of psychological distress (Tapp et al., Reference Tapp, Gandy, Fogliati, Karin, Fogliati, Newall, McLellan, Titov and Dear2018). Longitudinal research further indicates that mental health outcomes among Australian parents deteriorated during and following the COVID-19 pandemic, with levels of anxiety and depression remaining approximately 30–35% higher than pre-pandemic levels in 2023 (Capic et al., Reference Capic, Youssef, Lycett, Fuller-tyszkiewicz, Khor, Frykberg, Crowe, Teague, Olsson, Cummins and Hutchinson2026).
Employed parents comprise around two-fifths of the Australian labour force, with parents residing in couple households, the most common household type in Australia (Australian Bureau of Statistics, 2024). The competing demands of work and family, including childcare responsibilities, exert differential time pressures on women and men. Although the number of hours women work has increased in many Organisation for Economic Co-operation and Development (OECD) countries, this shift has not been accompanied by a proportional decrease in their caregiving responsibilities and household labour (Charlesworth et al., Reference Charlesworth, Strazdins, O’brien and Sims2011; Rose et al., Reference Rose, Hewitt and Baxter2013). Balancing these often competing and conflicting demands of work and family places significant pressure on women (Pocock et al., Reference Pocock, Charlesworth and Chapman2013; Rose et al., Reference Rose, Hewitt and Baxter2013), with mothers frequently reporting more WFC than fathers (Hokke et al., Reference Hokke, Mason, Crawford, Cooklin, Giallo and Bennetts2024). WFC is prevalent among parents, with one-third of Australian mothers and fathers reporting experiencing WFC (Strazdins et al., Reference Strazdins, Obrien, Lucas and Rodgers2013).
There is evidence that WFC is adversely associated with mental health, including anxiety and depression (Chandola et al., Reference Chandola, Martikainen, Bartley, Lahelma, Marmot, Michikazu, Nasermoaddeli and Kagamimori2004; Leineweber et al., Reference Leineweber, Baltzer, Magnusson Hanson and Westerlund2013; Cooklin et al., Reference Cooklin, Dinh, Strazdins, Westrupp, Leach and Nicholson2016; Wang et al., Reference Wang, Butterworth, Cooklin, Strazdins and Leach2024). Among parents, mothers and fathers who have never experienced WFC have the most optimal mental health scores and experience the fewest symptoms of mental health disorders (Cooklin et al., Reference Cooklin, Dinh, Strazdins, Westrupp, Leach and Nicholson2016). Mental disorders are considerably gendered; while females experience higher rates of depression and anxiety than males, men have higher rates of externalising disorders than women (Seedat et al., Reference Seedat, Scott, Angermeyer, Berglund, Bromet, Brugha, Demyttenaere, de Girolamo, Haro, Jin, Karam, Kovess-masfety, Levinson, Medina Mora, Ono, Ormel, Pennell, Posada-villa, Sampson and Kessler2009; Riecher-Rossler, Reference Riecher-Rossler2017; Ervin et al., Reference Ervin, Taouk, Hewitt and King2023).
Although previous studies have demonstrated an association between WFC and mental health among parents, several important limitations remain. Much of the existing evidence is based on cross-sectional data or conventional longitudinal analyses that do not adequately account for stable individual characteristics that may influence both WFC and mental health. Consequently, observed associations may partly reflect between-person differences rather than changes in mental health associated with changes in WFC within individuals. Additionally, relatively few studies have examined these associations over an extended period using repeated measures of WFC, FWC and mental health. And although gender differences in WFC and mental health have been documented, there is limited evidence on whether the association between WFC and mental health differs between mothers and fathers when individual time-invariant characteristics are controlled for. Given that gender differences are related to WFC, and WFC is associated with mental health, gender differences in the relationships between WFC and mental health must be considered.
The context in Australia is different from that observed in other countries, underscoring the need for research using Australian data. A case in point is that the one-and-a-half-earner model, in which one parent works full-time and the other works part-time, is more prevalent in Australia than elsewhere, largely due to a tax benefit system that incentivises women to work part-time (Charlesworth et al., Reference Charlesworth, Strazdins, O’brien and Sims2011; Cooklin et al., Reference Cooklin, Dinh, Strazdins, Westrupp, Leach and Nicholson2016; King et al., Reference King, Taouk, LaMontagne, Maheen and Kavanagh2021). Also highlighting the need for Australian research on WFC, in Australia, it is becoming increasingly normative for fathers to have greater involvement in childrearing (Hosking and Western, Reference Hosking and Western2008), which may impact experiences of WFC.
In Australia, parents are entitled to up to 12 months of unpaid parental leave, with the option to request an additional 12 months, complemented by the national Paid Parental Leave scheme, which provides income support at the national minimum wage for eligible primary carers and, to a lesser extent, partners (Fair Work Act, 2009 [Cth] s 70). Childcare is predominantly delivered through formal early childhood education and care services (e.g., long day care, family day care and outside school hours care) and, while not universal, it is subsidised through the income-and activity-tested Child Care Subsidy (Baxter et al., Reference Baxter, Hand, Sweid, Bluett-boyd and Price-robertson2014). Despite these provisions, childcare costs, limited availability and the design of leave entitlements continue to shape parental labour force participation and perpetuate gendered patterns of care. Yet, evidence from Australia remains comparatively limited, despite the distinctive Australian employment and family context, including the prevalence of the one-and-a-half-earner household model and changing patterns of fathers’ involvement in childcare.
As work and family dynamics continue to shift, it becomes increasingly important to support individuals’ well-being and create an environment where both genders can succeed in their professional and personal lives; however, evidence is needed to support this. As such, we propose to investigate gender differences in the associations between WFC and mental health among Australian adults aged 18–64 years with parental responsibilities for dependent children younger than 15 years of age.
This study aims to examine the longitudinal associations between WFC and mental health among working parents. Specifically, we investigate whether within-person changes in WFC and FWC are associated with changes in mental health. We hypothesise that increases in WFC and FWC will be associated with declines in mental health. Given prior evidence of gender differences in work–family dynamics, we further examine whether the association between WFC and mental health differs between mothers and fathers. Although the WFC items have been widely used and previously validated (Marshall and Barnett, Reference Marshall and Barnett1993), confirmatory factor analysis (CFA) will be conducted to confirm the expected two-factor structure, WFC and FWC, in our sample. This will enable the verification of WFC and FWC as distinct constructs, supporting their use as separate exposure variables and strengthening the robustness of subsequent analyses on parental mental health.
Methods
Analytic sample
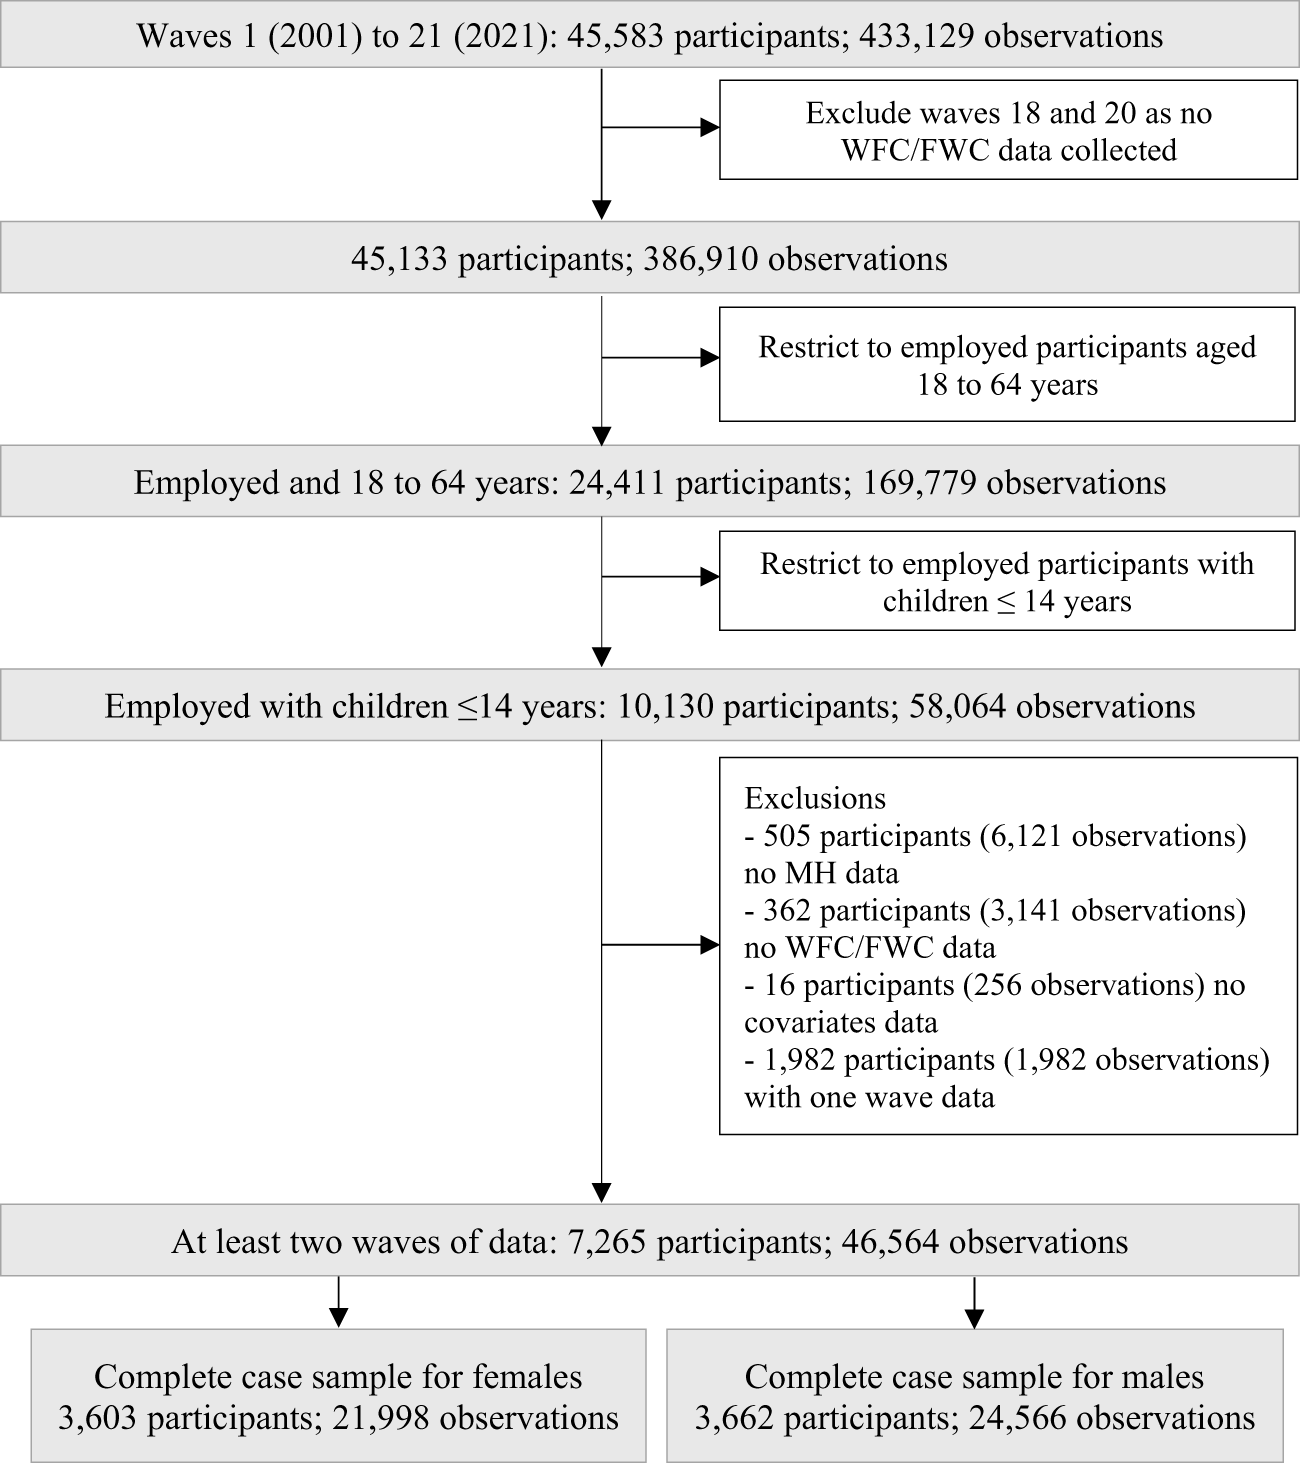
Data from the Household Income and Labour Dynamics in Australia (HILDA) Survey (Wilkins et al., Reference Wilkins, Vera-toscano and Botha2024), across waves 2001 to 2021, were used for the study sample and limited to parents aged 18–64 years in paid employment and with dependent children under 15 years living in the household. A person contributed an observation to the analytic sample only for the waves in which they were, at that wave, aged 18–64, in paid employment, and living with a child aged under 15. Once they turned 65, their youngest child turned 15, or they left paid employment, they were excluded from subsequent waves. Waves 18 and 20 were excluded as no WFC data were collected during these waves. Of the 45,133 participants (386,910 observations) across 19 waves of HILDA, 10,130 were employed parents (58,064 observations) aged 18–64 years with parenting responsibilities for children younger than 15 years. Of these, 883 participants (9,518 observations) had missing data on the outcome (N = 505; n = 6,121), main exposures (N = 362; n = 3,141) or covariates (N = 16; n = 256). A further 1,982 participants (1,982 observations) who did not have data for at least two waves were excluded, given that it would not be feasible to calculate changes in WFC and mental health for them. The final analytic sample across all contributing waves consisted of 7,265 participants (46,564 observations), including 3,603 mothers (21,998 observations) and 3,662 fathers (24,566 observations) (Fig. 1).
Flowchart showing selection of HILDA participants for the analyses.

Figure 1 Long description
The selection process of participants from the Household Income and Labour Dynamics in Australia (HILDA) Survey across waves from 2001 to 2021 is outlined in a flowchart. Initially, there were 45,583 participants and 433,129 observations. Waves 18 and 20 were excluded due to lack of work-family conflict data, resulting in 45,133 participants and 386,910 observations. The next step restricted the sample to employed participants aged 18 to 64 years, reducing the count to 24,411 participants and 169,779 observations. Further restriction to employed participants with children aged 14 years or younger resulted in 10,130 participants and 58,064 observations. Exclusions were made for missing data: 505 participants (6,121 observations) lacked mental health data, 362 participants (3,141 observations) lacked work-family conflict data, 16 participants (256 observations) lacked covariates data and 1,982 participants (1,982 observations) had data for only one wave. The final sample included participants with at least two waves of data, totaling 7,265 participants and 46,564 observations. The complete case sample consisted of 3,603 females with 21,998 observations and 3,662 males with 24,566 observations.
Main exposures
WFC and FWC were assessed using eight items from the Marshall and Barnett work–family strains and gains scales (Marshall and Barnett, Reference Marshall and Barnett1993). Responses to all items were measured on a scale from 1 (strongly disagree) to 7 (strongly agree). Four items were used to calculate a mean WFC score, and four items were used to calculate a mean FWC score. Both measures were analysed as continuous variables, with higher scores indicating greater conflict.
Work-to-family conflict
WFC is measured as the average score of four items evaluating the impact of work on family life. The items include: (i) missing out on home or family activities due to job requirements, (ii) reduced enjoyment and increased pressure in family time because of work, (iii) insufficient time or energy to be the desired kind of parent due to work, and (iv) missing rewarding aspects of parenting because of work. In line with Hosking and Western (Reference Hosking and Western2008), observations with one missing item (0.4%) are assigned the mean of the remaining three items, while cases with more than one missing item are excluded (0.1%). Higher WFC scores reflect greater WFC. The scale demonstrates strong internal consistency, with a Cronbach’s alpha of 0.84.
Family-to-work conflict
The FWC measure evaluates how family responsibilities affect work and is calculated as the average score of the following four items: (i) having to turn down work activities or opportunities due to family requirements, (ii) time spent working is less enjoyable and more pressured because of family responsibilities, (iii) worrying about the children while at work and (iv) thinking about the children interferes with work performance. Observations with one missing item (19.7%) were assigned the mean of the remaining three items, while cases with more than one missing item (0.3%) were excluded. Higher FWC scores indicate greater FWC, and the scale demonstrates a Cronbach’s alpha of 0.64.
Confirmatory factor analysis
A CFA was conducted using a generalised structural equation model, with ordered logistic indicators. The model specified two correlated latent factors, WFC and FWC, each measured by four ordinal items. Latent variable variances were fixed to 1, allowing all factor loadings to be freely estimated and standardised. All indicators loaded significantly on their respective factors (all P < 0.001), with loadings ranging from 1.10 to 2.63. Loadings were particularly strong for WFC items, while FWC indicators showed more variability. The correlation between the two latent factors was high (r = 0.764), indicating a strong association between WFC and FWC dimensions. A likelihood-ratio test comparing the two-factor model to a more parsimonious one-factor model (where all items load onto a single latent factor) showed that the two-factor model provided a significantly better fit to the data, χ2(1) = 6140.99, P < 0.001. This supports the theoretical distinction between WFC and FWC as separate but related dimensions.
Outcome MHI-5 subscale
Our outcome mental health was measured using the five items of the Mental Health Inventory (MHI-5), derived from the Short Form-36 (SF-36) general health questionnaire (Ware, Reference Ware2000). The SF-36 has demonstrated high validity in the Australian context (Butterworth and Crosier, Reference Butterworth and Crosier2004), and the MHI-5 is a validated measure of psychological morbidity (Cuijpers et al., Reference Cuijpers, Smits, Donker, ten Have and de Graaf2009). The MHI-5 evaluates symptoms of anxiety, depression, behavioural-emotional control and positive affect experienced during the previous four weeks. Three items assess nervousness and depression (‘Have you been a very nervous person?’, ‘Have you felt so down in the dumps that nothing could cheer you up?’ and ‘Have you felt downhearted and blue?’) and the other two assess happiness and calmness (‘Have you felt calm and peaceful?’ and ‘Have you been a happy person?’). The score for mental health was calculated by summing the scores of the above five questions and then transforming to a 0–100 scale. The MHI-5 was operationalised as a continuous variable, with higher scores representing better mental health. A cut-off of 52 was used to identify those participants with major depression (Holmes, Reference Holmes1998) at baseline for exclusion from the sensitivity analysis.
Covariates
We controlled for potential confounders of the association between WFC and mental health, all of which were measured at each available wave of the HILDA Survey and included in the fixed-effects models as time-varying covariates. The time-varying covariates included age and sociodemographic factors including marital status (single or married/de facto), number of children younger than 15 years of age in the household (1, 2, 3, and ≥4), occupational skill level (low, medium, and high) (Australian Bureau of Statistics, 2022a), employment arrangement (permanent, casual, fixed term or self-employed) and household disposable income. Household disposable income was equivalised using the modified OECD scale (Hagenaars et al., Reference Hagenaars, de Vos and Zaidi1994). At each wave, nominal household income values were converted to quintiles of the Australian population distribution using percentile statistics for the corresponding financial year (Australian Bureau of Statistics, 2022b). The number of hours per week worked in all jobs, capped at 100 hours per week, was included as a covariate. We also controlled for long-term health conditions, ascertained from one question asking participants if they had experienced a disability or health condition that had lasted, or was likely to last, 6 months or more. As housework and childcare could be construed as part of the WFC exposures as well as potential confounders, analyses included models with and without total housework and childcare hours per week. Childcare (0–120 hours per week) and housework (0–110 hours per week) were capped at the 99.9th percentile. Finally, we adjusted for survey year to account for temporal changes in macro-level socio-economic conditions that may have impacted on the relationship between WFC and mental health. Country of birth (Australia, main English-speaking or other) and educational attainment (no completion of high school, completion of high school, vocational certificate or diploma, or bachelor’s degree and above) were included as additional covariates in the supplementary analyses. The country of birth variable is based on respondents’ self-reported country of birth, which was coded according to standard country classifications and recoded into three mutually exclusive categories: ‘Australia’, ‘other English-speaking’ countries (New Zealand, United Kingdom, Ireland, United States, Canada and South Africa) and ‘other’ countries. This classification follows the Australian Bureau of Statistics (ABS) grouping of main English-speaking countries and is not based on whether English is an official or predominant language in the country of birth (Summerfield et al., Reference Summerfield, Garrard, Kamath, Nesa, Macalalad, Watson and Wilkins2025).
Statistical analyses
This is a fixed-effects panel analysis using up to 19 waves of data per person across 2001–2021, in which both the WFC exposures and MHI-5 outcome, as well as the covariates, are repeatedly measured at every wave a participant contributes, and the estimated coefficient represents the average within-person association between a change in WFC and a change in mental health from one wave to the next. Linear fixed-effects regression models were used to estimate within-person associations, controlling for stable individual characteristics and thereby isolating changes in exposures and outcomes within participants over time. In addition to isolating within-person variations in mental health that are associated with changes in WFC, fixed-effects analyses remove the influence of all time-invariant characteristics of a person, measured or unmeasured, by differencing them out: because each participant serves as their own control, any characteristic that does not change over the observation period, such as personality, attitudes and any other stable trait, cannot confound the within-person association between changes in conflict and changes in mental health. As each individual serves as their own control, exchangeability between exposed and unexposed groups is enhanced (Gunasekara et al., Reference Gunasekara, Richardson, Carter and Blakely2014). The fixed-effects regression models estimate the total within-person effect of changes in WFC and FWC on mental health, capturing all pathways through which these exposures may influence the outcome while controlling for stable individual characteristics. Time-varying covariates were included where appropriate to isolate within-person changes, whereas time-invariant confounders are inherently accounted for through the fixed-effects approach. This approach ensures that the associations reflect within-person changes in WFC and FWC over time, providing a clear interpretation of their total effects on mental health. The total within-person effect of changes in WFC and FWC on mental health (estimand) was estimated using fixed-effects regression models (estimator), with the resulting coefficients representing the expected change in mental health per one-unit change in WFC or FWC (estimates).
We investigated changes in WFC and FWC and associated changes in MHI-5 scores, separately for mothers and fathers because tests of interactions indicated moderate effect modification between FWC, sex and mental health status (P = 0.02). The relationship between changes in WFC exposure variables, covariates and associated changes in mental health outcome is represented in a DAG (Supplementary Fig. 1).
Sensitivity analyses were performed using Mundlak analysis, which introduces group-level averages as additional explanatory variables in random-effects models to assess the extent to which results of fixed-effects analyses might be biased by unobserved heterogeneity (Mundlak, Reference Mundlak1978). In additional sensitivity analyses, participants with poor mental health at baseline MHI-5 ≤ 52 (Holmes, Reference Holmes1998; Wilkins and Lass, Reference Wilkins and Lass2018) were excluded to assess the potential influence of reverse causation between WFC and mental health. As data from wave 2021 aligns with the COVID pandemic restrictions and lockdowns that may have affected both WFC and mental health, further sensitivity analyses were undertaken excluding wave 2021 to check the robustness of results.
All analyses were performed using Stata/SE version 18.0.
Results
Table 1 presents the sample characteristics across all observations stratified by sex. Australian working mothers participated, on average (SD), in 6.1 (3.7) years of HILDA data. Their mean MHI-5 score was 73.9, and mean WFC and FWC scores were 3.6 and 3.2, respectively. The average age was 38.8 years, and most were born in Australia (80.7%), married or in a de facto relationship (84.1%), had at least two children younger than 15 years of age in the household (84.6%), had completed high school (83.3%), were in the middle and high quintiles of disposable income (78.4%) and did not have any long-term health condition or disability (87.5%). While most were employed in middle (42.7%) or high (43.1%) level skilled jobs, only 59.6% of working mothers were permanently employed. Mothers worked on average 28.9 hours per week and spent on average 23.0 hours on childcaring and 22.2 hours on housework.
Distribution of sample characteristics, work–family conflict and Mental Health Inventory-5 scores across pooled observations, stratified by sex

Table 1 Long description
Pooled observations are summarized for females with 21,998 observations, males with 24,566 observations, and a total of 46,564 observations, covering means with standard deviations and counts with percentages. Mean number of HILDA waves was 6.1 for females, 6.7 for males, and 6.4 total; mean age was 38.8 years for females, 39.9 for males, and 39.3 total. Mean work to family conflict was 3.6 for females, 4.0 for males, and 3.8 total; mean family to work conflict was 3.2 for females, 3.1 for males, and 3.2 total; mean Mental Health Inventory 5 score was 73.9 for females, 76.4 for males, and 75.3 total. Country of birth counts and percentages were Australia 17,762 females, 19,291 males, 37,053 total; other English speaking 1,814 females, 2,574 males, 4,388 total; other 2,422 females, 2,701 males, 5,123 total. Married or De facto relationship was 18,505 females, 24,115 males, and 42,620 total. Number of children 14 years or younger in the household was 1 child 9,229 females, 9,173 males, 18,402 total; 2 children 9,381 females, 10,641 males, 20,022 total; 3 children 2,859 females, 3,797 males, 6,656 total; 4 plus 529 females, 955 males, 1,484 total. Educational attainment was no completion of high school 3,680 females, 3,604 males, 7,284 total; completion of high school 3,182 females, 2,738 males, 5,920 total; vocational certificate or diploma 6,498 females, 10,491 males, 16,989 total; bachelors degree and above 8,638 females, 7,733 males, 16,371 total. Occupational skill level was low 3,123 females, 5,067 males, 8,190 total; medium 9,391 females, 8,345 males, 17,736 total; high 9,484 females, 11,154 males, 20,638 total. Employment arrangement was permanent 13,114 females, 16,346 males, 29,460 total; casual 4,283 females, 1,640 males, 5,923 total; fixed term 1,868 females, 1,587 males, 3,455 total; self employed 2,733 females, 4,993 males, 7,726 total. Mean hours per week worked in all jobs was 28.9 for females, 45.4 for males, and 37.58 total; disposable income quintiles were 1 lowest 950 females, 1,064 males, 2,014 total; 2 is 3,809 females, 4,935 males, 8,744 total; 3 is 6,593 females, 6,867 males, 13,460 total; 4 is 6,455 females, 6,819 males, 13,274 total; 5 highest is 4,191 females, 4,881 males, 9,072 total. Long term health condition or disability was 2,757 females, 3,277 males, and 6,034 total. Mean childcare hours per week were 23.0 for females, 12.5 for males, and 17.5 total, and mean housework hours per week were 22.2 for females, 9.9 for males, and 15.7 total; these two measures use only observations with non missing hours.
a Sample estimates based on non-missing childcare hours/week across all observations: females n = 20,608 (93.7%); males n = 23,115 (94.1%); and total n = 43,723 (93.9%).
b Sample estimates based on non-missing housework hours/week across all observations: females n = 20,800 (94.6%); males n = 23,182 (94.4%); and total n = 43,982 (94.5%).
Australian working fathers participated on average (SD) in 6.7 (4.2) years of HILDA data. Their mean MHI-5 score was 76.4, and mean WFC and FWC scores were 4.0 and 3.1, respectively. The average age was 39.9 years, and most were born in Australia (78.5%), had completed high school (85.3%), were in the middle and high quintiles of disposable income (75.6%) and did not have any long-term health condition or disability (86.7%). Almost all working fathers were married or in a de facto relationship (98.2%) and 80.6% of fathers had at least two children younger than 15 years of age in the household. Most working fathers were permanently employed in mostly medium (34.0%) or high (45.4%) level skilled jobs and worked on average 45.4 hours per week. On average per week, they spent 10.8 hours caring for children and 7.8 hours on housework (Table 2). Distribution of characteristics did not vary over time other than for slightly more child-care hours per week observed at baseline for both mothers and fathers.
Distribution of sample characteristics, work–family conflict and Mental Health Inventory-5 scores at baseline (time of study entry) for participants, stratified by sex

Table 2 Long description
Baseline characteristics are reported for females with 3,603 participants, males with 3,662 participants, and the total with 7,265 participants, including conflict scores, mental health, demographics, work, income, health, childcare, and housework. Work to family conflict mean was 3.4 for females, 4.0 for males, and 3.7 total, and family to work conflict mean was 3.4 for females, 3.2 for males, and 3.3 total. Mental Health Inventory 5 mean was 74.1 for females, 77.0 for males, and 75.5 total, and mean age was 34.7 for females, 35.7 for males, and 35.2 total. Country of birth counts and percentages were Australia 2,877 females, 2,826 males, 5,703 total; other English speaking 299 females, 382 males, 681 total; other 427 females, 454 males, 881 total. Married or de facto relationship was 3,089 females, 3,595 males, and 6,684 total. Number of children aged 14 years or younger in the household was 1 child 1,885 females, 2,066 males, 3,951 total; 2 children 1,186 females, 1,074 males, 2,260 total; 3 children 421 females, 392 males, 813 total; 4 or more children 111 females, 130 males, 241 total. Educational attainment was school not completed 731 females, 643 males, 1,374 total; year 12 588 females, 451 males, 1,039 total; diploma or certificate 1,018 females, 1,521 males, 2,539 total; bachelors degree and above 1,266 females, 1,047 males, 2,313 total. Occupational skill level was low 659 females, 837 males, 1,496 total; medium 1,564 females, 1,326 males, 2,890 total; high 1,380 females, 1,499 males, 2,879 total. Employment arrangement was permanent 1,793 females, 2,325 males, 4,118 total; casual 1,076 females, 368 males, 1,444 total; fixed term 297 females, 270 males, 567 total; self employed 437 females, 699 males, 1,136 total. Mean hours per week worked in all jobs was 25.1 for females, 45.1 for males, and 35.2 total; disposable income quintiles were 1 lowest 233 females, 198 males, 431 total; 2 was 710 females, 665 males, 1,375 total; 3 was 1,002 females, 931 males, 1,933 total; 4 was 974 females, 1,013 males, 1,987 total; 5 highest was 684 females, 855 males, 1,539 total. Long term health condition or disability was 382 females, 423 males, and 805 total. Childcare mean hours per week were 32.8 for females, 14.6 for males, and 23.9 total, and housework mean hours per week were 22.0 for females, 9.6 for males, and 15.9 total; these two rows use subsets with non missing observations as indicated by the asterisk markers.
a Sample estimates based on non-missing childcare hours/week baseline observations: females n = 2,554 (70.9%); males n = 2,438 (66.6%); and total n = 4,992 (68.7%).
b Sample estimates based on non-missing housework hours/week baseline observations: females n = 2,585 (71.7%); males n = 2,454 (67.0%); and total n = 5,039 (69.4%).
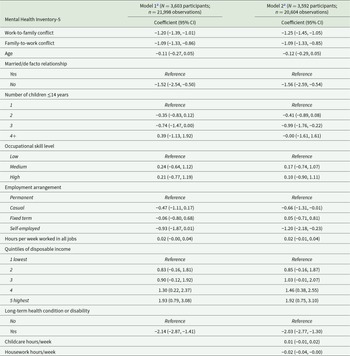
Table 3 presents the results of the fixed effects models for mutually adjusted WFC and FWC and MHI-5 score for mothers. On average, a one unit increase in WFC was associated with 1.25 unit decrease in MHI-5 score (β coefficient = −1.25; 95% CI: −1.45, −1.05) and a one unit increase in FWC was associated with 1.09 unit decrease in MHI-5 score (β coefficient = −1.09; 95% CI: −1.33, −0.85). For fathers, on average, a one unit increase in WFC was associated with 1.21 unit decrease in MHI-5 score (β coefficient = −1.21; 95% CI: −1.40, −1.02) and a one unit increase in FWC was associated with 1.51 unit decrease in MHI-5 (β coefficient = −1.51; 95% CI: −1.75, −0.28) (Table 4). Results for mothers and fathers were essentially unchanged when analyses did not adjust for childcare and housework (Tables 3 and 4).
Fixed effects models examining changes in Mental Health Inventory-5 scores and changes in work–family conflict for females

Table 3 Long description
Mental Health Inventory 5 is the outcome, with coefficients and 95 percent confidence intervals reported for Model 1 and Model 2. Model 1 includes 3,603 participants and 21,998 observations, and Model 2 includes 3,592 participants and 20,604 observations. Work to Family Conflict is minus 1.20 with a 95 percent confidence interval from minus 1.39 to minus 1.01 in Model 1, and minus 1.25 with a 95 percent confidence interval from minus 1.45 to minus 1.05 in Model 2. Family to Work Conflict is minus 1.09 with a 95 percent confidence interval from minus 1.33 to minus 0.86 in Model 1, and minus 1.09 with a 95 percent confidence interval from minus 1.33 to minus 0.85 in Model 2. Age is minus 0.11 with a 95 percent confidence interval from minus 0.27 to 0.05 in Model 1, and minus 0.12 with a 95 percent confidence interval from minus 0.29 to 0.05 in Model 2. For Married or De facto relationship, Yes is the reference, and No is minus 1.52 with a 95 percent confidence interval from minus 2.54 to minus 0.50 in Model 1 and minus 1.56 with a 95 percent confidence interval from minus 2.59 to minus 0.54 in Model 2. For Number of children 14 years or younger, 1 is the reference; in Model 1, 2 is minus 0.35 from minus 0.83 to 0.12, 3 is minus 0.74 from minus 1.47 to 0.00, and 4 plus is 0.39 from minus 1.13 to 1.92, while in Model 2, 2 is minus 0.41 from minus 0.89 to 0.08, 3 is minus 0.99 from minus 1.76 to minus 0.22, and 4 plus is minus 0.00 from minus 1.61 to 1.61. Occupational skill level uses Low as the reference; Medium is 0.24 from minus 0.64 to 1.12 and High is 0.21 from minus 0.77 to 1.19 in Model 1, and Medium is 0.17 from minus 0.74 to 1.07 and High is 0.10 from minus 0.90 to 1.11 in Model 2. Employment arrangement uses Permanent as the reference; in Model 1, Casual is minus 0.47 from minus 1.11 to 0.17, Fixed Term is minus 0.06 from minus 0.80 to 0.68, and Self Employed is minus 0.93 from minus 1.87 to 0.01, while in Model 2, Casual is minus 0.66 from minus 1.31 to minus 0.01, Fixed Term is 0.05 from minus 0.71 to 0.81, and Self Employed is minus 1.20 from minus 2.18 to minus 0.23. Hours per week worked in all jobs is 0.02 from minus 0.00 to 0.04 in Model 1 and 0.02 from minus 0.01 to 0.04 in Model 2. Quintiles of disposable income use 1 lowest as the reference; in Model 1, 2 is 0.83 from minus 0.16 to 1.81, 3 is 0.90 from minus 0.12 to 1.92, 4 is 1.30 from 0.22 to 2.37, and 5 highest is 1.93 from 0.79 to 3.08, while in Model 2, 2 is 0.85 from minus 0.16 to 1.87, 3 is 1.03 from minus 0.01 to 2.07, 4 is 1.46 from 0.38 to 2.55, and 5 highest is 1.92 from 0.75 to 3.10. Long term health condition or disability uses No as the reference, and Yes is minus 2.14 from minus 2.87 to minus 1.41 in Model 1 and minus 2.03 from minus 2.77 to minus 1.30 in Model 2. Only Model 2 includes Childcare hours per week at 0.01 from minus 0.01 to 0.02 and Housework hours per week at minus 0.02 from minus 0.04 to minus 0.00.
a Models adjusted for time-varying covariates measured at every wave of the HILDA Survey.
Fixed effects models examining changes in Mental Health Inventory-5 scores and changes in work–family conflict for males

Table 4 Long description
Mental Health Inventory 5 is the outcome, with coefficients and 95 percent confidence intervals reported for Model 1 and Model 2. Model 1 includes 3,662 participants and 24,566 observations, and Model 2 includes 3,657 participants and 23,054 observations. Work to Family Conflict is minus 1.20 with a 95 percent confidence interval from minus 1.38 to minus 1.01 in Model 1, and minus 1.21 with a 95 percent confidence interval from minus 1.40 to minus 1.02 in Model 2. Family to Work Conflict is minus 1.48 with a 95 percent confidence interval from minus 1.71 to minus 1.25 in Model 1, and minus 1.51 with a 95 percent confidence interval from minus 1.75 to minus 1.28 in Model 2. Age is minus 0.30 with a 95 percent confidence interval from minus 0.44 to minus 0.15 in Model 1, and minus 0.31 with a 95 percent confidence interval from minus 0.46 to minus 0.16 in Model 2. Reference categories are, Married or De facto relationship, Yes; Number of children 14 years or younger, 1; Occupational skill level, Low; Employment arrangement, Permanent; Quintiles of disposable income, 1 lowest; and Long term health condition or disability, No. For Married or De facto relationship, No is minus 2.28 with a 95 percent confidence interval from minus 4.51 to minus 0.06 in Model 1, and minus 2.10 with a 95 percent confidence interval from minus 4.52 to 0.31 in Model 2. For Number of children 14 years or younger, 2 is minus 0.59 with a 95 percent confidence interval from minus 0.99 to minus 0.18 in Model 1 and minus 0.58 with a 95 percent confidence interval from minus 0.99 to minus 0.16 in Model 2; 3 is minus 0.45 with a 95 percent confidence interval from minus 1.08 to 0.18 in Model 1 and minus 0.38 with a 95 percent confidence interval from minus 1.02 to 0.27 in Model 2; 4 plus is minus 0.03 with a 95 percent confidence interval from minus 1.17 to 1.11 in Model 1 and minus 0.11 with a 95 percent confidence interval from minus 1.34 to 1.13 in Model 2. Occupational skill level shows Medium at minus 0.00 with a 95 percent confidence interval from minus 0.65 to 0.65 in Model 1 and minus 0.05 with a 95 percent confidence interval from minus 0.74 to 0.64 in Model 2, and High at minus 0.00 with a 95 percent confidence interval from minus 0.72 to 0.72 in Model 1 and 0.07 with a 95 percent confidence interval from minus 0.68 to 0.83 in Model 2. Employment arrangement shows Casual at minus 0.19 with a 95 percent confidence interval from minus 1.00 to 0.62 in Model 1 and 0.05 with a 95 percent confidence interval from minus 0.78 to 0.88 in Model 2; Fixed Term at minus 0.68 with a 95 percent confidence interval from minus 1.36 to minus 0.01 in Model 1 and minus 0.65 with a 95 percent confidence interval from minus 1.35 to 0.04 in Model 2; Self Employed at minus 0.05 with a 95 percent confidence interval from minus 0.77 to 0.66 in Model 1 and minus 0.15 with a 95 percent confidence interval from minus 0.92 to 0.61 in Model 2. Hours per week worked in all jobs is 0.02 with a 95 percent confidence interval from 0.00 to 0.05 in Model 1 and 0.03 with a 95 percent confidence interval from 0.00 to 0.05 in Model 2. Quintiles of disposable income show 2 at 0.16 with a 95 percent confidence interval from minus 0.74 to 1.06 in Model 1 and 0.15 with a 95 percent confidence interval from minus 0.78 to 1.08 in Model 2; 3 at 0.42 with a 95 percent confidence interval from minus 0.51 to 1.35 in Model 1 and 0.41 with a 95 percent confidence interval from minus 0.55 to 1.37 in Model 2; 4 at 0.62 with a 95 percent confidence interval from minus 0.35 to 1.58 in Model 1 and 0.63 with a 95 percent confidence interval from minus 0.37 to 1.63 in Model 2; and 5 highest at 0.78 with a 95 percent confidence interval from minus 0.26 to 1.81 in Model 1 and 0.76 with a 95 percent confidence interval from minus 0.32 to 1.83 in Model 2. Long term health condition or disability, Yes is minus 1.97 with a 95 percent confidence interval from minus 2.56 to minus 1.38 in Model 1 and minus 1.97 with a 95 percent confidence interval from minus 2.57 to minus 1.37 in Model 2. Only Model 2 includes Childcare hours per week at 0.01 with a 95 percent confidence interval from minus 0.01 to 0.03, and Housework hours per week at minus 0.06 with a 95 percent confidence interval from minus 0.09 to minus 0.03.
a Models adjusted for time-varying covariates measured at every wave of the HILDA Survey.
Results of the Mundlak analyses are presented in the supplementary material (Supplementary Table 1 and Supplementary Table 2). Within-person estimates were uniformly similar to the fixed effects results for both mothers and fathers. Between-person estimates were of slightly greater magnitude than the within-person estimates; nevertheless, associations were significant for WFC and FWC and MHI-5 for both mothers and fathers across the hybrid models. Excluding participants with poor mental health status at baseline from the analyses only slightly attenuated results (Supplementary Table 3). Results for mothers and fathers were essentially unchanged when the COVID-related wave 21 data were omitted from the analyses (Supplementary Table 4).
Discussion
Results consistently demonstrated adverse associations between WFC and mental health in both mothers and fathers for both dimensions of WFC. As hypothesised, increases in both dimensions of conflict, WFC and FWC, were associated with declines in mental health status. CFA indicated that WFC and FWC are distinct yet related constructs, supporting their inclusion in the models as separate exposure variables. FWC showed greater variability than WFC. This may reflect the more heterogeneous nature of the FWC items, as turning down work opportunities, worry about family and distraction at work capture somewhat different aspects of family-to-work spillover. The lower internal consistency observed for FWC (Cronbach’s α = 0.64, compared with 0.84 for WFC) provides some support for this interpretation. As this study represents the first validation of these measures in the HILDA context, further research is needed to determine whether the greater variability in FWC reflects substantive differences in family-to-work experiences or differences in the measurement properties of the items.
No substantial gender differences were observed in the associations between WFC and mental health among parents. For both mothers and fathers, WFC was inversely associated with mental health. While similar associations for WFC and MHI-5 were observed in both sexes, the association between FWC and MHI-5 was of slightly greater magnitude in working fathers. Though the associations were small to moderate, the results are of substantial significance given that in Australia almost three-quarters (73%) of the 2.2 million couple families with children aged 0–14 years have two employed parents and of the 741,000 one-parent families with dependants, 68% of single mothers and 75% of single fathers are working parents (Australian Bureau of Statistics, 2024).
The Mundlak sensitivity analyses confirmed the fixed effects results, with the within-person estimates closely matching the fixed effects findings for both mothers and fathers. Similarly, the between-person estimates corresponded to the within-person estimates, albeit with slightly greater magnitudes. While some individual-level characteristics may explain differences in the outcome rather than fluctuations within individuals over time, it is more likely that unmeasured confounding contributes to the between-person estimates. Not accounting for such confounding will thus lead to an overestimation of the detrimental effects of WFC on parents, underscoring the value of using fixed effects methods in this study.
Interestingly, models that adjusted for childcare and housework produced results similar to unadjusted models, suggesting that these aspects of domestic workload may not independently alter the associations between WFC and mental health. This may reflect mediation, in which the effects of WFC and FWC on mental health operate through other pathways, or attenuation due to measurement error in self-reported domestic labour. Collinearity among domestic workload variables may also limit the independent contribution of childcare and housework in the models.
Our results contrasted with those from a recent study of Swedish workers conducted by the same authors, where associations between WFC and FWC and depressive symptoms were consistently stronger, with a demonstrable stepwise relationship between childcaring intensity and depressive symptoms among female workers compared to male workers (Taouk et al., Reference Taouk, King, Leineweber, Churchill, Ruppanner and Hanson2025). Of note, though, Swedish women’s participation in the labour force is nearly on par with that of men and their employment is typically full-time (Organisation for Economic Co-operation and Development, 2024). In contrast, this study observed that increased WFC is equally detrimental to both the mental health of both mothers and fathers. Interestingly, this finding counters the expectation that fathers strongly link their breadwinning role to their parental obligations (Churchill and Craig, Reference Churchill and Craig2022). However, greater FWC is associated with worse mental health among fathers. This gender difference may be explained in part by gender norms around maternal employment which emphasise the male breadwinner model, where women are primary carers and secondary earners (Laß and Wooden, Reference Laß and Wooden2022). This, in combination with the relatively high childcare costs in Australia compared to other OECD countries (Organisation for Economic Cooperation and Development, 2020), means that mothers with partners may be channelled into lower-quality part-time work as part of a split-parenting strategy to supplement household income while avoiding childcare costs and reducing WFC. It is also possible that the associations observed for both men and women reflect a normative clash. That is, the shifting expectations of fathers seeking greater involvement in their children’s lives, mothers seeking and enjoying greater employment opportunities and both mothers and fathers seeking a more equitable distribution of domestic labour are butting against a labour market structure and set of norms that have not fully adapted to meet these evolving social norms.
Our results align with the findings of other studies that have explored the relationship between WFC and mental health. Although previous studies addressed broader outcomes or focused on highly specific groups, it is likely that the findings from this study could still be meaningfully compared to other relevant research, even if measures of WFC differ. Our results were consistent with Frone’s (Reference Frone2000) observation that FWC has a stronger effect on men’s mental health (Frone, Reference Frone2000). In a recent study of mostly male manufacturing workers in Bahrain, WFC was found to have a negative effect on psychological well-being (Obrenovic et al., Reference Obrenovic, Jianguo, Khudaykulov and Khan2020). An Australian longitudinal analysis found that when fathers moved into high WFC, from one wave to the next, their mental health deteriorated, and those who reported persistent high WFC over two waves reported the highest psychological distress (Cooklin et al., Reference Cooklin, Dinh, Strazdins, Westrupp, Leach and Nicholson2016). A longitudinal study examined work-to-home- and home-to-work-interference and depressive complaints among predominantly male Dutch employees and observed a reciprocal association between home-to-work interference and depressive complaints, but not for work-to-home interference and depressive complaints (Magnusson Hanson et al., Reference Magnusson Hanson, Leineweber, Chungkham and Westerlund2014; Bergs et al., Reference Bergs, Hoofs, Kant, Slangen and Jansen2018).
Strengths and limitations
Key strengths include the use of HILDA, which allowed for robust longitudinal analysis, and fixed-effects regression. The fixed-effects regression enabled each person to act as their own control in assessing the association between changes in WFC and changes in MHI-5 scores, controlling for time-invariant confounders and mitigating bias due to confounding. Our measure of mental health, the MHI-5, while self-reported, is a reliable and validated measure of mental health. It has been widely used in research and clinical settings to assess psychological distress and general mental health (Ten Have et al., Reference Ten Have, Van Bon-martens, Schouten, Van Dorsselaer, Shields-zeeman and Luik2024). All models were mutually adjusted for the two correlated but distinct dimensions of WFC, which were validated as separate constructs through CFA, thereby enhancing the robustness of the results. The use of self-reported measures may have introduced common method bias, potentially leading to spurious or inflated associations (Bonde, Reference Bonde2008). However, this is unlikely to be a significant concern, as within-person fixed effects analyses help mitigate common method bias by treating each person as their own case and control, and moreover, WFC is associated with both self-reported and objective measures of health (Frone et al., Reference Frone, Russell and Cooper1997). Furthermore, measured time-invariant characteristics such as sex as well as unmeasured stable factors like personality and temperament, which may increase common method bias, were stratified or controlled for in the analyses.
Despite the use of fixed effects, we cannot make any strong claims to causality. Most obviously, there may be unobservable time-varying factors that simultaneously influence parents’ reports of WFC and their mental health. This problem is inherent to studies based on observational data. In particular, WFC and mental health may have been influenced by the COVID pandemic; however, excluding wave 21 did not alter the main findings. Moreover, we cannot rule out reverse causation. Although high levels of WFC may adversely affect mental health, reverse causation is also plausible whereby poor mental health exacerbates difficulties in meeting work or family demands. However, sensitivity analyses excluding participants with poor baseline mental health yielded only slightly attenuated estimates, suggesting that reverse causation is unlikely to fully account for the observed associations. Information on pregnancy status and the health status of children in the household were not available, and residual confounding by pregnancy status and children’s health status may have influenced the observed associations. Missingness due to attrition and item non-response, potentially higher among parents experiencing greater WFC or related mental health challenges, may have led to a more advantaged analytic sample and thus likely biased our estimates towards underestimating the true associations. As the WFC items in the HILDA Survey were administered only to employed parents, the generalisability of our findings is limited to Australian workers with parental responsibilities. Thus, further research is warranted to examine the relationship between WFC and mental health among working couples without children, as well as other groups with WFC such as informal caregivers.
Conclusions
WFC was consistently associated with poorer mental health among both mothers and fathers, with no substantial gender differences overall. Both WFC and FWC emerged as distinct yet related dimensions, each independently associated with declines in mental health. While associations were broadly similar across genders, FWC showed a slightly stronger relationship with mental health among fathers. Overall, these findings underscore the negative impact of WFC on the well-being of working parents and highlight the importance of both work and family roles, and the balance between them, for parents’ mental health. This has important policy implications. Greater efforts are needed to identify and implement strategies that help parents cope with, or reduce exposure to, both forms of WFC. Achieving this requires thoughtful work-life balance strategies and family support policies that reflect the changing nature of gender roles at work and at home. Given that FWC appears to have a comparable impact on the mental health of both mothers and fathers, employers should recognise FWC as a significant source of stress for all employees, with potential consequences for health care costs and workplace productivity. It is also likely that many family-supportive programmes or coping strategies primarily address only one type of WFC. To promote economic equality between men and women, a key strategy in Australia would be to encourage shared responsibilities in both paid and unpaid work between mothers and fathers, while also improving access to high-quality childcare.
Supplementary material
The supplementary material for this article can be found at https://doi.org/10.1017/S204579602610105X.
Availability of data and materials
The data that support the findings of this study are not publicly available due to the conditions of data access from the data custodians (the Australian Data Archive). Interested individuals can apply to the Australian Data Archive for access at https://dataverse.ada.edu.au/dataverse/DSSLongitudinalStudies.
Author contributions
Y.T. conceived and designed the study. Y.T. accessed and verified the data and conducted the data analysis. All authors had full access to the data in the study. All authors interpreted the results. Y.T. wrote the manuscript and compiled all tables and figures. All authors contributed to drafts, approved the final version and were responsible for the decision to submit the manuscript for publication.
Financial support
The study was supported by a Work Futures Hallmark Research Initiative grant from the University of Melbourne. The researchers carried out all work regarding study design, data collection, analysis and interpretation, as well as manuscript writing and submission for publication, independently. The funder had no involvement in any of these processes.
Competing interests
The authors declare no competing interests.
Ethical standards
The use of Hilda survey data for research purposes is approved and administered by the Melbourne Institute of Applied Economic and Social Research at the University of Melbourne, which manages the Hilda Survey. Researchers must apply through the Australian Government Department of Social Services Longitudinal Studies Dataverse https://dataverse.ada.edu.au/dataverse/DSSLongitudinalStudies, the data custodian, for access to the Hilda datafiles. Applications are reviewed to ensure they meet ethical, legal and confidentiality requirements. Access to the Hilda datafiles for use in this study has been approved by the data custodians (approval reference number 633987).




 Open access

