Introduction
Muscle and bone have been considered as a functional unit, and during embryonal development, muscles exert forces on bone to create a mechanically optimal bone shape, which is able to resist deformation later in life.Reference Maurel, Jähn and Lara-Castillo1 These tissues develop together early in life, grow in parallel until reaching their peaks around the age of 25 years.Reference Maurel, Jähn and Lara-Castillo1 Peaks and integrity of the musculoskeletal unit are essential to minimize complications of aging, such as osteoporosis, sarcopenia, or the combination named osteosarcopenia.Reference Sayer, Robinson, Patel, Shavlakadze, Cooper and Grounds2,Reference Hirschfeld, Kinsella and Duque3 Since these long-term complications are associated with disability and increased mortality,Reference Nielsen, Abdulla, Andersen, Schwarz and Suetta4 it is crucial to be aware of risk factors to maintain muscle and bone mass during the life course.Reference Sayer, Robinson, Patel, Shavlakadze, Cooper and Grounds2 Underlying pathways of these conditions are knownReference Curtis, Litwic, Cooper and Dennison5 but do not fully explain the occurrence of diseases. The search for factors in early stages of life could potentially contribute to prevent the muscle–bone unit deterioration.
Based on the developmental origins of health and disease (DOHaD), insults occurring in the early stages of development could induce epigenetic changes in the fetus and predispose to chronic diseases in adulthood.Reference Barker, Winter, Osmond, Margetts and Simmonds6–Reference Gluckmann and Hanson8 Birth weight (BW) has been considered a proxy of the quality of the intrauterine life.Reference Barker, Eriksson, Forsen and Osmond7 During the intrauterine development of the muscle–bone unit, epigenetic modifications can alter gene expression and permanently set pathways linked to musculoskeletal diseases.Reference Dodds, Denison and Ntani9 Intergenerational epidemiology investigates how epigenetic modifications can be transmitted to the following generations.Reference Horta, Gigante, Osmond, Barros and Victora10 In this context, our group is conducting Nutritionist Health Study (NutriHS), whose design allows testing of early life with various outcomes, including those related to muscle and bone status.
More commonly, studies that examined associations of BW with muscle performance have been conducted in midlife and advanced age.Reference Horta, Gigante, Osmond, Barros and Victora10,Reference Sayer, Syddall, Gilbody, Dennison and Cooper11 Positive association of BW with grip strength was found in middle-aged adults,Reference Horta, Gigante, Osmond, Barros and Victora10 as well as negative association of BW with sarcopenia in elders.Reference Sayer, Syddall, Gilbody, Dennison and Cooper11 In a Brazilian birth cohort, BW was associated with grip strength in adulthoodReference Bielemann, Gigante and Horta12 and predicted bone mass at 18 years of age.Reference Gonçalves, Assunção and Wehrmeister13 Other investigators have confirmed such association in young women.Reference Callréus, McGuigan and Åkesson14 While demonstrating a deleterious impact of low BW, these findings also indicate that changes in muscle and bone compartments should occur as a continuous process during the life course. Therefore, improving detection of risk factors before functional deterioration of muscle–bone unit could prevent disabilities later in life.
As far as we know, in healthy young adults, no study has explored the association of early life events using accurate parameters of muscle and bone compartments concomitantly, aiming at early prevention of osteosarcopenia. Dual energy X-ray absorptiometry (DXA) is a noninvasive technique that provides precise measurements of all body compartments.Reference Cawthon15 Since this procedure was available in the NutriHS, the present study aimed to examining whether BW of participants was associated with DXA-determined muscle and bone parameters at the beginning of adulthood.
Materials and methods
Study design, setting, and participants
Current analyses were performed using baseline data of the NutriHS conducted in undergraduates and graduates from Nutrition courses in São Paulo State, Brazil. Details on its purposes and methodological aspects were previously reported.Reference Folchetti and Ferreira16 It was approved by institutional ethics committee and participants signed the informed consent electronically, using the NutriHS website (http://www.fsp.usp.br/nutrihs/index.html).
Recruitment and data collection of the NutriHS occurred from 2015 to 2018. Participants of both sexes answered online structured questionnaires regarding sociodemographic data, family history, early life events, lifestyle, current diet, and clinical data.Reference Folchetti and Ferreira16,Reference Eshriqui, Folchetti, Valente, de Almeida-Pititto and Ferreira17 Further, a convenience sample of the first 200 healthy participants (extra 10% to compensate losses) was invited to visit the health care center of the School of Public Health of the University of São Paulo for clinical examination, biological samples collections, and to undergo muscle performance tests and DXA.
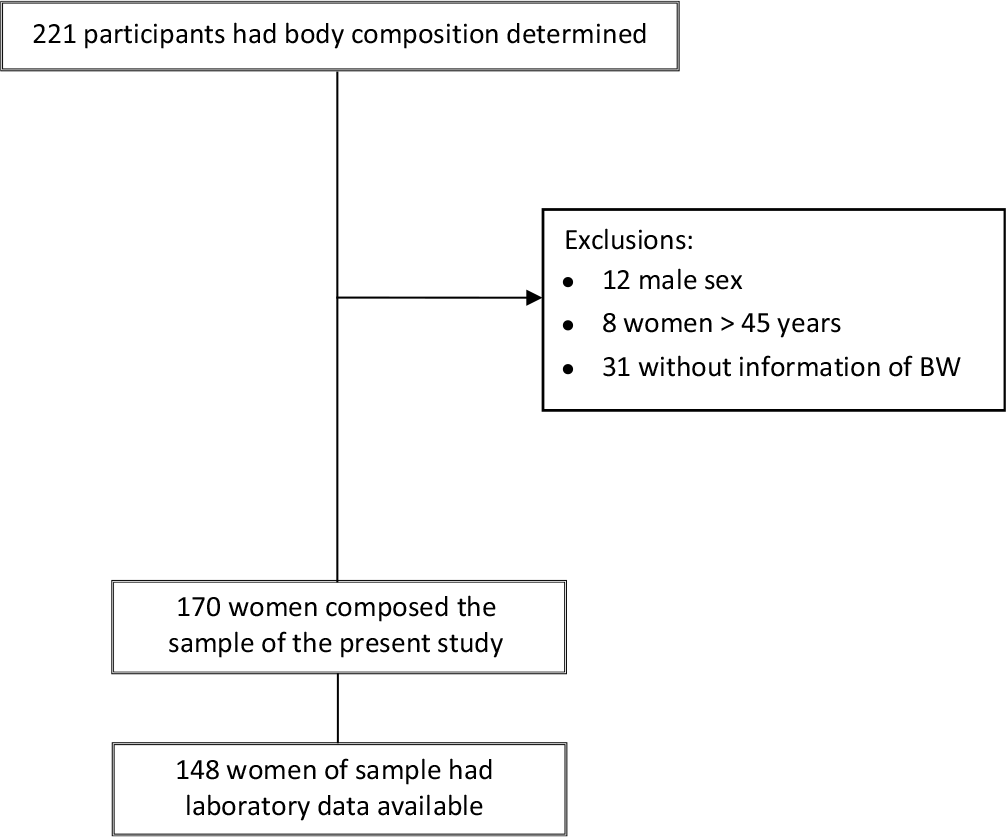
Eligibility criteria for this NutriHS sub-study were nonpregnant women aged 20–45 years and regular menstruation; without past or current history of weight changes >5% of total body weight in the last year, malignancy, use of medications (except contraceptive), elevated blood pressure, or disturbances of glucose and lipid metabolism; normal BW (≥2500 g and <4000 g); no prematurity or twinning and anthropometric measures attending the limits of the densitometer (height of 1.87 m and/or weight of 201 kg). Exclusion criteria were lack of information about BW, male sex, and women >45 years. A total of 221 NutriHS participants had body composition determined, 51 were excluded [lack of information about BW (n = 31), male (n = 12), and women >45 years (n = 8)], and 170 composed the sample for the present analysis. However, complete laboratory data were available for a subsample of 148 participants for financial reasons (Fig. 1).
Flowchart of NutriHS participants in the present study.

The present study had a mixed design: it was considered a retrospective cohort once the main exposure, BW, was recovered from questionnaires, as well as a cross-sectional study when associations with outcomes were tested. Outcomes were muscle and bone parameters.
Variables
BW and maternal characteristics (education level, prepregnancy body mass index (BMI), and gestational data) were obtained from participants and their mothers and also by birth cards consultation when available.
Clinical measurements
Weight was measured with digital scale to the nearest 0.1 kg, height with a fixed stadiometer with 0.1 cm precision, and BMI was calculated. Calf circumference (CC) was taken at the mid-calf point with the participant in the orthostatic position. Blood pressure was obtained three times, in sitting position after 5-min rest, using an automatic device (Omron model HEM-712C; Omron Healthcare Inc., Bannockburn, IL, USA). Values considered for analyses were the mean of the last two measurements.
Muscle parameters
Muscle strength was assessed by the palmar grip strengthReference Fess and Casanova18 using a Jamar® hydraulic hand dynamometer (Patterson Medical, Warrenville, IL, USA). Participant should sit with erect spine, maintaining the bend angle of the knee at 90° and feet resting on the floor, the shoulder positioned in adduction and neutral rotation and the elbow flexed at 90°. The dominant arm was held suspended with the hand positioned on the dynamometer adjusted in the second position. Participant was instructed to tighten the dynamometer with the highest possible force for 3 s and then to release; the result was read out. Measurements were made in duplicate and the mean value was considered. The chair-stand test was used to evaluate leg strength. A straight-backed chair with a solid seat was used. Participant was asked to sit with arms crossed over the chest, and the time to get up and sit, as fast as possible, five times, was measured.Reference Bohannon19 Muscle performance was assessed by gait speed test in which the participant was instructed to walk at normal pace on a 4-m course. Results were provided in meters per second.Reference Cruz-Jentoft, Baeyens and Bauer20
DXA-derived measurements
The equipment GE Lunar iDXA with EnCore software (Madison, WI, USA) was used to measure bone mineral density (BMD) and bone mineral content (BMC) of total body, lumbar spine, femoral neck, and total femur, as well as lean mass of arms and legs, whose sum corresponded to the appendicular skeletal muscle mass (ASM). The ASM index (ASMI) was calculated dividing the ASM by squared height in meters. Regions of interest were determined manually according to the manufacturer specifications and calibrations performed routinely. Bone densitometry and body composition scans were performed by the same researcher, certified by the Brazilian Association of Bone and Osteometabolism. Precision values and least significant change (LSC) were calculated according to the International Society for Clinical Densitometry (http://www.iscd.org) after three successive measurements in 15 women. LSC of bone densitometry scans for lumbar spine, total femur, and femoral neck BMD were, respectively, 0.027, 0.017, and 0.056 g/cm2. Precision values of body composition were total body BMD 0.009 g/cm2, total lean mass 275 g, and ASM 350 g.
Laboratory determinations
Blood samples were obtained after overnight fasting for biochemical and hormone determinations. Plasma glucose was determined by the glucose oxidase method and insulin by immunofluorimetric assay (Monobind, Inc., Lake Forest, CA, USA). Lipid profile was analyzed using enzymatic colorimetric method and LDL-c was calculated by the Friedwald equation. 25-hydroxyvitam D levels were measured by electrochemiluminescence assay on Elecsys analyzers and Cobas modular platforms (Roche® Diagnostics, Indianapolis, IN, USA).
Statistical analysis
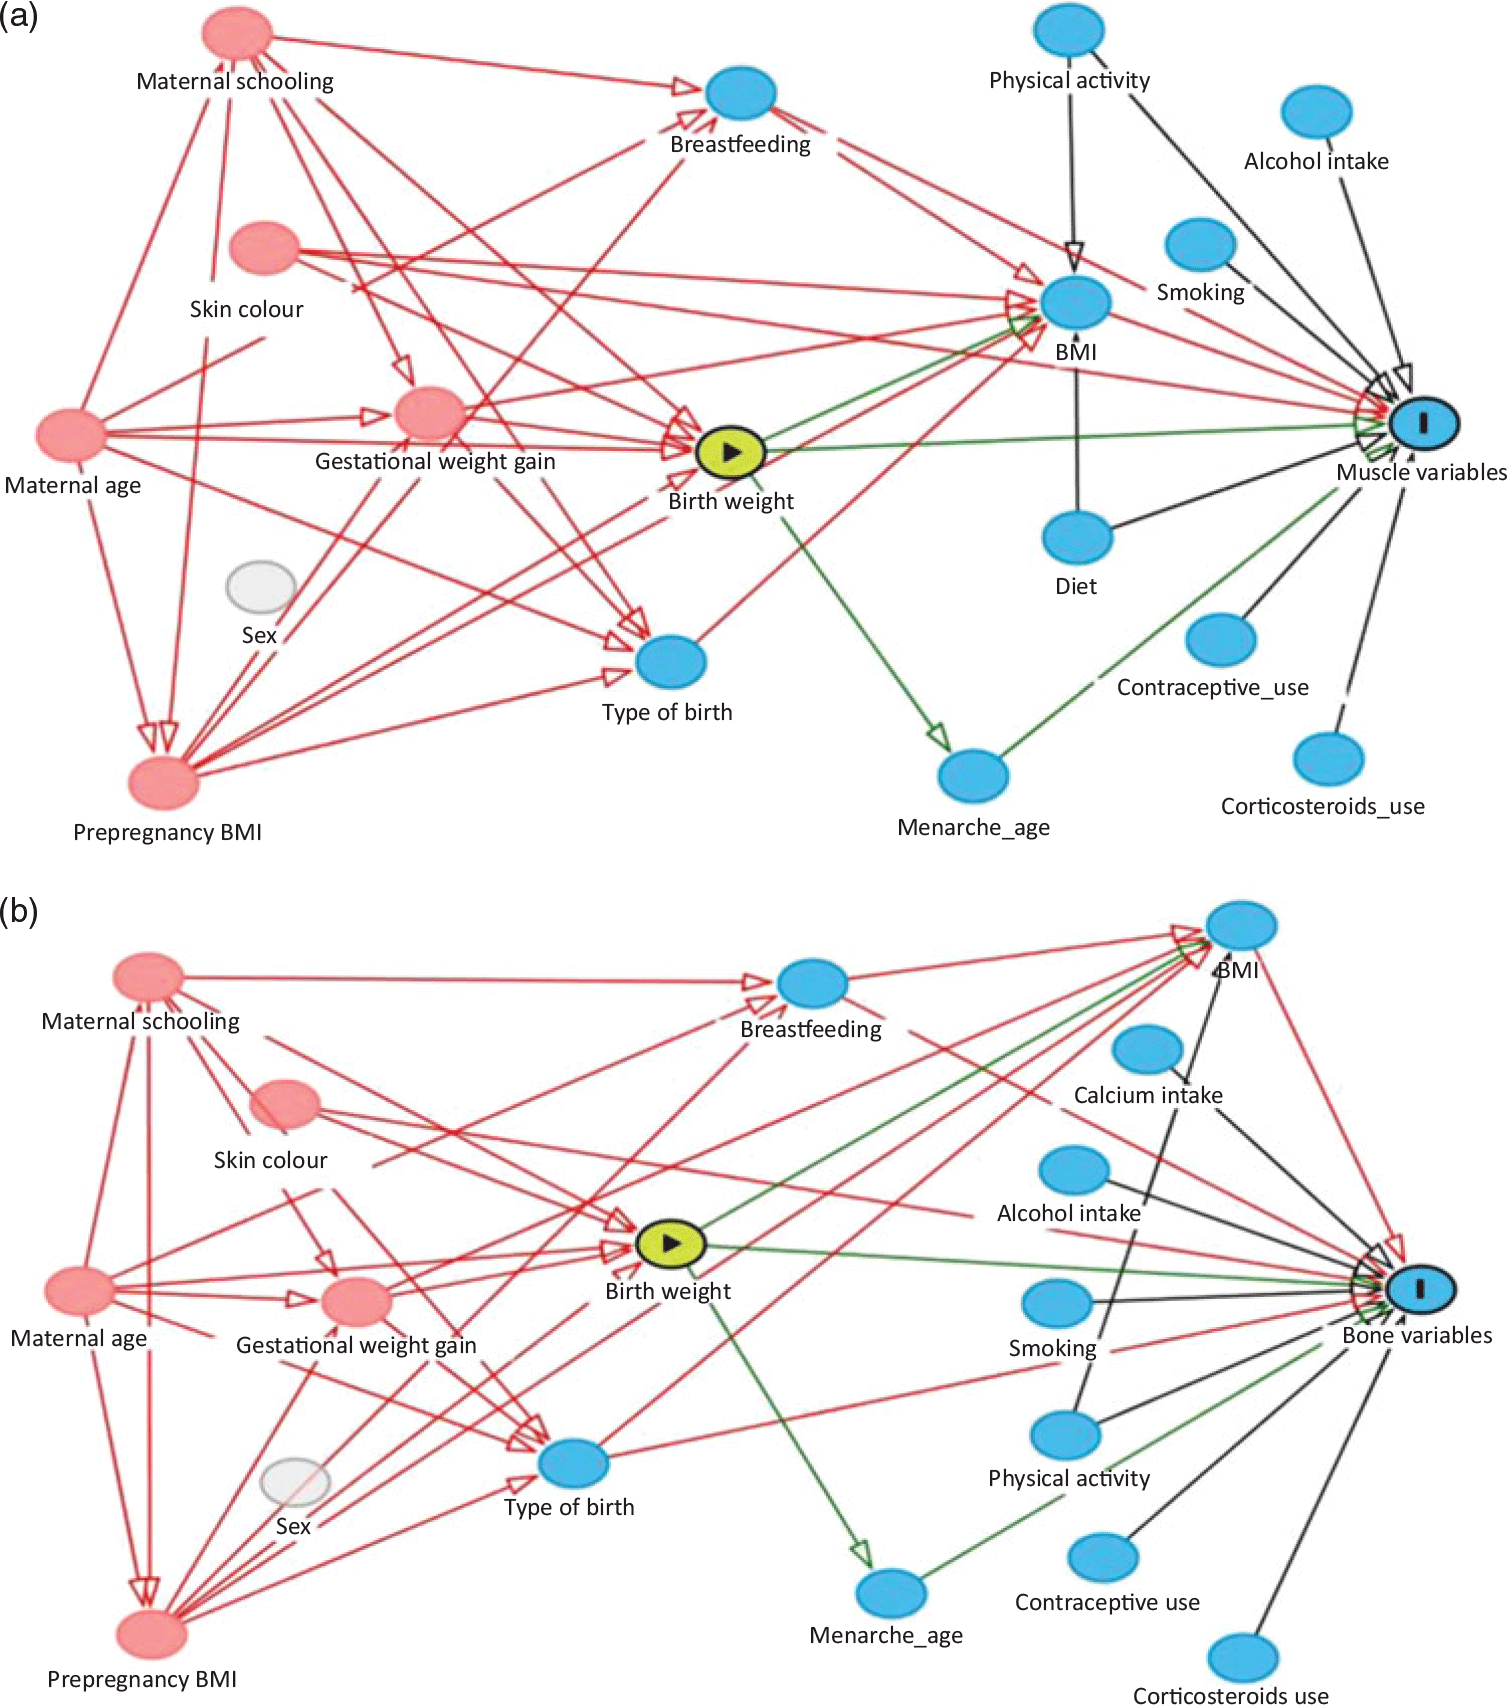
The normality of continuous variables was verified by the Kolmogorov–Smirnov test. Data were presented as mean ± standard deviation (SD) or medians and interquartile ranges. The correlation between variables was tested using Pearson or Spearman coefficient. Variables were compared across quartiles of BW using ANOVA and post-hoc Bonferroni test. Multiple linear regression was applied to test associations of BW quartiles (exposure) with muscle and bone parameters (main outcomes); β coefficients and 95% confidence intervals were estimated. Confounding variables (maternal gestational weight gain, maternal prepregnancy BMI, breastfeeding, skin color, and type of birth) were selected according to minimal sufficient adjustment sets recommended by directed acyclic graphs (DAG), constructed using the Daggity software (www.dagitty.net). Fig. 2 depicted the theoretical models based on the literature background used for muscle (panel A) and bone variables (panel B). This approach provides an entirely graphical, yet mathematically rigorous methodology and has been applied for minimizes bias when estimating the total effect from exposure to outcome and to avoid overadjustment.Reference Textor, Hardt and Knüppel21,Reference Krieger and Smith22 Additional models were performed for associations with plasma glucose, lipids, and 25-hydroxyvitamin D levels. Analyses were performed using Stata Statistical Software (release 13.1; Stata Corp LP, College Station, TX, USA). Significance was considered at p-level of 0.05.
Directed acyclic graphs built for obtaining minimal sufficient adjustments for the total effect of birth weight in: (a) muscle variables and (b) bone variables. For both, the minimal sufficient adjustment set included maternal gestational weight gain, maternal prepregnancy body mass index, breastfeeding, skin color, and type of birth. Legends:  exposure;
 outcome;
 ancestor of exposure and outcome;
 ancestor of outcome;
 unobserved (latent);
 causal path;
 biasing path.

Results
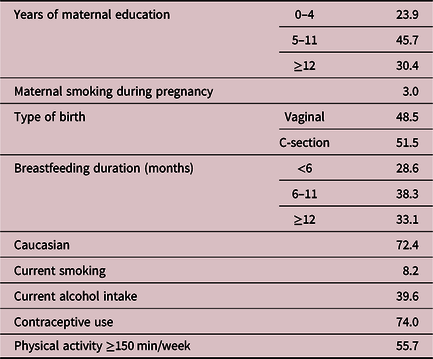
Profile of NutriHS participants and their mothers is shown in Table 1. The majority of mothers had at least 5 years of education and did not smoke during pregnancy. C-section was slightly more frequent (51.5%) than the vaginal delivery. Seventy-two participants were Caucasians and had been breastfed for at least 6 months. There was a predominance of nonsmokers (91.8%) and non-alcohol consumers (60.4%); almost two-thirds were using contraceptives, and more than a half reported regular physical activity practice.
Maternal, neonatal, and current data of 170 NutriHS participants of the present study

Data expressed as percentages.
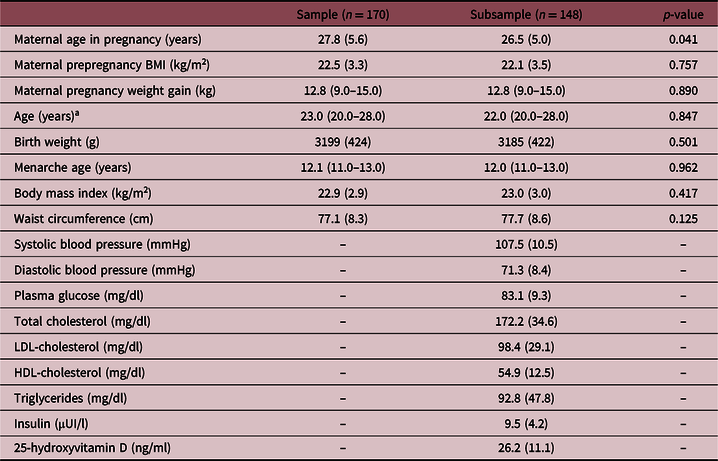
Mean maternal prepregnancy BMI was within the normal range, and these mothers had adequate weight gain during pregnancy. The sample (n = 170) as well as the subsample with complete laboratory data (n = 148) had similar maternal, early life, and current data (Table 2). Mean values of BW and anthropometric measurements were within reference ranges. The subsample showed normal mean blood pressure levels and laboratory data.
Early life and current clinical and biochemical data of NutriHS participants of the present study

Complete biochemical data were available for a subsample of 148 participants.
Data expressed as means and standard deviation or medians and interquartile range.
a Mann–Whitney test was used.
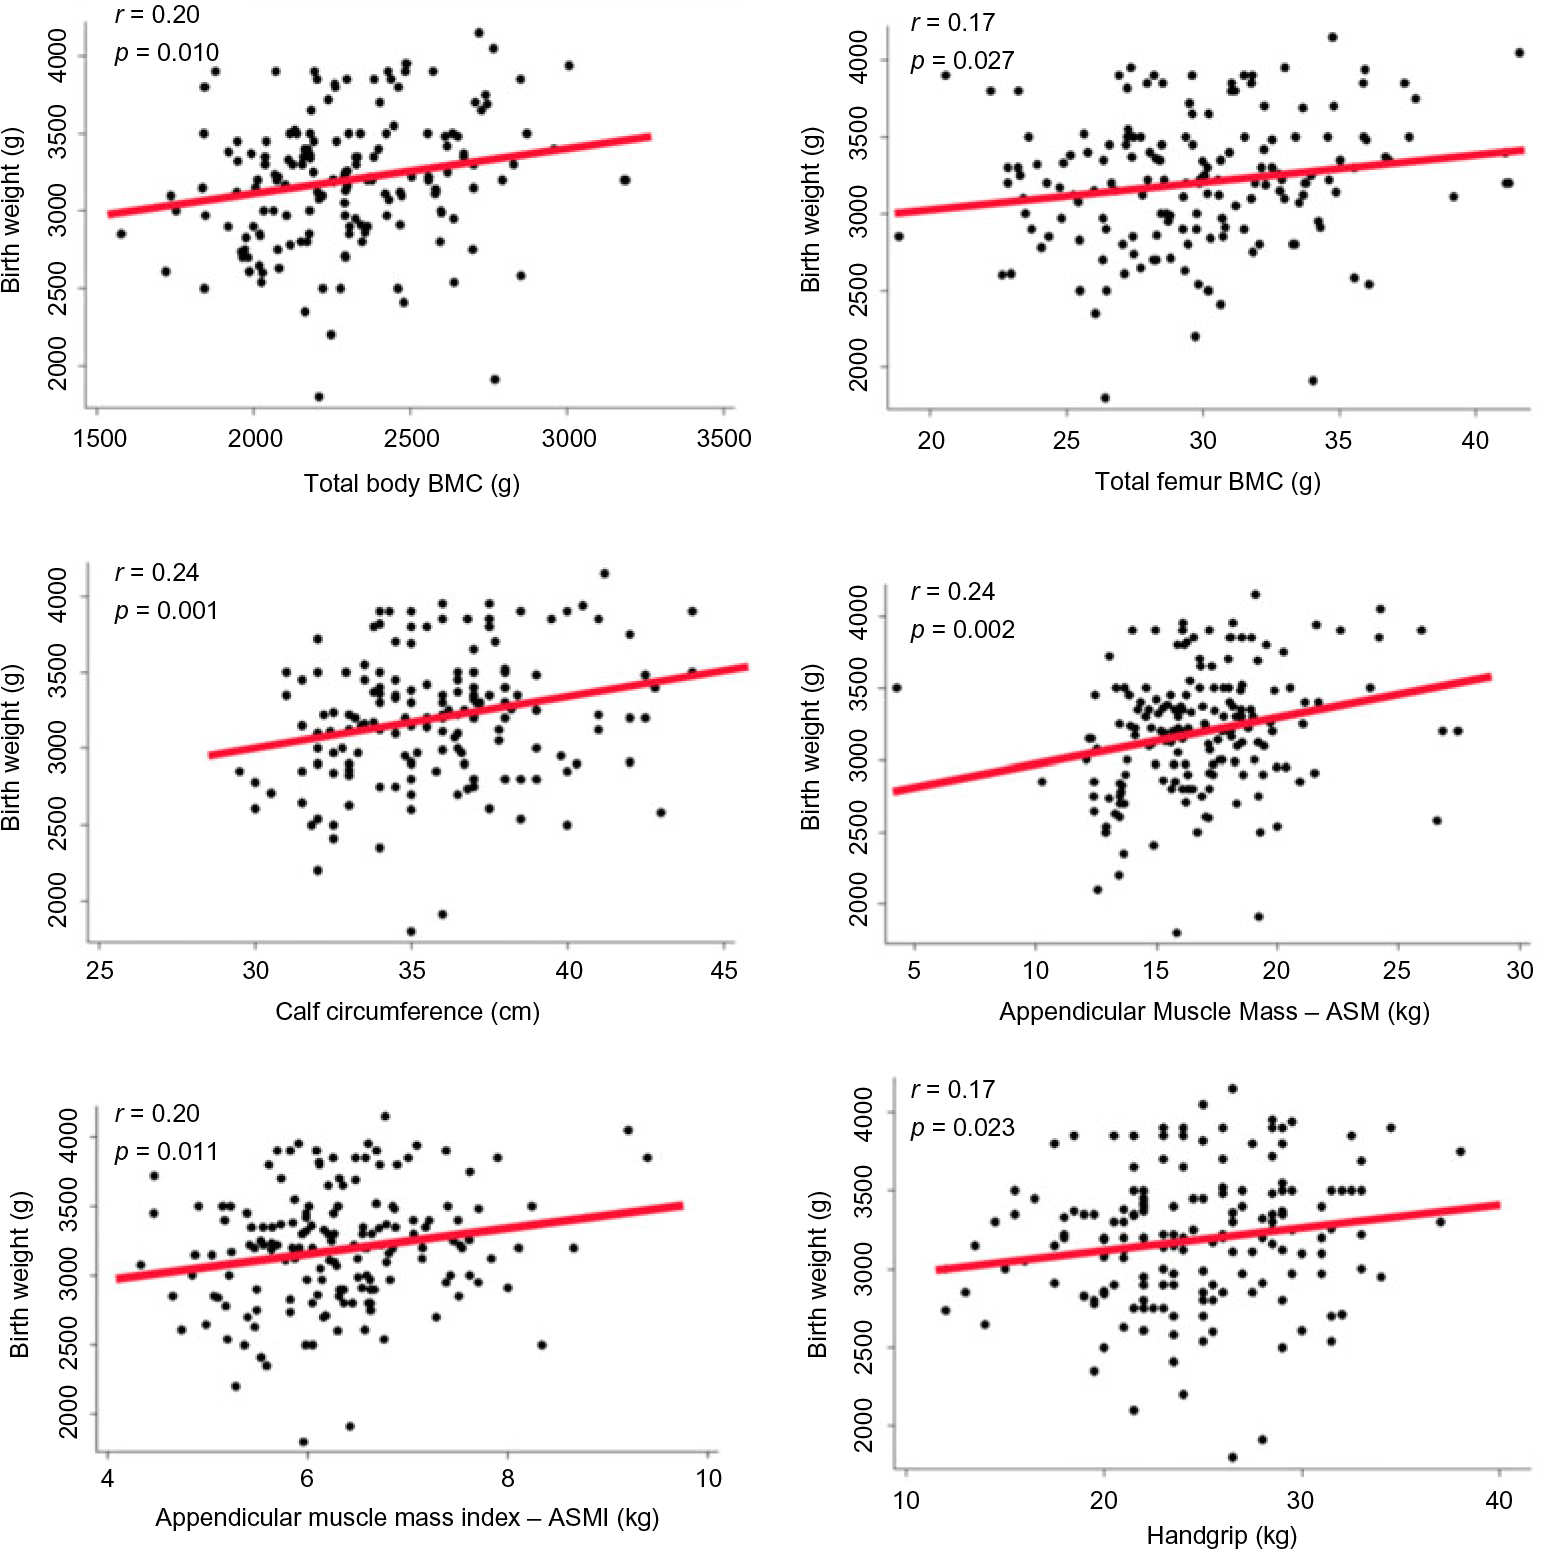
BW was positively correlated to bone (total body BMC: r = 0.20, p = 0.010; total femur BMC: r = 0.17, p = 0.027) and muscle mass and strength (CC: r = 0.24, p = 0.001; ASM: r = 0.24, p = 0.002; ASMI: r = 0.20, p = 0.011; handgrip strength: r = 0.17, p = 0.023; Fig. 3), but not to parameters of muscle performance. Strong correlations were detected between CC and ASM (r = 0.68, p < 0.001) and ASMI (r = 0.77, p < 0.001).
Graphical representation of correlations between birth weight and bone (total body and total femur BMC) and muscle variables (calf circumference, appendicular muscle mass, appendicular muscle mass index, and handgrip strength). Pearson correlation coefficient used. BMC, bone mineral content.

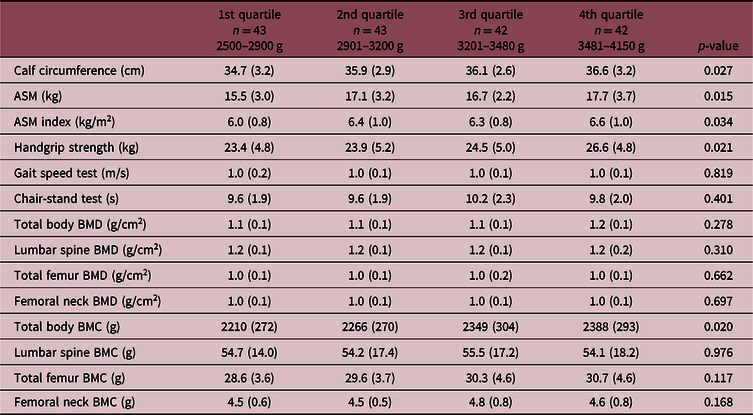
Mean values of muscle and bone variables across BW quartiles (n = 170) are shown in Table 3. Significant differences between the first and last BW quartiles in CC (34.7 ± 3.2 versus 36.6 ± 3.2 cm, p = 0.029), ASM (15.5 ± 3.0 versus 17.7 ± 3.7 kg, p = 0.015), ASMI (6.0 ± 0.8 versus 6.6 ± 1.0 kg/m2, p = 0.034), muscle strength (23.4 ± 4.8 versus 26.6 ± 4.8 kg, p = 0.021), and total body BMC (2210 ± 272 versus 2388 ± 293 g, p = 0.020) were detected.
Mean values of muscle and bone variables for 170 NutriHS participants stratified in quartiles of birth weight

ASM, appendicular skeletal muscle mass; BMD, bone mineral density; BMC, bone mineral content.
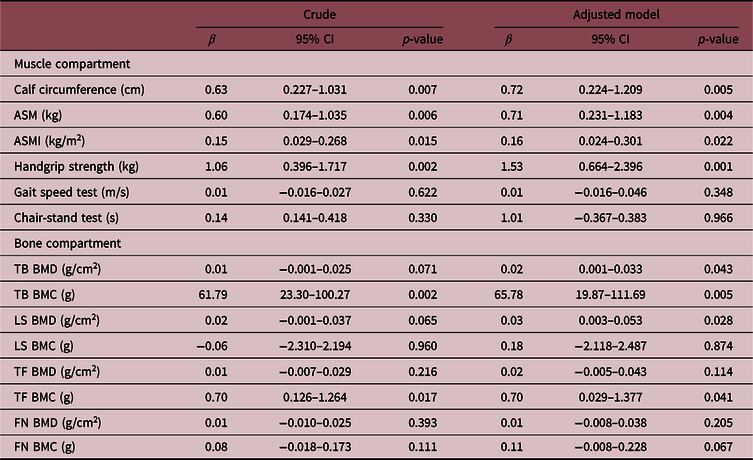
Linear regression models showed that BW quartiles were independently associated with CC, ASM, ASMI, and muscle strength after adjustments for maternal gestational weight gain, maternal prepregnancy BMI, breastfeeding, skin color, and type of birth (Table 4). BW quartiles, adjusted for the same covariables, were also significantly associated with bone variables, total body and lumbar spine BMDs, and total body and total femur BMCs.
Linear regression models of muscle and bone variables associated with birth weight in quartiles, obtained from 170 participants of the NutriHS

CI, confidence interval; ASM, appendicular skeletal muscle mass; ASMI, appendicular skeletal muscle mass index; BMD, bone mineral density; BMC, bone mineral content; TB, total body; LS, lumbar spine; TF, total femur; FN, femoral neck.
Adjusted for maternal gestational weight gain, maternal prepregnancy BMI, breastfeeding, skin color, and type of birth.
Discussion
This is the first study to investigate the association of BW with the musculoskeletal unit functionality early in adulthood, before any manifestation of osteosarcopenia. The finding of independent associations with muscle (mass and strength) and bone (mineral density and content) parameters in young healthy women reinforces that influence of intrauterine condition might be perceived even under normal BW. Additionally, we provided DXA results of muscle and bone compartments, as well as of functional muscular parameters for a stratus of healthy young women.
Some investigators raised a possible influence of BW on muscular strength in midlife.Reference Dodds, Denison and Ntani 9 Further, an association with sarcopenia in elderly was reported.Reference Sayer, Syddall, Gilbody, Dennison and Cooper 11 The hypothesis that muscular abnormalities could have their origins in early life was reinforced in birth cohortsReference Bielemann, Gigante and Horta 12 ,Reference Inskip, Godfrey, Martin, Simmonds, Cooper and Sayer23 and confirmed in a systematic review.Reference Dodds, Denison and Ntani 9 Our findings added that impact of intrauterine environment could be detected even in healthy individuals, when preventive measures could be more effectively employed. Dynapenia (i.e., loss of muscular strength generally attributed to aging) has become increasingly prevalent due to increasing life expectancy. This has been diagnosed by grip strength <16 kg when several adverse health outcomes are present.Reference Alexandre, Scholes, Santos and Oliveira 24 Handgrip strength of our sample was within the normal range, although lower than the observed in an English study with women aged 20–40 years.Reference Inskip, Godfrey, Martin, Simmonds, Cooper and Sayer 23 Such difference could be attributed to some ethnic-dependent variability.
Proposed cutoffs of ASMI (≤8.60 and ≤7.30 kg/m2 for men and women, respectively) were based on the evaluation of 229 non-Hispanic Americans aged 18–40 years.Reference Baumgartner, Koehler and Gallagher 25 Values ≤7.26 kg/m2 for men and ≤5.45 kg/m2 for women have been frequently used for the diagnosis of sarcopenia,Reference Cruz-Jentoft, Baeyens and Bauer 20 but ethnic differences in lean mass should be taken into consideration.Reference Alemán-Mateo and Valenzuela 26 ,Reference Sousa, Pinheiro, Szejnfeld and Castro27 Lower lean mass has been described in Mexicans compared to Caucasian non-Hispanic Americans,Reference Alemán-Mateo and Valenzuela 26 as well as non-African Brazilian healthy women compared to Americans of distinct ethnic groups.Reference Sousa, Pinheiro, Szejnfeld and Castro 27 Comparisons at similar age groups indicated that participants of our study had higher mean ASMI than Mexicans and other Brazilian samples, but lower than the American population.Reference Baumgartner, Koehler and Gallagher 25 – Reference Sousa, Pinheiro, Szejnfeld and Castro 27 Therefore, we emphasize the importance of having population-specific cutoffs for DXA indexes for appropriate diagnosis of sarcopenia.
The European Working Group on Sarcopenia in Older People consensus recognized the muscle strength better than the muscle mass in predicting adverse outcomes.Reference Cruz-Jentoft, Bahat and Bauer 28 We consider that assessment of both, muscle quality and quantity, is important for clinical purposes. Evidence from our study suggested that BW – even within normal range – could be related to muscle strength and mass in adulthood. Considering that the development of sarcopenia begins early in life,Reference Cruz-Jentoft, Bahat and Bauer 28 a low-normal BW could already indicate a need to maximize muscle in youth and young adulthood, in order to maintain muscle in middle age and minimize loss in older age. Our study was based on tools recommended by the European sarcopenia consensus, that is, handgrip and chair-stand tests to assess the strength of leg muscles,Reference Cruz-Jentoft, Bahat and Bauer 28 the DXA that is the most widely used method to quantify muscle, and the gait speed to assess physical performance. Additionally, we confirmed previous studies of older adultsReference Barbosa-Silva, Menezes, Bielemann, Malmstrom and Gonzalez 29 ,Reference Ukegbu, Kruger and Meyer30 that CC can be considered a proxy of muscle mass also in young adults, since this measure showed to be strongly correlated to ASM and ASMI. As expected, mean values in the NutriHS women were greater than those observed in elderly women from other populations.Reference Barbosa-Silva, Menezes, Bielemann, Malmstrom and Gonzalez 29 ,Reference Ukegbu, Kruger and Meyer30
Established diagnostic values for sarcopenia diagnosis in women (handgrip <16 kg; chair-stand test >15 s; ASM <15 kg; ASMI <6.0 kg/m2; gait speed ≤0.8 m/s) support the healthy status of our sample. Despite that, when analyzing the mean values of muscle parameters across BW quartiles, we observed that ASM and ASMI means in the first quartile were close to the lower limit. This group of participants may deserve special attention considering that they have just reached the peak of muscle mass with a decreasing tendency later on.Reference Sayer, Robinson, Patel, Shavlakadze, Cooper and Grounds 2 Similar to described risk for non-communicable chronic diseases conferred by the low BW,Reference Davies, Smith, Ben-Shlomo and Litchfield 31 ,Reference Thompson, Syddall, Rodin, Osmond and Barker32 we suggest that low-normal BW could be also a predictor of lower muscle mass in adulthood and, perhaps, of sarcopenia in advanced age. The follow-up of the NutriHS participants could explore such hypothesis.
Several factors are shown to influence bone mass during childhood and adolescence such as heredity, gender, life habits, endocrinopathies, and medications.Reference Bianchi 33 Our findings added evidence to other studies regarding the association of BW and weight in infancy with adult bone mass.Reference Gonçalves, Assunção and Wehrmeister 13 ,Reference Schlüssel, de Castro and Kac34 A systematic review and meta-analysis confirmed this positive association in children but weaker in adults.Reference Martínez-Mesa, Restrepo-Méndez and González 35 On the other hand, in a European birth cohort prenatal growth had no significant impact in BMD in early adulthood, while the weight gain during childhood did.Reference Leunissen, Stijnen, Boot and Hokken-Koelega 36 The Helsinki Birth Cohort Study, evaluating elderly women, concluded that information on early growth did not improve prediction beyond that predicted by current height and weight.Reference Mikkola, von Bonsdorff and Osmond 37 Another study showed lower impact of BW than the later growth and BMI in childhood and adolescence on bone mass.Reference Evensen, Skeie and Wilsgaard 38 Consistency of significant associations of BW quartiles with many bone parameters (BMD and BMC in several sites) after adjustments (maternal gestational weight gain, maternal prepregnancy BMI, breastfeeding, skin color, and type of birth) was observed in healthy young women. Direct correlations between the muscle and bone parameters supported a crosstalk between the tissues as previously describedReference Maurel, Jähn and Lara-Castillo 1 and reinforced the need of the concomitant evaluation of these compartments.
Our findings in young healthy women from the NutriHS are in line with the importance of the first 1000 days of life also considering musculoskeletal health. A healthy intrauterine environment, characterized by adequate nutrition and lifestyle, as well as the appropriate growth rate in infancy, should enable adequate muscle and bone mass peaks in adulthood reducing the risk of osteosarcopenia in elderly age.
Our study has limitations related to the design and memory bias of mothers. However, it was reported that women are able to self-report pregnancy and delivery details with reasonable accuracy almost 30 years later.Reference Chin, Baird, McConnaughey, Weinberg, Wilcox and Jukic 39 In fact, self-reported BW data have been commonly used and were validated in previous studies.Reference Shenkin, Zhang, Der, Mathur, Mina and Reynolds 40 A strength of our study was the statistical analysis including adjustments oriented by DAG. The adequacy of this approach when testing associations has been emphasized to minimize confounding bias and avoid overadjustments.Reference Textor, Hardt and Knüppel 21 ,Reference Krieger and Smith22 Our selected group of participants impedes extrapolation to different samples of women. However, data from a healthy and homogeneous sample (highly educated Caucasian women) could be seen as a strength once we describe an adequate musculoskeletal profile that may be useful for future comparisons. Another strength was DXA assessment of muscle–bone unit functionality concomitantly.
We conclude that BW in the normal range is associated with muscle–bone unit assessed by DXA in young healthy women from the NutriHS, reinforcing the importance of intrauterine environment for the musculoskeletal health. Our findings suggest that interventions for increasing peaks of muscle and bone at the beginning of adulthood should be beneficial even for individuals with normal BW. Prospective studies are necessary to investigate the ability of BW to predict osteosarcopenia risk in the long term.
Financial support
This research was supported by the Foundation for Research Support of the State of Sao Paulo – FAPESP, Brazil (grant numbers: 2015/10045-7 and 2017/13087-8).
Conflict of interest
The authors declare no conflict of interest.
Ethical standards
NutriHS is a cohort study that was approved by the institutional ethics committee (Research Ethics Committee of the School of Public Health from University of São Paulo – COEP numbers: # 991,542/15 and 257,513/13) and follows the norms of the National Health Council, regarding ethics in research with humans and the Helsinki Declaration of 1975 (revised in 2008).