Introduction
Antarctica as a remote and mostly unpopulated region provides a unique opportunity for studying recent environmental changes associated with the current climate change (King et al. Reference King, Turner, Marshall, Connolley and Lachlan-Cope2004, Hodgson et al. Reference Hodgson, Roberts, Smith, Verleyen, Sterken, Labarque, Sabbe, Vyverman, Allen, Leng and Bryant2013, Lecomte et al. Reference Lecomte, Vignoni, Córdoba, Chaparro, Chaparro, Kopalova, Gargiulo, Lirio, Irurzun and Böhnel2016), as well as those related to adverse anthropogenic impacts of Antarctic stations (e.g. Chaparro et al. Reference Chaparro, Nuñez, Lirio, Gogorza and Sinito2007). Knowledge of different processes impacting on Antarctica is fundamental for understanding the effects of future environmental and climate changes in this polar region (Lecomte et al. Reference Lecomte, Vignoni, Córdoba, Chaparro, Chaparro, Kopalova, Gargiulo, Lirio, Irurzun and Böhnel2016).
Antarctic lakes and ponds are especially sensitive to changes in the hydrological balance, which are, in turn, the result of climatic fluctuations (e.g. Björck et al. Reference Björck, Olsson, EllisEvans, Håkansson, Humlum and deLirio1996, Hodgson et al. Reference Hodgson, Roberts, Smith, Verleyen, Sterken, Labarque, Sabbe, Vyverman, Allen, Leng and Bryant2013, Hawes et al. Reference Hawes, Howard-Williams and Sorrell2014). These fluctuations in the hydrological balance are reflected by variations in lake levels, sediment input, chemistry and biology of the water column, and the sedimentary processes, which are recorded in the sediments (Warrier et al. Reference Warrier, Mahesh, Mohan, Shankar, Asthana and Ravindra2014). Lacustrine sediments carry a strong signal originating from minerogenic and chemical weathering products of the catchment areas (i.e. solutes and particulate material) and can be considered to be representatives of sedimentological and biogeochemical processes taking place in the watershed (Alfonso et al. Reference Alfonso, Vasquez, Hernandez, Mora, Handt and Sira2015).
A wide variety of studies have conducted magnetic measurements in order to investigate environmental and anthropogenic processes in lake systems (e.g. Pan et al. Reference Pan, Petersen, Davila, Zhang, Winklhofer, Liu, Hanzlik and Zhu2005, Chaparro et al. Reference Chaparro, Gargiulo, Irurzun, Chaparro, Lecomte, Böhnel, Córdoba, Vignoni, Manograsso Czalbowski, Lirio, Nowaczyk and Sinito2014). Iron oxides are very sensitive to physicochemical conditions in sedimentary environments and their magnetic properties can be determined using environmental magnetism methods (Liu et al. Reference Liu, Roberts, Larrasoaña, Banerjee, Guyodo, Tauxe and Oldfield2012). Magnetic properties are well suited as proxies of magnetic mineral concentration, magnetic grain size and environmental processes affecting these parameters (Maher et al. Reference Maher, Thompson and Hounslow1999, Egli Reference Egli2004). Magnetic properties are controlled by the competing fluxes of allochthonous and autochthonous magnetic particles, and differ according to location in a lake basin (Lascu et al. Reference Lascu, McLauchlan, Myrbo, Leavitt and Banerjee2012). So far, studies of the magnetic properties of Antarctic lacustrine sediments are limited (Chaparro et al. Reference Chaparro, Gargiulo, Irurzun, Chaparro, Lecomte, Böhnel, Córdoba, Vignoni, Manograsso Czalbowski, Lirio, Nowaczyk and Sinito2014, Warrier et al. Reference Warrier, Mahesh, Mohan, Shankar, Asthana and Ravindra2014, Lecomte et al. Reference Lecomte, Vignoni, Córdoba, Chaparro, Chaparro, Kopalova, Gargiulo, Lirio, Irurzun and Böhnel2016). Knowledge of the spatial distribution and limnologic control of magnetic properties and non-magnetic sedimentological parameters in Antarctic lakes is required to improve our understanding of environmental processes, as well as for development of better palaeoenvironmental and palaeoclimate reconstructions (Lascu & Plank Reference Lascu and Plank2013).
In this study, the distribution of detailed magnetic properties and additional non-magnetic data (grain size and total organic carbon (TOC)) of sediments from across Lake Anónima (LA) was investigated to unravel the sedimentary and geochemical processes in the lake and its surroundings. The main aim of the analysis was focused on determining magnetic proxies of surface sediments for understanding environmental dynamics, i.e. recent depositional processes.
Geological setting
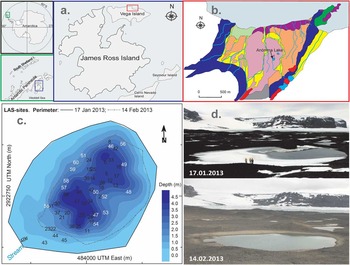
Lake Anónima is located at Bahía del Diablo on Vega Island (James Ross Archipelago, Antarctic Peninsula; Fig. 1a). It is part of an endorheic basin situated in a glacial valley developed on Late Cretaceous sedimentary rocks and Tertiary volcanic rocks. The first lithologic group consists of a set of fossiliferous marine shales and sandstones of Santa Marta, Snow Hill Island and López de Bertodano formations (Roberts et al. Reference Roberts, Lamanna, Clarke, Meng, Gorscak, Sertich, O’Connor, Claeson and MacPhee2014), and the second is basalt of the James Ross Island Volcanic Group (Fig. 1b). The bottom of the valley is filled mainly with Holocene till deposits of local basaltic and, in a lower proportion, sediment clasts (Zale & Karlen Reference Zale and Karlen1989, Ermolin et al. Reference Ermolin, De Angelis and Skvarca2002). Along the northern coast of Bahía del Diablo, deltaic and marine deposits produced by marine ingressions after the early Holocene deglaciation are interbedded with till deposits. In the southern part of the valley, moraine deposits were partially reworked and are covered by Holocene and recent glaciofluvial sediment (Ermolin et al. Reference Ermolin, De Angelis and Skvarca2002).
Map of the Antarctic continent, Antarctic Peninsula and James Ross Archipelago. b. Lake Anónima location and surrounding geology (modified from Ermolin et al. Reference Ermolin, De Angelis and Skvarca2002). Glacial and snow meltwater creeks and lakes are shown in cyan and glaciers are in white. Present sediments: glaciofluvial (yellow), deltaic (light green) and marine (green), Holocene sediments: glaciofluvial (orange), marine/deltaic (purple) and Till (light purple), Tertiary outcrops James Ross Volcanic Group (red). c. Lake bathymetry (during summer) and shore lines in January and February. Sampling localities are shown by sample number, with a total of 45 sediment samples (from 60 sites) collected from the top of the sediment column. Sites (without sediment) with basaltic blocks and gravel are indicated by a number in white. d. The system shows significant hydrological change during the summer (photographs taken in January and February 2013).

Lake Anónima is a shallow basal-moraine lake, which originated by thermokarst. It is a proglacial lake with water input from streams and snow meltwater with a sediment load that has formed a small delta on the south-west coast of the lake. The lake has a maximum depth of 4.6 m and there are two deep sub-basins separated by a shallow ridge (Fig. 1c).
The climate in the James Ross Archipelago is semi-arid with annual snowfall ranging from 200–500 mm yr-1 w.e. (water equivalent of precipitation; Strelin & Sone Reference Strelin and Sone1998). Summers are short (December–February) and mean temperatures for the warmest and coldest months at Marambio Station (64°14'S, 56°38'W) are -3.3°C and -14.5°C, respectively (data available from the National Meteorological Service Argentina, Marambio Station). During winter the lake surface is frozen and snow accumulates on the surface. With increasing temperatures in late spring and early summer, first the snow starts to melt, followed by thawing of the ice layer. When the mean temperature is high enough, the permafrost develops an active layer, putting the complete water cycle into operation. Lake Anónima collects surface runoff and can drain underground into surface streams and nearby lake systems. Terrestrial vegetation on Vega Island is limited to non-vascular plants, predominantly bryophytes and lichen tundra.
Methods
Sampling
Stream, snow and lake bottom sediment samples were taken from the system during the summer Antarctic campaign in 2012–13 (CAV-2012/2013 Dirección Nacional del Antártico, Argentina).
The bottom sediment samples were collected using an inflatable boat at 45 of 60 points distributed in a grid covering all present-day depositional environments (Fig. 1c). An Ekman dredger was slowly lowered to capture the uppermost sediments. The top 2–3 cm were skimmed, and refrigerated until their analysis. Co-ordinates of each sampling site were recorded using a GPS receiver, and water depth was recorded either using sonar or manually for shallow littoral areas. In the laboratory, each sediment sample was prepared and sub-sampled for magnetic, grain size and geochemical analyses.
Snow and stream samples were collected following standardized techniques (e.g. Namiesnik & Szefer Reference Namiesnik and Szefer2010), to compare geochemical signatures of different sources: atmospheric and tributaries. Lakewater was sampled twice, on 17 January and 12 February 2013, to evaluate the physicochemical changes. Water temperature, pH, electrical conductivity, total dissolved solids (TDS) and alkalinity were measured in situ. Alkalinity was measured as CaCO3, using a 0.16 N H2SO4 solution until pH=4.5. Endpoint titration was reached in unfiltered water. For subsequent determinations, samples were vacuum filtered in the field with 0.22 µm pore-size cellulose filters (HA-type, Millipore). One aliquot was stored in polyethylene bottles at 4°C for the determination of anions by chemically suppressed ion chromatography with conductivity detection. Another aliquot was acidified (pH<2) with concentrated, redistilled and ultrapure HNO3 (Sigma-Aldrich) for the analytical determination of major, minor and trace elements by inductively coupled plasma-mass spectrometry (ICP-MS, Activation Laboratories, Ancaster, ON, Canada). The results for major, minor and trace elements were validated using NIST (National Institute of Standards and Technology) 1640 and Riverine Water Reference Materials for Trace Metals certified by the National Research Council of Canada (SRLS-4).
Grain size and geochemical studies
Grain sizes were determined by laser diffraction with a Horiba LA-950 particle size analyser at the Centro de Investigaciones en Ciencias de la Tierra (Universidad Nacional de Cordoba, Argentina). Sediments were pre-treated with Na2PO7 (2% w/v, 24 h) for deflocculating clay, and then rinsed four times with distilled water. Thereafter, they were treated with 35% HCl for 24 h to remove carbonates, and washed four times with distilled water. Finally, after adding 10 ml of 30% H2O2 to eliminate organic matter (OM), the samples were boiled for 4 h and rinsed five times with distilled water. Samples were minimally dispersed to prevent the breaking up of aggregates. The precision (reproducibility) of the laser diffraction particle sizer was tested using mixtures of glass beads (NIST traceable polydisperse particle standard PS202/3–30 μm and PS215/10–100 μm; Whitehouse Scientific). For both runs (PS202, n=6 and PS215, n=5) the median (D50) was within 3% certified nominal value, and the percentiles D10 and D90 were within 5% of nominal values for the standards. This instrument yields the following grain size classes: coarse–medium sand D (>250 µm), fine sand C (125–250 µm), very fine sand B (63–125 µm), coarse silt A5 (31.2–63 µm), medium silt A4 (15.6–31.2 µm), fine silt A3 (7.8–15.6 µm), very fine silt A2 (3.9–7.8 µm) and clay A1 (<3.9 µm).
Total inorganic carbon (TIC) and TOC content in all samples was estimated by loss on ignition (LOI; Heiri et al. Reference Heiri, Lotter and Lemcke2001). All LOI analyses were carried out in a muffle furnace. The samples were heated at 105°C for 24 h, then at 550°C for 4 h and at 950°C for 2 h. After each step, the dry weight (DW) of the sample was obtained. The following equations were used to calculate the percentage of LOI at 550°C and 950°C:
 $${\rm LOI}_{{{\rm 550}}} {\rm \,{\equals}\,100}\left( {{\rm DW}_{{{\rm 105}}} {\rm \,{\minus}\, DW}_{{{\rm 550}}} } \right){\rm \,/\,WS,}$$
 $${\rm LOI}_{{{\rm 950}}} {\rm \,{\equals}\,100}\left( {{\rm DW}_{{{\rm 550}}} {\rm \,{\minus}\, DW}_{{{\rm 950}}} } \right){\rm \,/\,WS,}$$
where WS is the initial weight of the sample and DW105, DW550 and DW950 are the dry weight of the sample after heating at 105°C, 550°C and 950°C, respectively.
The remaining sample, after heating, is the residuum (LOIres) associated with siliciclastic material. LOI550 and LOI950 were used to determine TOC and TIC content by Dean’s relations (TOC=LOI550/2, TIC=0.273 LOI950) (Dean Reference Dean1974, Reference Dean1999).
Magnetic studies
Magnetic proxies can be determined with high sensitivity combined with fast laboratory processing. Sample preparation is relatively simple, laboratory instruments are of relatively low cost, and most measurements are non-destructive. Magnetic measurements were carried out in the Laboratory of Paleomagnetism and Rock-magnetism at Centro de Investigaciones en Física e Ingeniería del Centro de la Provincia de Buenos Aires (Universidad Nacional del Centro de la Provincia de Buenos Aires, Argentina) and at the Centro de Geociencias (Universidad Nacional Autónoma de México).
A small amount of material (<50 mg) was used to measure with a Princeton Measurement Micromag 2900 AGM system magnetic hysteresis loops and isothermal remanent magnetizations in fields between -2 and 2 T and at room temperature. The material was weighed to allow for calculation of mass-corrected hysteresis parameters. Among hysteresis parameters and ratios of interest, the saturation magnetization (Ms), saturation remanence (Mr), coercive force (Hc) and the relative contribution of paramagnetic and diamagnetic minerals to the Ms were calculated.
Sediment samples were also sub-sampled and packed into plastic containers (2.3 cm3), weighed (2–3 g) and their magnetic susceptibility, anhysteretic (ARM) and isothermal remanent magnetization (IRM) measured. Volumetric magnetic susceptibility (κ) was measured with a Bartington Instruments MS2 and a MS2B dual frequency sensor (0.47 and 4.7 kHz). χ was obtained by taking into account the sample mass. The ARM was imparted using an alternating field (AF) demagnetizer by superimposing a direct current (DC) bias field of 50 μT in the AF interval 100–2.5 mT, and the ARM was measured with a Minispin magnetometer (Molspin). The mass-specific ARM susceptibility (χARM) was estimated from the ARM acquired in this DC bias field. The χARM/χ-ratio and the King’s plot (χARM vs χ, King et al. Reference King, Banerjee, Marvin and Özdemir1982) were also studied. The IRM acquisition curves and the saturation of IRM (SIRM=IRM2.5T) were determined in 25 steps between 10 mT and 2.5 T. The IRM was produced with an ASC Scientific pulse magnetizer, and measured with the Minispin magnetometer. Hcr, S-ratio (=-IRM-300mT/SIRM), χARM/SIRM and SIRM/χ ratio were also calculated.
Some samples (of ~100–220 mg) were studied in a laboratory-built horizontal magnetic balance to produce thermomagnetic curves. The induced field was chosen at 0.5 T, and ramp rates during heating and cooling were 30°C min-1. Samples were heated in air to a temperature of ~700°C and subsequently cooled to room temperature (RT), to obtain curves of the induced magnetization (M/MRT).
X-ray diffraction and Fourier transform infrared spectroscopy studies
Prior to X-ray diffraction (XRD) and Fourier transform infrared (FTIR) spectroscopy analyses, magnetic minerals were extracted using ground and sieved sediments. The material was dispersed in double distilled water and flocks were disaggregated by ultrasonic treatment for a short period. After that, the magnetic material in suspension was collected using a magnet and then dried at room temperature. A sample of ~500 mg was collected in order to carry out the analyses.
The major and minor mineral phases in the magnetic extract were identified by XRD, using an automatic Philips PW 3710 X-ray diffractometer with graphite monochromated Cu-Kα radiation (λ=1.5405 Å), automatic divergence slit and a scan speed of 0.008° s-1.
The spectroscopic behaviour was analysed by FTIR spectroscopy. These analyses were carried out in order to confirm the diffractometric results and to retrieve information on the mineralogical composition. The samples were previously dried at 100°C within a few hours to eliminate the interference of moisture. Infrared (IR) spectra were recorded on a Nicolet-Magna 550 FTIR instrument with cesium iodide (CsI) optics, using the KBr pellet technique. The source was mid–far IR using a DTGS CsI detector (6400–200 cm-1).
Statistical analyses
Multivariate statistical analysis was performed using the R free software (R version 3.1.3 2015) and aimed to: i) determine the magnetic features of lake sediments and ii) explore the relationship between the magnetic parameters, grain size fractions and TOC. The magnetic parameters used for these analyses were: χ, χARM, SIRM and Ms (magnetic concentration dependent parameters), and χARM/χ-ratio, χARM/SIRM, SIRM/χ, Hc, Hcr and the relative contribution of paramagnetic and diamagnetic minerals (magnetic grain size/mineralogy dependent parameters).
The Kruskal–Wallis test was used to determine if there were magnetic differences between grain size fractions. When the Kruskal–Wallis test was significant (i.e. if at least one of the groups is significantly different from at least one of the others) a Conover Inman test (Conover Reference Conover1999) was performed to analyse differences between the grain size fractions for each magnetic parameter. This is an alternative method of multiple comparisons (its parametric equivalent is the Tukey’s range test) that helps to determine which groups are different with appropriately adjusted pairwise comparisons.
The relationships of all of the magnetic parameters was analysed using a principal component analysis (PCA) with matrix correlation. An indicator called Kaiser-Meyer-Olkin (KMO) factor adequacy (Kaiser & Rice Reference Kaiser and Rice1974) evaluates the appropriateness of applying factor analysis, and a KMO value of <0.5 is considered to advise against applying a PCA. The data matrix was standardized with a column range, and then a correlation matrix was used. The PCA was carried out to study, in a multivariate manner, one-to-one relationships between the variables. The dataset included magnetic and geochemical variables (n=45 samples).
After the PCA, a non-hierarchical k-means cluster analysis (CA) was performed in order to build clusters of samples with similar magnetic, geochemical and grain size features. Each of the clusters is characterized by magnetic variables. The co-ordinates of the rows on the principal components (obtained from PCA) were used to build the clusters. A very high percentage of the inertia (>80%) should be retained by the components selected to obtain a stable and clear hierarchy.
Results
Hydrochemical, grain size and geochemical studies
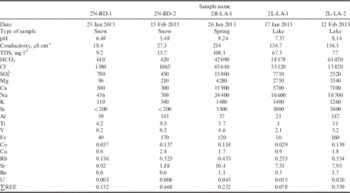
The main physicochemical characteristics including some trace element concentrations from LA are shown in Table I. Lake Anónima shows particular physicochemical characteristics, with diluted waters (TDS<100 mg l-1) that are slightly alkaline with a pH of 7.6 on 17 January 2013 and 8.1 on 12 February 2013. The chemical classification of water bodies on Vega Island is chloride-sodic-potasic. The characteristics of LA are comparable to other lakes from Vega and James Ross islands.
Physicochemical characteristics of Lake Anónima.

REE=rare earth element, TDS=total dissolved solids.
Elements are given in µg l-1.
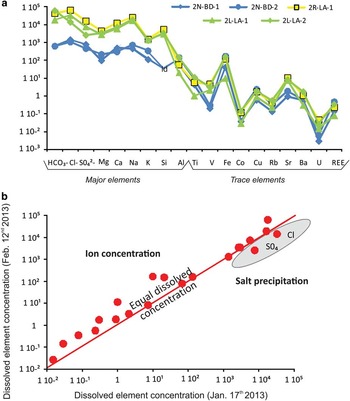
Snow samples were slightly acid (mean pH~6.0) and diluted (mean TDS~11.5 mg l-1), whereas the stream flowing into the lake is clearly alkaline (pH>8.0) and more concentrated (TDS~108 mg l-1). Lake Anónima presents intermediate salinity implicating both sources. This is also shown in Fig. 2a, where the dissolved concentrations of both sources (samples 2N-BD-1/2 and 2R-LA-1) are plotted, and the LA waters (samples 2L-LA-1/2) fall in between snow and river samples. Major element data support this interpretation, as their low concentration in snow samples suggests that water input is supplied by streams and snow meltwater.
Dissolved major and trace element concentrations from snow (2N-BD-1 and 2), stream water (2R-LA-1) and lake water (2L-LA-1 and 2). b. Geochemical data show an increase in dissolved element concentration in a short period of ~1 month.

The system also shows significantly dynamic hydrological and hydrochemical behaviour during summer reflected in lake size and water level changes, i.e. an ~20% perimeter decrease (as seen in photos taken in January and February 2013 see Fig. 1d), and by dissolved element concentrations, i.e. different percentage increases. Comparing LA water samples collected on 17 January and 12 February 2013 (Fig. 2b) the corresponding geochemical data show an increase in dissolved element concentration. Perimeter decrease may be caused by infiltration or evaporation processes, but the 14–22% dissolved concentration increases over a short period of time (~1 month) indicate that evaporation dominates over infiltration.
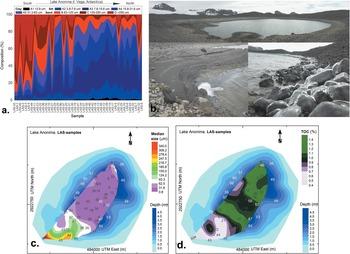
The grain size distribution and percentage of clay (A1), silt (A5, A4, A3 and A2) and sand (B, C and D) in sediment samples is shown in Fig. 3a & c. The TOC content is low due to limited primary productivity (biological communities) in this region (range: 0.40–1.40%, mean: 0.99%, standard deviation: 0.24%) with two distinct local maxima in the deepest areas of the lake (Fig. 3d). Minimum values were detected in all shoreline samples. The TIC content was also low (range: 0.00–0.19%, mean: 0.06%, standard deviation: 0.04%) and therefore these values were discarded and not considered in the statistical analysis. The proportion of TOC was <2.0%; therefore, it is possible to assume that the siliciclastic inorganic fraction (~98.0%) is the main component of the sediment.
Percentage contribution of sand, silt and clay grain size fractions, in order of sample locations from south to north. b. Panoramic view of Lake Anónima. View of the deltaic area developed by the surface main stream inflow on the south-west margin of the lake (upper image) and details of sand, basaltic blocks and gravel at the littoral margin of the lake (lower images). c. Median grain size distribution. The littoral areas are dominated by basaltic blocks and gravel, whereas the profundal areas are characterized by silt/clay fractions that follow the lake bathymetry. d. Total organic carbon (TOC) distribution showing two distinct local maxima in the profundal areas and minimum values for all shoreline samples.

Magnetic properties
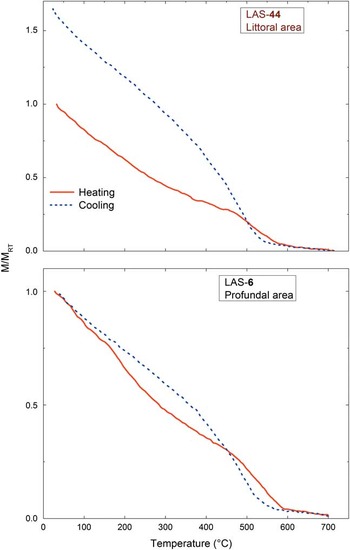
Curie temperatures were estimated from M(T) curves by the second derivative method and a dominant magnetic phase corresponding to magnetite was revealed for all areas (Tc=580°C; Fig. 4). In addition, secondary magnetic phases (Tc=290°C and 690°C) are present and may correspond to iron oxides (e.g. haematite) and iron sulphides (e.g. greigite). The heating curves for samples LAS-6 and LAS-44 are similar, with a slope change between 200°C and 250°C followed by a decrease in magnetization and another slope change at ~500°C with a gradual decay in magnetization to 580°C. The occurrence of ferrimagnetic minerals, such as magnetite and greigite, results in an inflection between 200°C and 300°C, but the marked minimum at ~320°C and the secondary maximum are not observed, and there is a more gradual decay to the Curie temperature of magnetite. Our thermomagnetic curves are not reversible, as the cooling/heating branches show changes in magnetization M(T) after heating. As observed in Fig. 4, the littoral sample (LAS-44) shows a magnetization increase of ~70% with respect to the MRT after cooling, which points to the formation of new ferrimagnetic minerals.
Thermomagnetic curves for sediment samples corresponding to the littoral and profundal areas of Lake Anónima. Magnetite is the main magnetic mineral with Curie temperatures close to 580°C, and minor secondary magnetic phases with lower Curie temperatures are also visible.

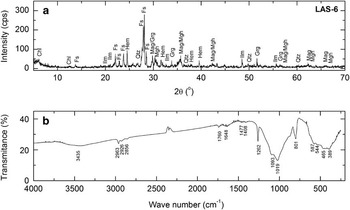
The XRD patterns for sample LAS-6 from a profundal site are shown in Fig. 5a. Magnetic minerals as interpreted above from thermomagnetic studies are supported by magnetite, haematite and greigite peaks. In addition, the FTIR spectrum of the magnetic extract is shown in Fig. 5b. The spectrum shows minima wave numbers corresponding to different mineral groups, e.g. iron oxides (~650–500 cm-1), iron sulphides (~450 cm-1) and OM (~2960–2860 cm-1,~1200 cm-1), among others. It is worth mentioning that the presence of OM should not be expected in this magnetic extract because OM would produce a diamagnetic signal and because of the previous ultrasonic disaggregation of the sediments in suspension. This suggests that the observed OM must be associated with the magnetic minerals.
Magnetic extract (sample LAS-6) from a profundal area in Lake Anónima. a. X-ray diffraction spectra indicate the presence of: magnetite (Mag; Fe3O4), maghaemite (Mgh; γ-Fe2O3), haematite (Hem; α-Fe2O3), greigite (Grg; Fe3S4), ilmenite (Ilm), quartz (Qtz), feldspar (Fs), chlorite (Chl). b. Fourier transform infrared spectra indicate the presence of clays (~3430 cm-1), organic matter (~2960–2860 cm-1,~1200 cm-1), siliciclastic material (~1020 cm-1), iron oxides (~650–500 cm-1) and iron sulphides (~450 cm-1).

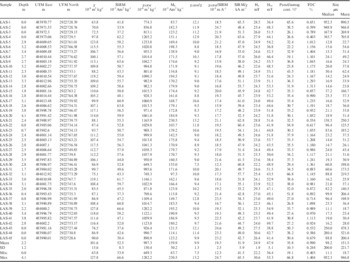
These results confirm the dominance of ferrimagnetic minerals as interpreted from IRM studies (Table II). Hcr was characteristic of magnetite and greigite minerals at 36.4–55.3 mT (mean: 47.9±5.1 mT). In addition, SIRM/χ ranged between 41.9–67.8 kA m-1, such high values may indicate the presence of greigite (SIRM/χ>40 kA m-1) and/or very fine magnetite. The S-ratio indicates the relative presence of ferrimagnetic (e.g. magnetite, titanomagnetite, maghaemite or greigite) versus antiferromagnetic materials (e.g. haematite or goethite). The sediment sample from LA have S-ratio values close to 0.90, corresponding to the predominance of ferrimagnetic minerals.
Collection sites, magnetic parameters, total organic carbon (TOC) and grain size analyses of sediment samples from Lake Anónima, Vega Island.
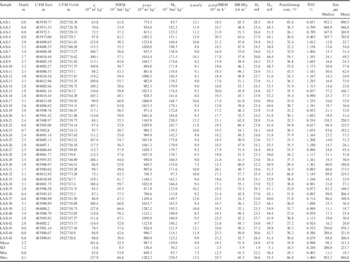
a Relative contribution of paramagnetic and diamagnetic minerals.
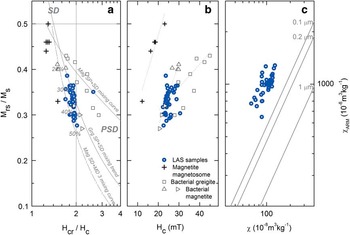
Magnetic hysteresis results (Table II) are represented in the Day plot and show that magnetite and greigite tend towards the single-domain (SD) size region (Fig. 6a). The LA data lie between mixing curves for SD+MD (multi-domain) mixtures of magnetite (mixing curve 3) and for SD+SP (superparamagnetic) mixtures of greigite (mixing trend). The χARM/χ-ratio is a grain size sensitive parameter, with values of χARM/χ>5 indicating the presence of magnetite grains of ≤0.1 μm (Peters & Dekkers Reference Peters and Dekkers2003), which is also observed on the King’s plot (Fig. 6c).
Magnetic granulometry for sediment from Lake Anónima. a. Day plot with domain state regions and mixing lines for SD+MD and SP+SD mixtures of magnetite (Mag; modified from Dunlop Reference Dunlop2002), and mixing trend for SP+SD mixtures of greigite (Grg; Roberts et al. Reference Roberts, Chang, Rowan, Horng and Florindo2011). b. Biplot of Hc vs Mrs/Ms with the dotted lines indicating the trend for magnetite magnetosome (Fischer et al. Reference Fischer, Mastrogiacomo, Loeffler, Warthmann, Weidler and Gehring2008, Li et al. Reference Li, Pan, Liu, Qin, Deng, Che and Yang2010), bacterial magnetite in lake sediments (triangles: Snowball Reference Snowball1994, triangles pointing right: Pan et al. Reference Pan, Petersen, Davila, Zhang, Winklhofer, Liu, Hanzlik and Zhu2005) and bacterial greigite in laminated sapropels (Reinholdsson et al. Reference Reinholdsson, Snowball, Zillén, Lenz and Conley2013). c. χ vs χARM variation for sediment samples from Lake Anónima with lines of constant grain size of magnetite minerals (King et al. Reference King, Banerjee, Marvin and Özdemir1982). MD=multidomain, PSD=pseudo-single-domain, SD=single-domain, SP=superparamagnetic.

Statistical classification of sediment samples
Grain size analysis indicated variations in mean, median and mode values, thus the sediments were classified into four granulometric groups: coarse–medium sand D (n=6), fine–very fine sand C–B (n=8), coarse–medium silt A5–A4 (n=17) and fine–very fine silt A3–A2 (n=14). A Kruskal–Wallis test was performed to determine if there are differences in magnetic properties between these four groups. A non-parametric test was used because the normality assumption was rejected (Shapiro–Wilk’s test) for all magnetic variables. The results show that there are significant differences (P<0.05) between fraction groups using magnetic concentration dependent variables (χ, SIRM and Ms), magnetic grain size dependent variables (χARM/χ and χARM/SIRM) and magnetic mineralogy dependent variables (Hc). Significant between-group differences were also seen for TOC and water depth (P<0.05) (Table III).
Multivariate comparison test after Kruskal–Wallis test. The granulometric groups for sediments are: coarse–medium sand D (>250 μm), fine–very fine sand C–B (63–250 μm), coarse–medium silt A5–A4 (15.8–63 μm) and fine–very fine silt A3–A2 (3.9–15.6 μm). TRUE indicates that differences are larger than a critical value at the significance level of P=0.05.

After testing the contribution of magnetic and geochemical variables which show significant differences between groups, a multiple comparison test was performed (Table III). For all variables, there were no significant differences (P<0.05) between groups D and C–B and between groups A5–A4 and A3–A2. However, there were significant differences between C–B and A3–A2 (χ, SIRM, Ms, TOC, depth), C–B and A5–A4 (χ, depth), D and A3–A2 (χ, SIRM, Ms, χARM/χ, χARM/SIRM, Hc, TOC, depth), and D and A5–A4 (χ, χARM/χ, χARM/SIRM, Hc, TOC, depth). This result is interesting since it can be inferred that the clear differences in magnetic properties between these groups is related to the sand and silt fractions.
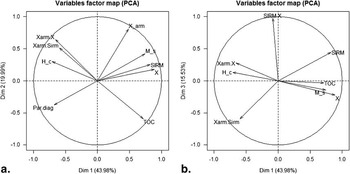
The KMO factor adequacy is 0.68, which indicates that it is appropriate to perform a PCA. The analysis yields a 79.5% variance explained by three principal components. The biplot shows an inverse relationship between χARM/χ, χARM/SIRM and Hc with TOC (Fig. 7a) and a direct relationship between the magnetic parameters χ, SIRM and Ms with TOC (Fig. 7b). There is a direct relationship between magnetic parameters of the same ‘magnetic category’ (i.e. concentration, size or mineralogy). The magnetic concentration dependent parameters χ, SIRM and Ms have an inverse relationship with parameters of the paramagnetic/diamagnetic contribution.
Principal component analysis (PCA) for Lake Anónima using magnetic and physicochemical variables. The PCA biplots show a. a direct relationship between χ, Ms and SIRM with total organic carbon (TOC) and b. an inverse relationship between χARM/χ, Hc and χARM/SIRM with TOC.

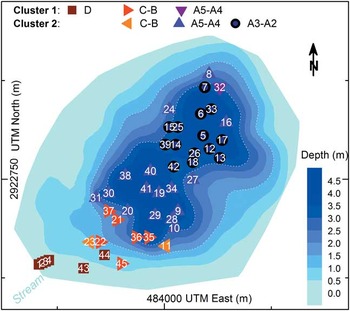
From this PCA result, a CA was performed using the magnetic variables in order to determine clusters of samples with similar magnetic features. As complementary information, the four grain size groups (D, C–B, A5–A4 and A3–A2) were used as additional variables. This way, the optimal partition of samples yielded two groups: cluster 1 composed of 13 samples of groups D (n=6), C–B (n=6) and A5–A4 (n=1), and cluster 2 composed of 32 samples of groups C–B (n=2), A5–A4 (n=16) and A3–A2 (n=14).
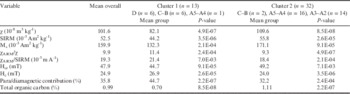
All variables used for the CA provide meaningful information for the partition of both clusters and are presented in Table IV. The samples corresponding to sand fractions (D and C–B, cluster 1) and silt fraction (A5–A4 and A3–A2, cluster 2; Table IV) are clearly differentiated in Fig. 8. Magnetic concentration dependent parameters characterize both clusters clearly; higher values are obtained for cluster 2. Regarding the magnetic mineralogy, cluster 1 has relatively finer magnetic grains than cluster 2, and relatively softer magnetic contribution (lower Hcr values) of ferrimagnetic minerals. In addition, the highest TOC values were observed in the cluster dominated by silt fractions (cluster 2).
Cluster analysis results for magnetic parameters and total organic carbon. There are two clusters of samples of coarse–fine sand fractions (cluster 1) and coarse–fine silt fractions (cluster 2).

Clusters of samples with similar magnetic features obtained from a non-hierarchical k-means cluster analysis.

Discussion
Ferrimagnetic minerals in Lake Anónima
The ferrimagnetic minerals identified in LA sediments may occur as primary detrital particles from volcanic rocks and as secondary minerals. Both components possibly coexist, but in general, sedimentary particles of primary origin are dominantly pseudo-single-domain (PSD) and MD (with grain sizes >1 μm). Smaller iron oxides (SP and SD particles) may be of primary origin and they are mostly embedded in host silicates (Ludwig et al. Reference Ludwig, Egli, Bishop, Chernenko, Frederichs, Rugel, Merchel and Orgeira2013). On the other hand, secondary ferrimagnetic minerals (such as magnetite and greigite) can form via bacterial assimilatory and dissimilatory processes, or purely inorganically as products of early diagenesis (Roberts et al. Reference Roberts, Chang, Rowan, Horng and Florindo2011, Lascu & Plank Reference Lascu and Plank2013). Such secondary ferrimagnetic particles in sediments are mostly SP and SD at room temperature (Ludwig et al. Reference Ludwig, Egli, Bishop, Chernenko, Frederichs, Rugel, Merchel and Orgeira2013). The magnetic analysis in LA reveals the dominance of SD ferrimagnetic minerals, which is in agreement with results obtained in sediment cores from lakes Buena and Roja, James Ross Archipelago, with similar physicochemical characteristics (Lecomte et al. Reference Lecomte, Vignoni, Córdoba, Chaparro, Chaparro, Kopalova, Gargiulo, Lirio, Irurzun and Böhnel2016). These lacustrine systems are located over glacial deposits with both local sedimentary (Cretaceous rocks) and volcanic (Tertiary volcanic rocks) composition. However, processes occurring in these lakes are associated with physicochemical changes (diagenesis of original minerals) and biological activity (cyanobacteria and algal photosynthesis; Nedbalova et al. Reference Nedbalova, Nývlt, Kopacek, Sobr and Elster2013) and they seem to produce different magnetic minerals. Among these minerals, iron sulphides (greigite) and iron oxides (magnetite and haematite) are identified not only by thermomagnetic studies and relevant magnetic parameters (e.g. Hcr, SIRM/χ), but also by XRD and FTIR studies (Fig. 5).
Magnetite is characterized by high magnetic stability and fine magnetic grain size (<0.1 μm, SD grains), similar to lake sediments where bacterial magnetite has been reported (Snowball Reference Snowball1994, Pan et al. Reference Pan, Petersen, Davila, Zhang, Winklhofer, Liu, Hanzlik and Zhu2005). A comparison of the magnetic domains and grain size studies for LA sediment and other lakes with bacterial magnetite and greigite is displayed in Fig. 6a & b. The presence of such biogenic ferrimagnetic minerals in LA is supported by the following arguments: i) the positive relationship between magnetic parameters with TOC, as also found in Swedish lake sediments (Snowball et al. Reference Snowball, Zillen and Sandgren2002), in Swiss and Russian lake sediments (Egli Reference Egli2004) and in North American lake sediments (Lascu & Plank Reference Lascu and Plank2013), and ii) the presence of OM probably associated with iron oxides as observed by FTIR spectrum in magnetic extracts (Fig. 5b). Moreover, the presence of magnetotactic bacteria (MTB), which synthesize high quality SD magnetite crystals (magnetosomes), may also be possible according to a recent study on lake sediments from Vega Island (Coria et al. Reference Coria, López, Lirio, Vignoni, Kopalová, Lecomte, Gargiulo, Chaparro, Vázquez, Dionisi, Lozada and MacCormack2015) where the MTB species Magnetospirillum magnetotacticum was identified from its protein mamA (magnetosome associated TPR-containing protein) using the nested polymerase chain reaction process.
Depositional environments
The littoral areas of the lake are dominated by basaltic blocks and gravel (Fig. 3b), whereas the deepest regions are characterized by silt/clay fractions that follow the lake bathymetry (Fig. 3c) In particular, the sand fractions are restricted to the south-west coast and are associated with the main stream and the development of a small delta (Fig. 3b). The CA, using meaningful magnetic parameters, grain size and TOC results in two clusters of samples that involve coarse–fine sand facies (cluster 1) and coarse–fine silt facies (cluster 2) allowing the definition of two principal recent depositional sub-environments in LA: i) the shoreline and littoral region and ii) the profundal or distal areas.
Such sub-environments are directly influenced by the dynamics of the main stream located in the south-west lake basin, the lake bottom morphology and the dynamic hydrological behaviour during summer as indicated by water level and shoreline contour changes (Fig. 1c). In addition, intense winds in this region generate strong wave action and it is assumed that this may provide an important influx of sediments (i.e. silt fraction) into the lake. Compositionally, the sediments in both sub-environments are dominated by siliciclastic material (~98.0%), whereas the non-siliciclastic material (<2.0%), dominated by OM (expressed as TOC), is mainly restricted to the deeper parts of the lake. The key spatial grain size characteristic of the lake sediments is not uniform in a direction parallel to the shoreline, but changes progressively from coarse to fine grains from the south-western shore towards the deepest areas (Figs 3a & 8). If complementary information regarding grain size composition is analysed it is possible to define two further sub-areas for each cluster. Cluster 1 can be divided into a deltaic area (a1) and a littoral area (a2), and cluster 2 can be divided into southern (b1) and northern (b2) profundal areas (see Fig. 8). There is a littoriprofundal transition area, not defined by the CA, that is characterized by the transition between coarse and fine sediments. These four sub-areas are summarized as follows.
The littoral area (a2) is characterized by the predominance of basaltic blocks and gravel, and steep slopes around the lake (see Fig. 3b). This region shows a high energy sedimentary environment, with particle entrainment occurring due to the action of waves and wave energy coupled with gravitational instability on a steeper slope. The deltaic area (a1) (predominantly made of sand), which is a relatively flat region restricted to the south-west part of the lake system, developed by the surface main stream inflow and sediment input, and is influenced by lake level fluctuations during summer and important wave dynamics. Such a dynamic behaviour in this sub-environment promotes the resuspension of finer clay–silt fractions to quieter areas (profundal accumulation areas). In cluster 1, a coarse sand fraction D is deposited near the coastline (a2) and fine sand fractions C–B prevail in the deltaic area (a1). These areas show a lower concentration of magnetic minerals and TOC content (Table IV, Figs 3d & 9).
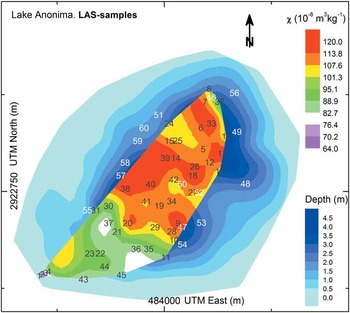
Distribution of magnetic susceptibility χ as a concentration parameter. The highest values are observed in profundal areas. Note the influence of a stream developing a delta on the south-west coast.

The profundal areas comprise the central and deepest parts of the lake. It is characterized by predominance of fine sediments, i.e. coarse silt fraction A5–A4 and fine silt fraction A3–A2. In this area, two depocenters were recognized with maximum water depths of 4.2 (southern profundal area, b1) and 4.6 m (northern profundal area, b2). Finer sediments are transported to these central zones due to a low energy sedimentary environment, whereas coarser grains are retained in shallower zones. The granulometric characteristics indicate that finer silt sediments (A3–A2) are deposited in the northern profundal area.
Consequently, the shoreline and littoral areas can be considered as regions of redistribution, erosion and transport, while profundal areas can be mainly considered as sediment accumulation areas.
Consideration of transport and depositional processes represented by the partitioned grain size components help to characterize changes in sedimentary sub-environments and thus enable the characterization of the spatial distribution. Variation trends of the clastic components indicate good correlations with observed magnetic properties. The magnetic concentration dependent parameters SIRM, Ms and χ indicate variable concentrations of ferrimagnetic material across the lake bottom (Fig. 9). The profundal areas of LA are characterized by higher concentrations of ferrimagnetic particles, in particular, such sediments show the highest values of magnetic concentration dependent parameters χ (109.6×10⁻⁸ m3 kg-1), Ms (171.1×10⁻³ Am2 kg-1), SIRM (55.8×10⁻³ Am2 kg-1), TOC (1.11%) and the magnetic mineralogy dependent parameter Hcr (49.2 mT), while the shoreline and littoral sediments show the lowest values for these parameters, i.e. χ=82.1×10⁻⁸ m3 kg-1, Ms=132.3×10⁻³ Am2 kg-1, SIRM=44.2×10⁻³ Am2 kg-1, TOC=0.70%, and Hcr=44.2 mT. The spatial distribution of median grain size, TOC and χ represented in Figs 3c, 3d, 8 & 9 show the influence of the stream that has developed a delta near the south-west coast of LA.
Thus, knowledge about the spatial distribution and control of magnetic properties and non-magnetic sedimentological components in this Antarctic lake provides a basis for new studies focusing on past environmental and climate changes using sedimentary sequences in this lake and areas at these latitudes.
Conclusions
Hydrological behaviour of LA results in strong lake level fluctuations during the summer, which may produce changes in sediment input and redistribution in the bottom of the lake. It presents a marked seasonal evolution, occurring during a short time interval of ~1 month, producing a reduction in the lake level and an increase in most dissolved elements. The main stream located on the south-west coast of the lake, basin morphology, water depths and the dynamic hydrological/hydrochemical behaviour during summer are the main factors controlling the distribution of the present-day surface sediments in this lacustrine system. Magnetic, geochemical and grain size variables indicate probable resuspension of littoral sediment due to sudden lake level changes during the summer followed by redistribution and accumulation in the deepest areas of the lake.
The magnetic signal of the LA sediments is dominated by ferrimagnetic minerals, such as magnetite and greigite, identified by thermomagnetic curves, magnetic hysteresis plots, relevant magnetic parameters (SIRM/χ=51.9±5.9 kA m-1 and Hcr=47.9±5.1 mT), and non-magnetic analyses including XRD and FTIR. Ferrimagnetic minerals seem to occur as primary detrital particles from volcanic rocks and as secondary minerals. Processes occurring in this lake are associated to diagenesis of original minerals and may also involve biological activity producing secondary magnetic minerals. The relationship between magnetic minerals with OM and its presence in magnetic extracts used for FTIR suggest the presence of biogenic ferrimagnetic minerals, although further studies are needed for confirmation. Ultra-fine ferrimagnetic minerals of SD grain size (<0.1 μm) are present as indicated by χARM/χ values of 9.9±1.3, and seem to be dominant in LA with higher concentration (e.g. χ=101.6±15.6×10⁻⁸ m3 kg-1 and SIRM=52.5±8.3×10⁻³ Am2 kg-1) relative to other lakes on Vega Island.
Results from the Kruskal–Wallis tests using magnetic variables (χ, SIRM, Ms, χARM/χ, χARM/SIRM and Hc), variables TOC and depth show significant (P<0.05) differences between four granulometric groups. Meaningful magnetic parameters and non-magnetic variables are separated by PCA. The CA identified two clusters of samples that involve deposition areas with coarse–fine sand facies (cluster 1) and coarse–fine silt facies (cluster 2), which defines two main recent depositional sub-environments in LA. The grain size distribution is useful to discriminate between the high energy areas (dominated by sand deposits from the main stream) and the low energy areas located in the interior of the lake (silt and clay fractions). In addition, these two clusters can be further divided by grain size, identifying four sub-environments in LA: deltaic area (a1), littoral area (a2), southern profundal area (b1) and northern profundal area (b2).
The characterization of recent lacustrine sediments present in LA is an important step towards understanding the geochemical and environmental processes occurring in Antarctic ecosystems. Thus, the sedimentological, geochemical and magnetic changes observed in LA sediments contribute to our understanding of the present-day lacustrine dynamic and sedimentary processes, and this information may be used for reconstructing past climates from lake sediment cores in the Antarctic region.
Acknowledgements
The authors wish to thank UNCPBA, UNC and UNAM, DNA, and Consejo Nacional de Investigaciones Científicas y Técnicas (CONICET) for their financial support. They also thank Ing. J. Escalante (Tech. CGEO-UNAM) and P. Zubeldia (Tech. CICPBA). The authors thank the Editor and two anonymous reviewers whose comments greatly improved the manuscript. This contribution was supported by the ANPCYT project PICTO-2010-0096 and by the Bilateral CONICET/CONACYT Project No. 207149 (Harald Böhnel) and Res. 1001/14-5131/15 (Marcos Chaparro).
Author contribution
Marcos Chaparro led the project and the sampling Antarctic campaign CAV-2012/2013, carried out magnetic measurements and was primarily responsible for data analysis and writing the manuscript. Mauro Chaparro and Francisco Córdoba participated in the sampling campaign, contributed to the manuscript preparation, made statistical analyses (MC) and analysed grain size/geochemical data (FC). Karina Lecomte contributed to the manuscript preparation, processed and discussed the hydrochemical and geochemical measurements. José Gargiulo and Nadia Manograsso Czalbowski partook in the sampling campaign, prepared sediment samples, carried out magnetic measurements (JG) and contributed with geological data (NMC). Ana Barrios and Araceli Lavat prepared magnetic extracts of sediment samples, carried out the XRD and FTIR studies and discussed the results. Gimena Urán prepared sediment samples for grain size and geochemical measurements and processed these results. Harald Böhnel contributed to manuscript preparation and data analysis.