
1. Introduction
When a descending liquid droplet collides with a solid surface whose temperature surpasses the boiling point of the liquid, a peculiar phenomenon may occur: the droplet, instead of making direct contact with the solid substrate, hovers above it, suspended by its own vapour. This entrapped vapour layer, trapped between the liquid droplet and the substrate, sustains elevated pressure levels due to the generation and compression of vapour during the impact event. This remarkable phenomenon is known as the Leidenfrost effect, initially observed by Leidenfrost (Reference Leidenfrost1756) and subsequently subjected to extensive investigation over the past two centuries. As the presence of vapour prevents direct contact between the droplet and the hot surface, it suppresses nucleate boiling, resulting in reduced heat transfer efficiency. This decreased heat transfer arises from the comparatively lower thermal conductivity of vapour compared with the liquid phase. The implications of this phenomenon on heat transfer are of paramount significance, particularly in various industrial applications such as spray cooling (Kim Reference Kim2017) and fuel injection in combustion engines (Moreira, Moita & Panao Reference Moreira, Moita and Panao2010), where Leidenfrost impact scenarios frequently occur. Therefore, it becomes imperative to gain a comprehensive understanding of the intricate dynamics governing the flow of vapour entrapped within the thin film, although a vast number of studies have provided clear understanding of different aspects of Leidenfrost droplets (Quéré Reference Quéré2013; Ajaev & Kabov Reference Ajaev and Kabov2021) such as oscillation (Ma & Burton Reference Ma and Burton2018; Bouillant et al. Reference Bouillant, Cohen, Clanet and Quere2021), transportation (Linke et al. Reference Linke, Alemán, Melling, Taormina, Francis, Dow-Hygelund, Narayanan, Taylor and Stout2006; Bouillant et al. Reference Bouillant, Mouterde, Bourrianne, Lagarde, Clanet and Quéré2018; Gauthier et al. Reference Gauthier, Diddens, Proville, Lohse and van der Meer2019) and bouncing (Celestini, Frisch & Pomeau Reference Celestini, Frisch and Pomeau2012; Lyu et al. Reference Lyu, Mathai, Wang, Sobac, Colinet, Lohse and Sun2019, Reference Lyu, Tan, Wakata, Yang, Law, Lohse and Sun2021; Graeber et al. Reference Graeber, Regulagadda, Hodel, Kuettel, Landolf, Schutzius and Poulikakos2021).
However, a substantial gap in our understanding persists, particularly concerning the dynamics underlying the initial and early stages of impact. It is important to note that this early stage refers to an extremely brief period, typically lasting just a few hundred microseconds before the vapour film reaches its minimum thickness. During this stage, the droplet rapidly approaches the substrate and undergoes substantial deformation due to the pressure within the gas or vapour cushion. This poses a formidable challenge in measuring the thickness of highly deformed vapour films in drop impact experiments. Fortunately, over the past two decades, significant advancements in optical measurement techniques have revolutionized our capabilities, enabling precise determination of the radial position and height of the gas cushion during the early impact phase. Consequently, these developments have facilitated quantitative analyses that were previously unattainable (Burton et al. Reference Burton, Sharpe, Van Der Veen, Franco and Nagel2012; Tran et al. Reference Tran, Staat, Prosperetti, Sun and Lohse2012; Staat et al. Reference Staat, Tran, Geerdink, Riboux, Sun, Gordillo and Lohse2015; Shirota et al. Reference Shirota, van, Michiel, Sun, Prosperetti and Lohse2016; van Limbeek et al. Reference van Limbeek, Shirota, Sleutel, Sun and Prosperetti2016; Van Limbeek et al. Reference van Limbeek, Klein Schaarsberg, Sobac, Rednikov, Sun, Colinet and Lohse2017; Lee et al. Reference Lee, Lee, Lee, Fezzaa and Je2018, Reference Lee, Harth, Rump, Kim, Lohse, Fezzaa and Je2020a,b; Chantelot & Lohse Reference Chantelot and Lohse2021; Gordillo & Riboux Reference Gordillo and Riboux2022). This progress in experimental techniques has greatly enhanced researchers’ capacity to unravel the intricacies of the vapour dynamics during Leidenfrost impacts, promoting investigations about the influence of various parameters, such as the falling velocity, substrate roughness and the physical properties of the liquid, on the dynamic Leidenfrost temperature, which is defined as the minimum substrate temperature required for droplet levitation. Notwithstanding these advancements, certain critical aspects of the quantitative description of the Leidenfrost phenomenon remain absent from experimental measurements. For example, data regarding the pressure distribution within the vapour layer and the evolution of curvature at the interface separating the droplet from the vapour phase are still lacking.
To bridge these knowledge gaps, numerical simulations have emerged as a valuable tool for uncovering comprehensive details about the kinematic and thermodynamic processes during the early-stage impact. Nevertheless, conducting direct numerical simulations (DNS) to replicate the Leidenfrost effect poses a formidable challenge that hinges on two critical aspects: the demand for an accurate phase-change model and the necessity for exceptionally fine grid resolution within the vapour layer. To the best of the authors’ knowledge, while a few simulations have been conducted in this context, the majority have primarily focused on the long-time deformation behaviour of liquid droplets or heat transfer characteristics between the interfaces (Villegas et al. Reference Villegas, Tanguy, Castanet, Caballina and Lemoine2017; Qiao et al. Reference Qiao, Zeng, Xie, Liu and Zhang2019; Wang et al. Reference Wang, Rong, Shen, Wang and Che2020; Yuan, Wei & Zhang Reference Yuan, Wei and Zhang2022). Limited attention has been dedicated to elucidating the nuances of the short-time dynamics inherent in the problem.
It is worth highlighting that the Leidenfrost effect is not confined solely to the droplet–solid substrate interaction but also manifests in the droplet–pool systems. Distinct differences in impact behaviours are observed in these scenarios (Maquet et al. Reference Maquet, Sobac, Darbois-Texier, Duchesne, Brandenbourger, Rednikov, Colinet and Dorbolo2016; Van Limbeek et al. Reference van Limbeek, Sobac, Rednikov and Colinet2019), attributed to the deformable nature of the pool surface in contrast to the rigidity of a flat solid substrate (Sobac et al. Reference Sobac, Rednikov, Dorbolo and Colinet2014). The presence of a deformed pool surface serves to suppress the onset of the chimney instability (Biance, Clanet & Quéré Reference Biance, Clanet and Quéré2003; Snoeijer, Brunet & Eggers Reference Snoeijer, Brunet and Eggers2009), especially when the droplet radius exceeds the capillary length. On the other hand, the liquid pool environment tends to eliminate potential surface roughness (Kim et al. Reference Kim, Truong, Buongiorno and Hu2011) that may present on a solid plate, thereby allowing the Leidenfrost state to persist even at relatively low degrees of superheat (Maquet et al. Reference Maquet, Sobac, Darbois-Texier, Duchesne, Brandenbourger, Rednikov, Colinet and Dorbolo2016). This divergence in behaviours within droplet–pool systems underscores the multifaceted nature of the Leidenfrost effect and the intricate interplay of physical parameters in such scenarios.
In the present study, our focus is directed towards the intricate short-time dynamics of a droplet impacting a superheated liquid pool. This specific scenario involves the deformation of both the droplet and the liquid pool, driven by the increasing pressure within the vapour layer. Our primary emphasis lies in tracking the temporal evolution of the minimum thickness of the thin vapour film, denoted as
 $h_{min }$
. This parameter holds particular significance as it plays a crucial role in determining whether the droplet will coalesce with the liquid pool or remain separate from it. The latter scenario ultimately culminates in the levitation of the droplet, which is a central phenomenon of interest. It is important to note that, even at ambient room temperature, in what is known as an isothermal impact, droplets with relatively low impact velocities may not coalesce with the liquid pool but instead rebound from it (Tang et al. Reference Tang, Saha, Law and Sun2016, Reference Tang, Saha, Law and Sun2018, Reference Tang, Saha, Law and Sun2019a,b). This behaviour disrupts and prevents interfacial contact between the droplet and the pool (Hicks & Purvis Reference Hicks and Purvis2011; Hendrix et al. Reference Hendrix, Bouwhuis, van der Meer, Lohse and Snoeijer2016; Mirjalili & Mani Reference Mirjalili and Mani2020). Therefore, it is of significant interest to explore how the evaporation flow influences the minimum thickness of the vapour cushion and the evolution of interface shapes. More notably, we endeavour to establish a conceptual link between the dynamics of isothermal impacts and that of Leidenfrost impacts, thereby enhancing our understanding of the intriguing interplay between these two phenomena.
In our pursuit of these investigations, we employ the DNS method, as previously developed and documented in our recent publication (Zhao, Zhang & Ni Reference Zhao, Zhang and Ni2022). A comprehensive introduction to this approach is presented in § 2 of this manuscript. This numerical methodology empowers us to conduct precise computations within the confined space of the thin film containing saturated vapour. Section 3 is dedicated to showcasing the numerical results corresponding to the early stage of the impact, shedding light on the transition from droplet levitation to contact under varying impact conditions, notably the falling velocity and the degree of superheat. These findings will yield valuable insights into the prediction of
 $h_{min }$
, the minimum film thickness. Furthermore, in § 4, we construct a theoretical model that takes into account the flow characteristics within both the liquid droplet and the thin vapour film. Within this framework, we uncover the existence of a capillary transition that impedes early contact between the droplet and the liquid pool, even in the high superheat regime. The scaling law derived from this model demonstrates excellent agreement with the numerical data, thus offering theoretical validation for our numerical findings. Finally, the conclusions are succinctly summarized in § 5, culminating in a comprehensive synthesis of our research contributions.
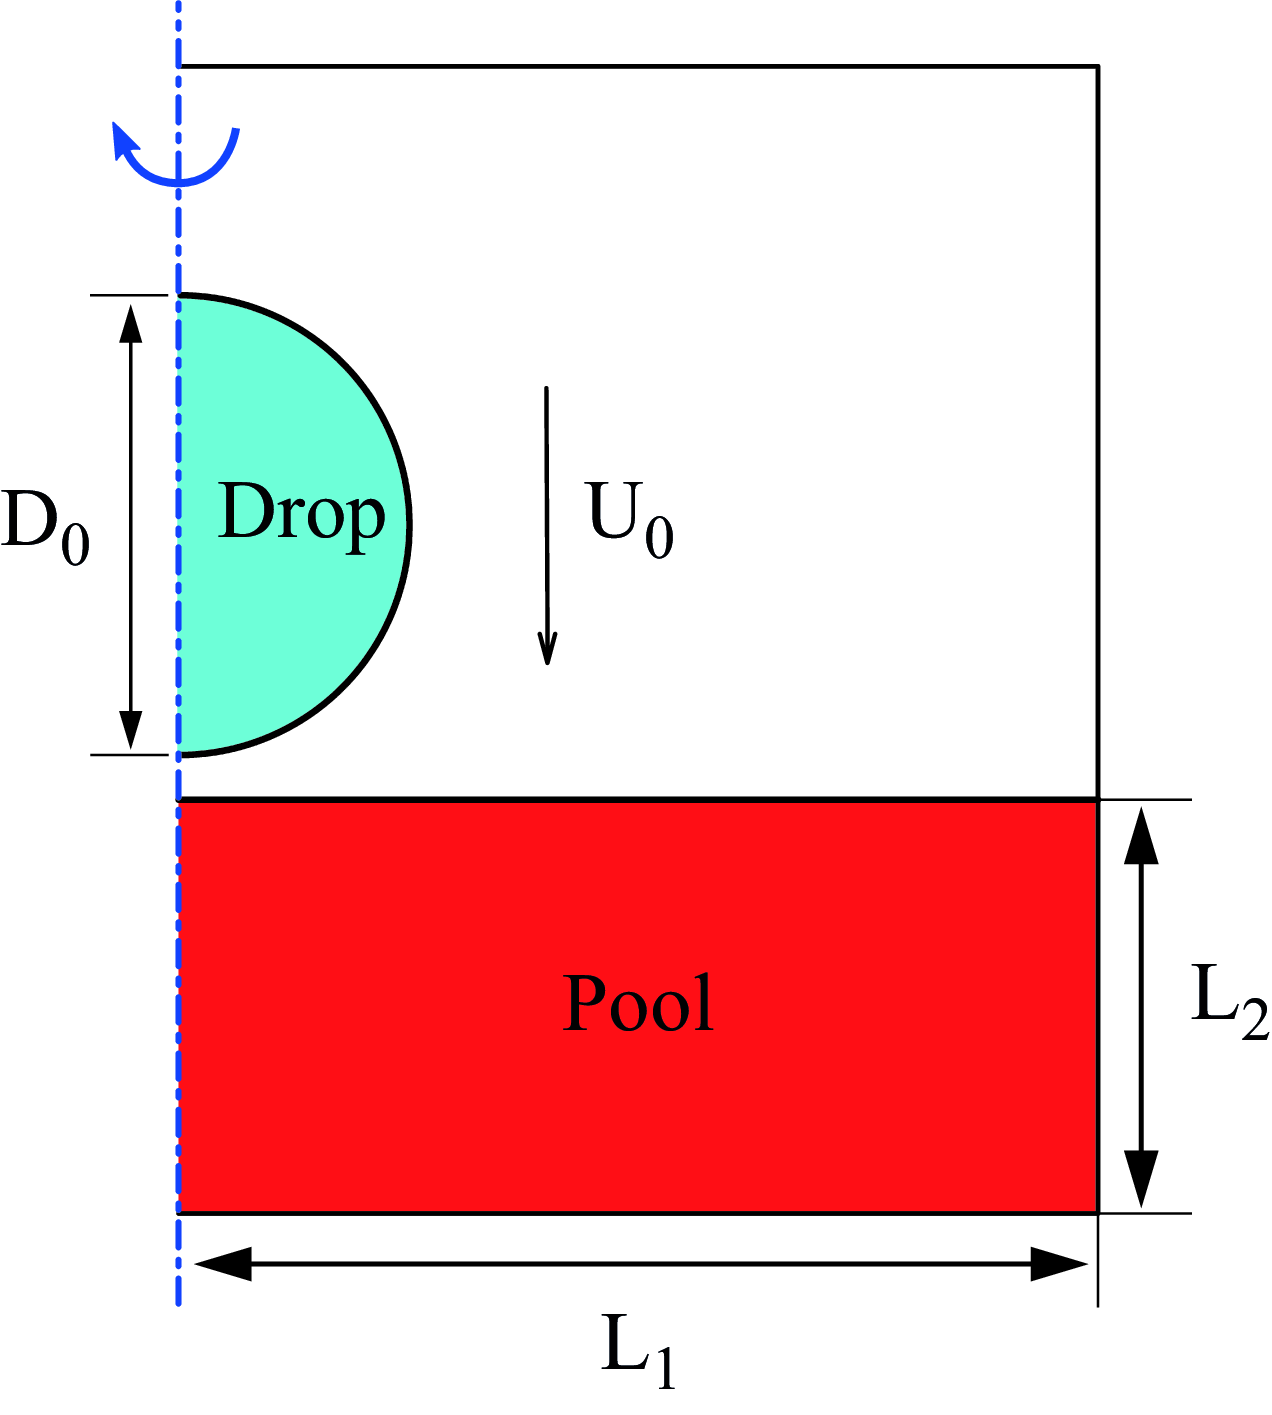
Physical model of an ethanol drop impacting onto the superheated pool of silicon oil.

2. Numerical model
2.1. Problem statement
The problem, as sketched in figure 1, involves a spherical droplet falling at a prescribed velocity
 $U_0$
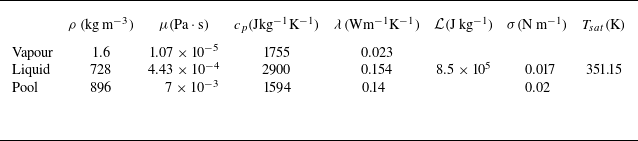
impacting a liquid pool with temperature exceeding the boiling point of the droplet. During this impact event, whether the droplet coalesces with or separates from the pool becomes a pivotal question, with the outcome of this scenario depends on the complex interplay of various thermodynamic and kinetic parameters inherent to the system. In our numerical simulations, we have chosen to model the droplet and pool using liquid ethanol and silicon oil, respectively, aligning with their widespread utilization in experimental investigations (Maquet et al. Reference Maquet, Sobac, Darbois-Texier, Duchesne, Brandenbourger, Rednikov, Colinet and Dorbolo2016; Sobac et al. Reference Sobac, Maquet, Duchesne, Machrafi, Rednikov, Dauby, Colinet and Dorbolo2020; Mogilevskiy Reference Mogilevskiy2020). Their physical properties, at the boiling temperature of ethanol, are presented in table 1, while their physical meanings will be illustrated in § 2.2. Specifically, the droplet is initialized with a diameter of
 $D_0 = 2R_0 = 2.4\, \mathrm {mm}$
, while the width and depth of the liquid pool are respectively of
 $L_1 = 6D_0$
and
 $L_2 = 4D_0$
. These dimensions of the computational domain are chosen deliberately to minimize the potential confinement effects arising from the boundaries. For the boundary conditions of the computational domain, we impose an outflow condition at the top, a symmetric condition at the right and a no-slip condition at the bottom. In addition, the impact velocity of the droplet is varied from
 $U_0 = 0.3$
to
 $0.5\, \mathrm {m\, s^-{^1}}$
. These velocities fall within the category of low impact velocity conditions and are selected for the following reasons. First, the compressibility effects become non-negligible when the impact velocity increases for a millimetre-sized droplet. Second, as
 $U_0$
increases further, the vapour film thickness may decreases to the scale of 100 nm, where intermolecular van der Waals forces and gas kinetic effects become significant. Addressing these effects lies beyond the scope of the current study. Besides, it is also important to note that, in the early stage of the impact, no azimuthal instability could be observed, and consequently, we favour an axisymmetrical cylindrical system as a suitable framework to investigate these three-dimensional problems, as also illustrated in figure 1.
The choice of using the ethanol/silicon oil system in our simulations is motivated by the desire to replicate experimental scenarios where the droplet evaporates at its boiling point (
 $T_{sat} = 351 \,\mathrm {K}$
), while the pool remains in a liquid state until a superheat of
 $\Delta T = T_p - T_{sat} \approx 200 \,\mathrm {K}$
is reached. It is noteworthy that we set the superheat over a broad range of
 $20 \,\mathrm {K} \lt \Delta T \lt 600 \,\mathrm {K}$
, which would lead to the boiling of the liquid pool in reality, however, we intentionally prescribe the silicon oil not to evaporate in numerical simulations. This deliberate choice allows us to observe and analyse the high mass flux induced by evaporation, significantly expanding the parameter space beyond what is feasible in experiments.
In addition to the thermodynamic conditions outlined above, we have made three other assumptions in our current numerical study. Firstly, we assume that the liquid pool maintains a constant temperature
 $T_p$
throughout the impact event, effectively eliminating any Marangoni effects. This assumption is justified by the brevity of the early impact stage, during which the temperature variation within the pool is negligible. Secondly, we suppose that the droplet remains at its boiling temperature during impact, simplifying our model by avoiding the use of more complex phase-change models. While this assumption results in the absence of thermal convection inside the droplet, it is consistent with widely used practices in previous research (Biance et al. Reference Biance, Clanet and Quéré2003; Sobac et al. Reference Sobac, Rednikov, Dorbolo and Colinet2014; Maquet et al. Reference Maquet, Sobac, Darbois-Texier, Duchesne, Brandenbourger, Rednikov, Colinet and Dorbolo2016; Qiao et al. Reference Qiao, Zeng, Xie, Liu and Zhang2019; Van Limbeek et al. Reference van Limbeek, Sobac, Rednikov and Colinet2019). It is important to clarify that this does not imply that the evaporation rate of the droplet remains constant; rather, the local mass flux is dependent on the local thermal flux, as detailed in § 2.2. Lastly, we prescribe the physical properties of the liquid/vapour/gas system to remain independent of temperature, in accordance with conventions in some prior studies (Biance et al. Reference Biance, Clanet and Quéré2003; Sobac et al. Reference Sobac, Rednikov, Dorbolo and Colinet2014; Maquet et al. Reference Maquet, Sobac, Darbois-Texier, Duchesne, Brandenbourger, Rednikov, Colinet and Dorbolo2016; Qiao et al. Reference Qiao, Zeng, Xie, Liu and Zhang2019; Van Limbeek et al. Reference van Limbeek, Sobac, Rednikov and Colinet2019). While this assumption poses challenges regarding vapour properties due to the broad temperature range examined in our current study, where properties such as vapour density may vary significantly, our primary focus remains on exploring the non-dimensional scalings that encapsulate the influence of various physical properties and initial conditions. Consequently, we investigate the same problem as long as identical dimensionless parameters are maintained in alignment with the experimental conditions. Additionally, this assumption allows us to isolate the effects of impact velocity
 $U_0$
and superheat
 $\Delta T$
in our numerical simulations. Thus, the data provided in table 1 are consistently utilized throughout our study.
Physical properties of the ethanol and silicon oil employed in the present numerical study. They are the density (
 $\rho$
), dynamic viscosity (
 $\mu$
), heat capacity (
 $c_p$
), thermal conductivity (
 $\lambda$
), latent heat (
 $\mathcal {L}$
), surface tension coefficient (
 $\sigma$
) and boiling point (
 $T_{sat}$
). Silicon oil pool does not boil.

2.2. Governing equations
In the context of the Leidenfrost impact, where a droplet interacts with a superheated pool, the fluid dynamics can be characterized as incompressible flow, particularly when focusing to the low impact velocity regime. This regime is governed by a set of fundamental equations derived from the principles of mass conservation, momentum conservation and energy conservation, in terms of
 \begin{equation} \nabla \cdot \boldsymbol {u} = \left(\frac {1}{\rho _v} - \frac {1}{\rho _l}\right)\dot m \delta _s ,\end{equation}
 \begin{equation} \rho \left ( \frac {\partial \boldsymbol {u}}{\partial t} + \boldsymbol {u} \cdot \nabla \boldsymbol {u} \right )=- \nabla p + \nabla \cdot \left ( \mu \left ( \nabla \boldsymbol {u} + \nabla \boldsymbol {u} ^T\right ) \right ) + \rho \boldsymbol {g} + \sigma \kappa \delta _s \boldsymbol {n}, \end{equation}
 \begin{equation} \rho c_p \left ( \frac {\partial T}{\partial t} + \boldsymbol {u} \cdot \nabla T \right )= \nabla \cdot \left ( \lambda \nabla T \right ), \end{equation}
where
 $\boldsymbol {u}$
(m s–1) is the fluid velocity,
 $\dot m$
(
 $\mathrm {kg\, m^-{^2}\, s^-{^1}}$
) indicates the mass flux in the presence of phase change and
 $\rho$
(
 $\mathrm {kg\, m^-{^3}}$
) is the density, with subscripts
 $v$
and
 $l$
referring to vapour and liquid phases, respectively. In addition,
 $p$
(Pa) is the pressure,
 $\mu$
(
 $\mathrm {Pa \cdot s}$
) is the dynamic viscosity and
 $\boldsymbol {g}$
(
 $\mathrm {m\, s^-{^2}}$
) denotes the gravitational acceleration. The last term on the right-hand side of (2.2) stands for the surface tension force. The symbols
 $\sigma$
,
 $\kappa$
,
 $\delta _s$
and
 $\boldsymbol {n}$
pertain to surface tension coefficient, interface curvature, Dirac distribution function and normal vector of the interface, respectively. As mentioned previously,
 $\sigma$
is assumed to be constant in the present studyso that we do not consider any Marangoni effect. In the energy equation, the viscous dissipation term is ignored because it is much smaller than the heat conduction term. We define
 $T$
(K) as the temperature field and
 $c_p$
(
 $\mathrm {J kg^{-1} K^{-1}}$
) and
 $\lambda$
(
 $\mathrm {W m^{-1} K^{-1}}$
) are the specific heat and the thermal conductivity of the corresponding fluid, respectively. Their respective values for the ethanol and the silicon oil are listed in table 1. To accurately track the interfaces between the droplet/vapour and the pool/vapour, we employ the geometrical volume-of-fluid (VOF) method, which relies on the advection equation
 \begin{equation} \frac {\partial C}{ \partial t} + \boldsymbol {u}_\Gamma \cdot \nabla C = 0 ,\end{equation}
with
 $C$
representing the volume fraction of one phase and
 $\boldsymbol {u}_\Gamma$
implying the velocity of the interface, which is denoted by
 $\Gamma$
. It is essential to note that
 $\boldsymbol {u}_\Gamma$
should not be confused with the local velocity of the flow field due to the discontinuous conditions across the interface in the presence of phase change, and we will elucidate them very soon. An additional critical consideration in our simulations is the treatment of vapour transport. Specifically, we do not account for the transport of vapour phases in the gas and assume that the gas phase is saturated with vapour, consistent with some findings in previous research (Biance et al. Reference Biance, Clanet and Quéré2003; Sobac et al. Reference Sobac, Rednikov, Dorbolo and Colinet2014; Maquet et al. Reference Maquet, Sobac, Darbois-Texier, Duchesne, Brandenbourger, Rednikov, Colinet and Dorbolo2016; Qiao et al. Reference Qiao, Zeng, Xie, Liu and Zhang2019; Van Limbeek et al. Reference van Limbeek, Sobac, Rednikov and Colinet2019). This simplification is based on the assumption that the boiling process occurs at the lower interface of the droplet within an extremely short timespan during the initial falling stage (Castanet et al. Reference Castanet, Chaze, Caballina, Collignon and Lemoine2018; Chantelot & Lohse Reference Chantelot and Lohse2021; Gordillo & Riboux Reference Gordillo and Riboux2022). The intense phase change characterized by boiling at the lower surface of the droplet generates substantial ethanol vapour, which disperses radially and effectively fills the void between the droplet and the liquid pool. Consequently, the concentration of vapour within the thin film approaches nearly 100 %. While this simplification may pose challenges in regions distant from the vapour film, the significantly lower evaporation rate in those areas renders this concern negligible. More discussions about this assumption are provided in Appendix D.
In addition to the governing equations (2.1)–(2.4), the phase change brings about significant discontinuities across the interface, primarily driven by the mass flux induced during boiling. The mass flux, denoted as
 $\dot {m}$
, leads to the following jump conditions:
 \begin{equation} \left [ \boldsymbol {u} \cdot \boldsymbol {n} \right ]_{\Gamma } = \dot m \left [ \frac {1}{\rho }\right ]_{\Gamma },\end{equation}
 \begin{equation} \left [ \lambda \nabla T \cdot \boldsymbol {n} \right ]_{\Gamma } = \dot m \mathcal {L} .\end{equation}
Here, the operator
 $[\cdot ]_{\Gamma }$
defines the jump conditions at the interface, where
 $[ \boldsymbol {\Phi }]_{\Gamma } = (\boldsymbol {\Phi }_{l} - \boldsymbol {\Phi }_{v})$
. In this context,
 $\boldsymbol {n}$
represents the normal direction of the local interface, and
 $\mathcal {L}$
(J kg–1) stands for the latent heat. It is important to note that, in our modelling, as previously stated, we assume that boiling occurs only on the droplet. Consequently, these equations imply that both the flow field and the thermal flux exhibit discontinuities across the droplet interface. Additionally, the mass flux can be computed from the jump in thermal flux as
 $\dot {m} = [\lambda \nabla T \cdot \boldsymbol {n} ]_{\Gamma }/ \mathcal {L}$
. Furthermore, an additional interfacial condition applies specifically to the droplet
 \begin{equation} T_\Gamma = T_{sat} .\end{equation}
This condition dictates that the droplet interface is maintained at the saturated temperature
 $T_{sat}$
throughout the numerical simulations, as previously supposed in § 2.1.
In the end, to gain deeper insight into the behaviour of the system, several dimensionless parameters can be defined based on (2.1)–(2.3). These dimensionless parameters include the Reynolds number, Weber number, Stokes number and the evaporation number, they are respectively given by
 \begin{equation} Re = \frac {\rho _lU_0R_0}{\mu _l} \quad We = \frac {\rho _lU_0^2R_0}{\sigma } \quad St = \frac {\rho _lU_0R_0}{\mu _v} \quad \mathcal {E} = \frac {\mu _v \lambda _v \Delta T}{\sigma \rho _v R_0 \mathcal {L}}. \end{equation}
Physically,
 $Re$
and
 $We$
represent the ratio of the inertial forces to the viscous forces and the Laplace pressure caused by surface tension within the drop, respectively,
 $St$
denotes the ratio between the inertial forces within the drop and the viscous forces in the surrounding gas and
 $\mathcal {E}$
is an extra dimensionless quantity defined by Sobac et al. (Reference Sobac, Rednikov, Dorbolo and Colinet2014) which is a variant of the capillary number based on an evaporation velocity scale in the study of Leidenfrost drops. These dimensionless parameters serve to characterize various behaviours of the Leidenfrost droplet, providing valuable insights into their physical interpretations and significance.
2.3. Numerical details
We employ the open-source solver known as Basilisk (Popinet Reference Popinet2009, Reference Popinet2014, Reference Popinet2015) to solve the governing (2.1)–(2.4). It is important to note that the original Basilisk can only simulate an isothermal impact, while an accurate phase-change module is implemented in our recent publication (Zhao et al. Reference Zhao, Zhang and Ni2022), hereafter referred to as ZZN. Basilisk is a well-established computational library, popularly used for its accuracy and reliability in interfacial flow simulations. It adopts a time-staggered approximate projection method to address the pressure-velocity coupling equations on a Cartesian system. For the momentum equations, Basilisk utilizes the Bell–Colella–Glaz (BCG) second-order scheme (Bell, Colella & Glaz Reference Bell, Colella and Glaz1989) to discretize the advection terms. Additionally, the diffusion term is discretized using a fully implicit scheme. These choices in discretization methods ensure the accurate and stable treatment of the relevant terms. Regarding the VOF advection equation, Basilisk employs a specialized approach based on an exactly mass-conserving and direction-splitting method, originally proposed by Weymouth & Yue (Reference Weymouth and Yue2010). The piecewise linear construction technique (Gueyffier et al. Reference Gueyffier, Li, Nadim, Scardovelli and Zaleski1999) is then adopted to update the positions of the interface. After that, material properties such as density and viscosity within a discretized control volume are updated using a volume-averaged approach, in terms of
 $\phi = \phi _{l} C + \phi _{v} (1 - C)$
, where
 $\phi _{l}$
and
 $\phi _{v}$
represent the properties in the liquid and vapour phases, respectively. Furthermore, an important and distinguishing feature of the Basilisk solver is its utilization of the adaptive mesh refinement technique. This allows for dynamic refinement of the computational mesh, ensuring that a fine grid resolution is concentrated in regions of interest, such as the vicinity of the droplet interface and the cushion region beneath the droplet. It is particularly valuable for capturing the intricate flow patterns that develop in the thin film between the droplet and pool when they approach each other closely.
To simulate the Leidenfrost effect, where phase change occurs on the droplet during its approach towards the liquid pool, it is actually a computational challenge arising from the demand to accurately resolve the thin film that forms between the bottom of the droplet and the pool. Within this film, saturated vapour exists, characterized by significant temperature and velocity gradients. In the present study, we have developed a precise and robust numerical methodology, which is implemented into the Basilisk framework to solve the complete set of equations governing evaporation phenomena. A comprehensive description of this numerical approach can be found in ZZN. The distinguished feature of this approach is that it divides the computational domain into separate regions for liquid and vapour, which enables us to impose accurate jump conditions (2.5)–(2.7) for heat and mass transfers across the sharp interface, ensuring an authentic representation of the physical discontinuity. In addition, we employ a geometrical direction-splitting scheme, rather than the original BCG scheme, to discretize the advection term of the temperature equation (see (2.3)). This treatment aligns with the VOF discretization method previously mentioned, and it has better performance to maintain numerical accuracy and stability. Furthermore, our approach involves the utilization of the reconstructed interface, a crucial element that enhances our ability to resolve the diffusion term in (2.3). This is achieved through the implementation of the embedded boundary method, which enables us to address the interfacial conditions for the diffusion term with high accuracy. ZZN have shown that such a sharp treatment is essential for capturing the elaborate thermal dynamics of the Leidenfrost effect, particularly in regions with large gradients in the thin film region.
In our previous work (referred to as ZZN), we have extensively demonstrated the capabilities of our numerical method in accurately simulating the levitation of a Leidenfrost droplet above a superheated plate or liquid pool. This validation was achieved by comparing our numerical solutions with experimental data (Park & Kim Reference Park and Kim2020) and theoretical models (Maquet et al. Reference Maquet, Sobac, Darbois-Texier, Duchesne, Brandenbourger, Rednikov, Colinet and Dorbolo2016). Therefore, we do not intend to reproduce those comparisons here, and the detailed validations can be found in §§ 4.7 and 4.8 of the aforementioned paper. In the present study, particular attention is given to the grid independence study since the simulations require very fine mesh resolutions to capture the vapour dynamics in the thin film region, which is of the order of 1
 $\mathrm {\mu m}$
compared with the millimetre-sized droplet. Specifically, we find that our numerical results converge at an exceptionally high spatial resolution of
 $\Delta _{min } = L/ 2{^N}$
, with
 $\Delta _{min }$
being the size of the smallest mesh in the vicinity of the droplet/pool interface and
 $N = 18$
denoting the level of the smallest mesh (where
 $0$
corresponds to the top parent mesh). This implies that
 $\Delta _{min }$
approaches an ultra-fine scale of
 $50\,\mathrm {nm}$
, and correspondingly, approximately
 $4 \times 10^4$
meshes are distributed along the droplet diameter if the computational region is discretized with uniform grids, which highlights the necessity of employing an adaptive mesh approach in our present study. This mesh independence study can be found in § 3 (see figure 3). It is crucial to emphasize that, as the droplet approaches the liquid pool, there is always a minimum of 16 such fine grid cells located between them. This robustly confirms that the vapour film thickness in our numerical simulations never falls below 800 nm. Consequently, the dominance of van der Waals forces does not come into play, and numerical coalescence does not occur. As a result, our simulations can faithfully and accurately capture the entire spectrum of flow phenomena.
3. Numerical results
In this section, we present the primary outcomes of our numerical simulations, exploring variations in the parameters
 $U_0$
and
 $\Delta T$
. Note that, for the sake of better reproducibility by other experimentalists or numerical modellers, we will primarily use dimensional values of
 $U_0$
and
 $\Delta T$
instead of
 $We$
and
 $\mathcal {E}$
throughout this manuscript unless otherwise stated. Our simulations consider an initial separation distance of
 $H_0 = 200\,\mathrm {\mu m}$
, which is measured from the bottom of the droplet to the surface level of the pool. The selection of
 $H_0$
ensures that the initial lubrication pressure generated in the gas film between the droplet and the pool is negligible when compared with the pressure inside the droplet. According to lubrication theory, the pressure inside the gas film scales as
 $P_g \sim \mu _v R_0U_0/{H_0{^2}}$
, while the pressure within the liquid phase scales as
 $P_l \sim \rho _lU_0^2$
. Consequently, the ratio between these pressures, expressed as
 $P_g/P_l$
, scales as
 $(R_0/ H_0)^2/ St$
, which remains consistently below
 $0.06$
in our study. Given the smallness of the ratio
 $P_g/ P_l$
, we firmly conclude that the initial separation distance
 $H_0$
is sufficiently large, and it does not introduce any significant effects or perturbations to the behaviour of the droplet at the initialization. Since we do not simulate the transportation of vapour in the gas phase, it is important to note that, in the following sections, we will not draw a clean distinction between gas pressure (
 $P_g$
) and vapour pressure (
 $P_v$
) in the Leidenfrost cases.
As the droplet progressively approaches the surface of the pool, the effect of evaporation emerges. This leads to a significant increase in the vapour pressure within the thin film between the droplet and the pool. Consequently, the droplet begins to undergo gradual deformation. In order to obtain deeper insight into this deformation process, we pay more close attention to figure 2, which corresponds to a specific scenario characterized by
 $U_0 = 0.394\,\mathrm {m\, s{^-{^1}}}$
and
 $\Delta T = 40\,\mathrm {K}$
(in dimensionless terms,
 $We = 8$
and
 $\mathcal {E} = 3.55 \times 10^{-7}$
). In this context, we define
 $h_{r,+}$
and
 $h_{r,-}$
to represent the interface height of drop and pool relative to the initially quiescent pool surface, with
 $r$
denoting the radial position. Consequently, the thickness of the gas/vapour film at
 $r$
is calculated as
 $h (r) = h_{r,+} - h_{r,-}$
. We closely monitor the evolution of this thickness along the radial direction and identify the instant minimum thickness, denoted as
 $h_{min }(t)$
, whose location is named the ‘spreading front’.
Time evolution of the Leidenfrost impact for the case of
 $U_0 = 0.394\, \mathrm {m\, s{^-{^1}}}$
and
 $\Delta T = 40 \,\mathrm {K}$
(in dimensionless terms,
 $We = 8$
and
 $\mathcal {E} = 3.55 \times 10^{-7}$
). (a) Interfaces shapes at t = 0, 0.3, 0.36, 0.5 ms; (b) thickness of the vapour layer defined as
 $h (r) = h_{r,+} - h_{r,-}$
, with
 $h_{r,+}$
and
 $h_{r,-}$
representing the interface height of drop and pool relative to the initially quiescent pool surface; (c) corresponding pressure distribution inside the vapour layer. In (b) and (c), different colours correspond to the results at t = 0.32, 0.345, 0.36, 0.375, 0.39, 0.41, 0.44, 0.47 ms, and the triangles correspond to the location of
 $h_{min }(t)$
.

Mesh independence study for the case of
 $U_0 = 0.394\, \mathrm {m\, s{^-{^1}}}$
and
 $\Delta T = 40 \,\mathrm {K}$
. Time evolution of (a) minimum vapour thickness
 $h_{min }(t)$
and (b) maximum vapour pressure
 $P_{max}(t)$
on different meshes. Level-
 $N$
indicates the mesh has a size of
 $\Delta _{min } = L/ 2{^N}$
in the vapour film, with
 $N$
denoting the mesh level and
 $L$
the domain size. The inset in (a) shows the mesh distributions in the thin film region corresponding to the grid level of
 $N = 18$
, while the last two refinement levels of the actual grid (
 $N = 17, 18$
), within the thin film, have not been displayed to improve readability.

In figure 2(a), we clearly observe the vapour film forming between the interfaces while the spreading front deviates from the axis and moves radially as the droplet approaches the liquid pool. Then, for a quantitative perspective, figure 2(b) provides a time series of
 $h (r)$
, and it vividly illustrates the morphological evolution of the vapour film as the droplet decelerates vertically. In particularly, it can be seen that
 $h_{min }(t)$
, indicated by open triangle, decreases from
 $6.5\,\mathrm{\mu m}$
at
 $t = 0.32\, \rm ms$
to
 $1\,\mathrm {\mu m}$
at around
 $t = 0.36\, \rm ms$
before experiencing a slight increase in the subsequent stage. Additionally, figure 2(c) depicts the pressure distribution within the thin film along the radial direction. It is important to note that the pressure is interpolated at the location of
 $(r, (h_{r,+} - h_{r,-})/2)$
, recognizing that the deviation of vapour pressure from
 $(r, h_{r,-})$
to
 $(r, h_{r,+})$
can be ignored. The image clearly illustrates that the instant maximum pressure, denoted as
 $p_{max }(t)$
, consistently aligns with the spreading front, corroborating findings from previous studies (Mani, Mandre & Brenner Reference Mani, Mandre and Brenner2010; Hicks & Purvis Reference Hicks and Purvis2011; Hendrix et al. Reference Hendrix, Bouwhuis, van der Meer, Lohse and Snoeijer2016; Mirjalili & Mani Reference Mirjalili and Mani2020).
Additionally, figure 3 presents detailed numerical data illustrating the time evolution of
 $h_{min }(t)$
and
 $p_{max }(t)$
across different spatial resolutions, demonstrating convergence at a grid level of
 $N = 18$
for this specific impact scenario. It is evident that the minimum film thickness, denoted as
 $h_{min } = min (h_{min }(t))$
, occurs around
 $t = 0.365\, \mathrm {ms}$
, coinciding closely with the maximum vapour pressure, represented as
 $p_{max } = max (p_{max }(t))$
. This correlation underscores the strong relationship between
 $h_{min }(t)$
and
 $p_{max }(t)$
. Particularly, the inset in figure 3(a) illustrates the mesh distributions in the thin film region corresponding to the grid level of
 $N = 18$
. The last two refinement levels of the actual grid (
 $N = 17, 18$
) within the thin film have been omitted from the figure for improved readability. It is noteworthy that, for higher superheat cases, specifically when
 $\Delta T \gt 40 \,\mathrm {K}$
,
 $h_{min }$
increases, resulting in a greater number of meshes positioned within the thin vapour film.
Time evolution of the normalized radial position of the spreading front with different impact conditions. Points are numerical results obtained at
 $U_0 = 0.34, 0.37, 0.39, 0.42\, \mathrm {m\, s^-{^1}}$
and
 $\Delta T = 20, 80, 120, 200, 400\,\mathrm {K}$
, while the black dashed line shows the Wagner prediction
 $\sqrt {3(t - t_0)U_0/ R_0}$
.

Furthermore, we investigate the behaviour of the spreading front under various impact velocities (
 $U_0 = 0.34, 0.37, 0.39, 0.42\, \mathrm {m\, s{^-{^1}}}$
) and superheating conditions (
 $\Delta T = 20, 80, 120, 200, 400\,\mathrm {K}$
) (corresponding to
 $We = 6 {\sim} 10$
, and
 $\mathcal {E} = 1.77 \times 10^{-7} \sim 5.32 \times 10^{-6}$
in dimensionless terms). The results are presented in figure 4, which illustrates the dimensionless radial position of the spreading front (
 $r/ R_0$
) evolving as
 $\sqrt {3(t-t_0)U_0/ R_0}$
, where
 $t_0$
is the instant that spreading front start to deviate from the axis. This dynamic behaviour conforms to the well-established spreading dynamics observed in isothermal impacts (Riboux & Gordillo Reference Riboux and Gordillo2014; Philippi, Lagrée & Antkowiak Reference Philippi, Lagrée and Antkowiak2016), where the scaling law
 $r(t)/ R_0 = \sqrt {3U_0t/ R_0}$
was initially predicted by Wagner (Reference Wagner1932) for the radius of liquid-solid contact. Recent experimental findings by Shirota et al. (Reference Shirota, van, Michiel, Sun, Prosperetti and Lohse2016) and Chantelot & Lohse (Reference Chantelot and Lohse2021) in Leidenfrost impact against a superheated solid still support this prediction, aligning with the results presented here. Consequently, this behaviour implies that vapour generation within the thin film exerts limited influence on the radial dynamics of the liquid-gas interface at the spreading front. Additionally, still in figure 4, it should be noted that there is an inflexion at the reduced time
 $(t-t_0)U_0/R_0 \approx 0.015$
for all impact scenarios. This difference precisely corresponds to the moment that the thickness of vapour layer reaches its minimum at the spreading front. More details about the behaviour of the spreading front have been elaborated in Appendix B, where numerical results regarding the droplet impacting onto a solid substrate are also presented for comparison.
Evolution of the minimum film thickness
 $h_{min }$
under different impact conditions derived by varying
 $U_0$
and
 $\Delta T$
.

We now focus on the minimum film thickness
 $h_{min }$
under different impact conditions by varying
 $U_0$
and
 $\Delta T$
, and the results are displayed in figure 5. Notably, the minimum thickness never falls below
 $800\,\mathrm {nm}$
in our numerical simulations. It exhibits a strong inverse relationship with impact velocity while increasing with superheat. Figure 5(a) displays a carefully observed data collapse, suggesting a power-law decrease in
 $h_{min }$
with
 $U_0$
approximately following the correlation
 $h_{min }\propto U_0^{-2}$
. Interestingly, this slope mirrors the value experimentally predicted by Chantelot & Lohse (Reference Chantelot and Lohse2021) for Leidenfrost droplets impacting on a superheated solid. Additionally, this power-law decrease closely aligns with numerical predictions in isothermal cases, where the power-law relationship is characterized by
 $h_{min }\propto U_0^{-20/9}$
(Mani et al. Reference Mani, Mandre and Brenner2010). Figure 5(b) provides compelling evidence that, in the presence of heating in liquid pool, the minimum film thickness increases with superheat. Quantitatively, this observation suggests a power-law increase in
 $h_{min } \propto \Delta T^{1/10}$
in the moderate superheat regime (
 $20 \,\mathrm {K} \lt \Delta T \lt 100\,\mathrm {K}$
) and
 $h_{min } \propto \Delta T^{1/2}$
in the high superheat regime (
 $\Delta T \gt 300$
K). Remarkably, Chantelot & Lohse (Reference Chantelot and Lohse2021), in their experimental study of Leidenfrost droplets impacting a superheated solid wall, also derived a scaling law for the minimum vapour film thickness in the form of
 $h_{min }\propto \Delta T^{1/2}$
. Thus, our findings in the high superheated scenario align with their results, even though their solid substrate does not deform during the impact. To facilitate comparison, we also conducted simulations of Leidenfrost droplets impacting a superheated solid wall, and the results are presented in Appendix A. We still obtain the collapsed curve of
 $h_{min }\propto U_0^{-2} \Delta T^{1/2}$
(
 $h_{min }/R_0 \sim We^{-1} \mathcal {E}^{1/2}$
in dimensionless form) in the high superheat regime, and it strongly suggests that the correlation between
 $h_{min }$
and
 $(U_0, \Delta T)$
remains independent of the impacted substance, whether it is fully or partially non-slip and non-deformable.
As previously mentioned in § 1,
 $h_{min }$
serves as a crucial parameter in predicting whether the droplet will coalesce with or separate from the liquid pool in the early stage of impact. In the subsequent sections, we will delve into modelling the vapour film’s evolution theoretically. The insights gained from the neck of the film and the above-mentioned numerical results will illuminate the multiple mechanisms responsible for the observed scaling laws.
4. Discussions
In this section, we establish a theoretical model to predict the minimum thickness at the spreading front, specifically the correlation describing
 $h_{min } \sim f(U_0, \Delta T) \sim f(We, \mathcal {E})$
in the early stage of the impact. Our research builds upon the theoretical framework initially established by Mani et al. (Reference Mani, Mandre and Brenner2010) and further developed by Mirjalili & Mani (Reference Mirjalili and Mani2020) to describe isothermal impacts. More recently, Chantelot & Lohse (Reference Chantelot and Lohse2021) extended these models to encompass Leidenfrost impacts, considering the influences of vapour production. However, by incorporating a different hypothesis, the present work further examines and refines this theoretical framework to provide a more comprehensive set of scaling laws, in order to accurately predict the dynamic behaviours across the parameter spaces explored in the numerical simulations. To ensure continuity and consistency with these established theoretical models, our aim is to adapt and reproduce their equations for modelling liquid and vapour flows in our specific context, and ensure the seamless integration of our research into the broader body of knowledge in this field.
4.1. Establishment of the self-similar solutions for the early stage of impact
The governing equations for liquid and vapour flows can be simplified under certain key approximations. (i) Negligible viscosity: the liquid’s viscous terms can be safely neglected, primarily due to the high Reynolds number (
 $Re\sim O(10^3)$
) characteristic of the cases under investigation. This assumption effectively reduces the liquid phase to a potential flow, aligning with Helmholtz’s theorem. (ii) Young–Laplace Relation: the pressure difference between the droplet (
 $P_l$
) and the thin vapour film (
 $P_v$
) adheres to the Young–Laplace relation. (iii) Kinetic boundary condition: the advancement of the liquid interface is governed by the kinetic boundary condition. (iv) Lubrication theory: the vapour flow within the thin film can be effectively described using lubrication theory. This approximation is valid since the lateral length scale (
 $L = \sqrt {hR_0}$
) significantly exceeds the film thickness (
 $h$
), while remaining notably smaller than the curvature radius (
 $R_0$
) of the droplet. Besides, in the case of Leidenfrost impact, where boiling occurs at the bottom of the droplet, it is also essential to account for heat transfer and vapour effects in the lubrication equation. We incorporate these approximations into the modelling approach and obtain the following equations:
 \begin{equation} \nabla \cdot \boldsymbol {u} = 0 ,\end{equation}
 \begin{equation} \frac {\partial \boldsymbol {u}}{\partial t} + \frac {1}{2}\nabla \left | \boldsymbol {u}\right |^2 = - \frac {1}{\rho _l}\nabla P_l, \end{equation}
 \begin{equation} P_g + \sigma \kappa = P_l ,\end{equation}
 \begin{equation} \frac {\partial h^{\pm }}{\partial t} + u_{l}^{\pm } \frac {\partial h^{\pm }}{\partial x} = v_{l}^{\pm } ,\end{equation}
 \begin{equation} \frac {\partial h}{\partial t}=\frac {1}{r}\frac {\partial }{\partial r}\left (\frac {rh^{3}}{12 \mu _v} \frac {\partial P_{g}}{\partial r}\right ) - \frac {1}{r}\frac {\partial }{\partial r} \left ( \frac {rh \left (u^+ + u^- \right )}{2}\right ) + \frac {\lambda _v \Delta T}{\rho _v \mathcal {L} h}. \end{equation}
The isothermal parts of these equations are identical with those provided by Mani et al. (Reference Mani, Mandre and Brenner2010) and Mirjalili & Mani (Reference Mirjalili and Mani2020), while (4.5) incorporates the evaporation effect on the right-hand side. In brief, (4.1) is the continuity equation of the liquid phase, (4.2) describes the potential motion within the liquid droplet, (4.3) represents the balance between the surface tension force and the pressure difference across the boundary of the ethanol droplet, (4.4) is the kinematic boundary condition for the drop and pool surfaces and (4.5) characterizes the flow field in the thin film using the lubrication theory, which stems from the continuity in the vapour. The last term on the right-hand side of (4.5) accounts for evaporation, which involves balancing the heat flux with the released latent heat, as proposed by Sobac et al. (Reference Sobac, Rednikov, Dorbolo and Colinet2014) and Maquet et al. (Reference Maquet, Sobac, Darbois-Texier, Duchesne, Brandenbourger, Rednikov, Colinet and Dorbolo2016).
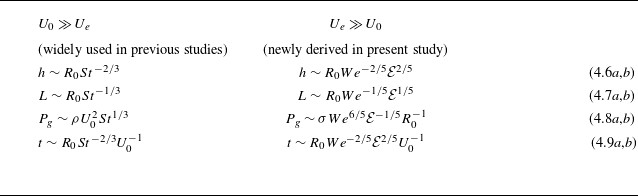
The characteristic scales of thickness, lateral length, pressure and time for different superheat regimes.

To ensure a consistent and standardized analysis, the selection of appropriate non-dimensional scales is paramount. In the initial falling stage, depicted in figure 2(a) where the minimum vapour film thickness remains near the axis (
 $t \lt 0.3\, \rm ms$
), the vapour pressure is conventionally scaled as
 $P_g \sim \mu _v R_0 U_0/ h^2$
based on lubrication theory. This characteristic scale has been widely employed in previous studies for both isothermal cases (Mani et al. Reference Mani, Mandre and Brenner2010; Mirjalili & Mani Reference Mirjalili and Mani2020) and Leidenfrost cases (Chantelot & Lohse Reference Chantelot and Lohse2021). However, we advocate a more rigorous approach by assuming
 $P_g \sim \mu _v R_0 (U_0 + U_e)/h^2 \sim \mu _v R_0 U_0 (1 + U_e/ U_0)/h^2$
for Leidenfrost impact problems. Here,
 $U_e = \lambda _v \Delta T/\rho _v h \mathcal {L}$
accounts for the additional effect of evaporation-induced velocity. Consequently, we obtain
 $P_g \sim \mu _v R_0 U_0/ h^2$
at low superheats (
 $U_0 \gg U_e$
), while it transforms into
 $P_g \sim \mu _v R_0 U_e /h{^2}$
at high superheats (
 $U_e \gg U_0$
). We will substantiate the rationale behind this inference in subsequent discussions.
Considering the necessity for deformation, where
 $\partial \boldsymbol {u}_l/\partial t \sim \nabla P_l/\rho _l \sim \nabla P_g/\rho _l$
, we can establish relevant scales for thickness, lateral length, pressure and time (see Appendix C for more details about the derivation process). It is noteworthy that these scales differ between impacts at low and high superheat regimes due to the distinct contributions of
 $P_g$
. Initially, for impacts in the low superheat regime (
 $U_0 \gg U_e$
), the scales converge with those from isothermal scenarios, as extensively documented in previous studies (Mani et al. Reference Mani, Mandre and Brenner2010; Hicks & Purvis Reference Hicks and Purvis2011; Bouwhuis et al. Reference Bouwhuis, van der Veen, Tran, Keij, Winkels, Peters, van der Meer, Sun, Snoeijer and Lohse2012), and are outlined in the left column of table 2. Conversely, in the high superheat regime (
 $U_e \gg U_0$
), where evaporation velocity dominates during the initial falling stage, we derive new scaling correlations, as presented in the right column of table 2. Notably, these characteristic scales deviate significantly from their isothermal counterparts. In order to confirm the presence of the high superheat regime and differentiate it from the conventionally established isothermal (or low superheat) regime, we calculate the evaporation-induced velocity
 $U_e$
with the thickness
 $h$
obtained from the numerical results. This velocity is then compared with the falling velocity
 $U_0$
for various impact conditions, as illustrated in figure 6. It is evident that, as the superheat increases above 200 K, marking the onset of the high superheat regime as depicted in figure 5(b), the ratio of
 $U_e/U_0$
is larger than 1, which means that the evaporation-induced velocity
 $U_e$
surpasses the falling velocity
 $U_0$
and the characteristic scale of thickness transforms to
 $h \sim R_{0}We^{-2/5}\mathcal {E}^{2/5}$
. Therefore, we can utilize the value of
 $U_e/U_0 = 1$
as a threshold to distinguish the two regimes. In addition, we will show in § 4.3 that, below this threshold, different characteristic scales of thickness should be adopted.
Ratio of the evaporation-induced velocity
 $U_e$
to the initial falling velocity
 $U_0$
under different impact conditions, and the threshold is
 $U_e/U_0 = 1$
to distinguish those two superheat regimes. Note that the vapour thickness
 $h$
is obtained from numerical results to determine the evaporation-induced velocity, given by
 $U_e = \lambda _v \Delta T/\rho _v h \mathcal {L}$
.

Numerical results depicting the minimum height of the central dimple (
 $h_d$
) at various impact conditions within the high superheat regime. (a) Illustrates the relationship between
 $h_d$
and
 $U_0$
for different
 $\Delta T$
values, while (b) shows the variation of
 $h_d$
with
 $\Delta T$
for different
 $U_0$
settings. The observed power-law behaviour closely aligns with the theoretical prediction in (4.6b), providing strong evidence that, in the high superheat regime, the evaporation term indeed becomes dominant during the initial falling stage.

Furthermore, according to (4.6b), if
 $U_e$
prevails over
 $U_0$
during the falling stage, we anticipate that the minimum central dimple height at the axis,
 $h_d$
, scales as
 $h_d \propto U_0^{-4/5}\Delta T^{2/5}$
. To validate this adjusted scaling hypothesis, we depict the numerical results of
 $h_d$
against
 $U_0$
and
 $\Delta T$
while varying the impact parameters in figure 7. Evidently, figure 7(a) discloses a power exponent governing
 $h_d \propto U_0^{-4/5}$
, while figure 7(b) demonstrates a discernible correlation of
 $h_d \propto \Delta T^{2/5}$
in the high superheat regime for
 $\Delta T \gt 200 \,\mathrm {K}$
. Consequently, these established correlations, substantiated by numerical data, affirm the validity of (4.6b), thereby validating the pressure scale of
 $P_g \sim \mu _v R_0 U_e/h^2$
in this regime.
4.2. Reconstruction of the self-similar solutions at high superheat regime
Recognizing that the impact problem in the early stage is featured by different sets of characteristic scales depending on the degree of superheats, we initially focus on the high superheat regime where evaporation significantly influence the behaviour of the thin vapour film. The governing equations (4.1)–(4.5) for liquid and vapour flows can be non-dimensionalized with the scaling relations of (4.6b)–(4.9b) as follows:
 \begin{equation} \frac {\partial \tilde {\boldsymbol {u}}}{\partial \tilde {t}} + We^{-3/5}\mathcal {E}^{1/5} \tilde {\nabla } \left | \tilde {\boldsymbol {u}}\right |^2 = -\tilde {\nabla } \tilde {P_l}, \end{equation}
 \begin{equation} \tilde {P_g} + We^{-6/5}\mathcal {E}^{1/5} \tilde {\kappa }= \tilde {P_l}, \end{equation}
 \begin{equation} \frac {\partial \tilde {h}^{\pm }}{\partial \tilde {t}} + We^{-3/5}\mathcal {E}^{1/5} \tilde {u}_{l}^{\pm } \frac {\partial \tilde {h}^{\pm }}{\partial \tilde {r}} = \tilde {v}_{l}^{\pm }, \end{equation}
 \begin{align} \frac {\partial \tilde {h}}{\partial \tilde {t}} &= \frac {St We^{-3/5}\mathcal {E}^{3/5}}{\tilde {r}}\frac {\partial }{\partial \tilde {r}}\left (\frac {\tilde {r}\tilde {h}^{3}}{12 } \frac {\partial \tilde {P}_{g}}{\partial \tilde {r}}\right )-\frac {We^{-3/5}\mathcal {E}^{1/5}}{\tilde {r}}\frac {\partial }{\partial \tilde {r}} \left ( \frac {\tilde {r}\tilde {h} \left (\tilde {u}^+ + \tilde {u}^- \right )}{2}\right )\nonumber\\[5pt] &\qquad + \frac {St We^{-3/5} \mathcal {E}^{3/5}}{\tilde {h}}, \end{align}
where the tilde symbol ‘
 $\sim$
’ is used to denote dimensionless variables.
Given that the impact problems under consideration generally exhibit high values of the Weber number (
 $We\sim O(10)$
) and small values of the evaporation number (
 $\mathcal {E}\sim O(10^{-6})$
), the second terms on the left sides of (4.10)–(4.12) can be safely disregarded. Additionally, the Stokes number is also very high (
 $St\sim O(10^5)$
), which results in
 $We^{-3/5} \mathcal {E}^{1/5} \ll St We^{-3/5} \mathcal {E}^{3/5} \sim O(1)$
. Consequently, the second term on the right-hand side of (4.13) is significantly smaller in comparison with the other terms. This allows us to derive the leading-order equations from the aforementioned equations
 \begin{equation} \frac {\partial \tilde {\phi }}{\partial \tilde {t}} = -\tilde {P}_l ,\end{equation}
 \begin{equation} \tilde {P}_g = \tilde {P}_l ,\end{equation}
 \begin{equation} \frac {\partial \tilde {h}}{\partial \tilde {t}} = c\frac {\partial \tilde {\phi } }{\partial \tilde {y}} ,\end{equation}
 \begin{equation} \frac {\partial \tilde {h}}{\partial \tilde {t}}=\frac {St We^{-3/5}\mathcal {E}^{3/5}}{\tilde {r}}\frac {\partial }{\partial \tilde {r}}\left (\frac {\tilde {r}\tilde {h}^{3}}{12 } \frac {\partial \tilde {P}_{g}}{\partial \tilde {r}}\right ) + \frac {St We^{-3/5}\mathcal {E}^{3/5}}{ \tilde {h}}, \end{equation}
where
 $\phi$
denotes the velocity potential such that
 $\boldsymbol {u} = \nabla \phi$
. The pre-factor
 $c$
in (4.16) depends on the material of the impacted substrate. Specifically, it takes a value of ‘1’ when a droplet impacts a solid substrate (Mani et al. Reference Mani, Mandre and Brenner2010; Duchemin & Josserand Reference Duchemin and Josserand2011) and ‘2’ when a droplet impacts the same liquid pool with low viscosity (Hendrix et al. Reference Hendrix, Bouwhuis, van der Meer, Lohse and Snoeijer2016; Mirjalili & Mani Reference Mirjalili and Mani2020). Given that the silicon oil pool has higher viscosity than the ethanol droplet, it is reasonable to assume that
 $c$
remains constant within the range of
 $1 \lt c \lt 2$
in our study. Importantly, the self-similar solutions established later are independent of the specific value of
 $c$
except for the prefactors, thus the particular value of
 $c$
is unimportant.
Since we are more concerned with the dynamics near the spreading front, the lubrication equation can be simplified further. It should be noticed that the squeezing term always poses
 $ {\partial h}/{\partial t} \lt 0$
due to the decreasing interface height, while the evaporation term
 $ {\lambda _v \Delta T}/{\rho _v \mathcal {L} h} \gt 0$
is set up due to continuous evaporation. Therefore, these two terms cannot be equivalent in (4.17). Moreover, from a physical standpoint, the increase in pressure within the vapour film results from the compression of film and evaporation production. Hence the pressure term should inherently balance either the compression or evaporation term in a simplified model; however, the latter two cannot be equated by neglecting the pressure term. As a consequence, a plausible conjecture emerges, suggesting that the evaporation-induced flow flux should be balanced by the pressure term in the high superheat regime. To support this hypothesis, we calculate the squeezing and evaporation terms appeared in (4.17) at
 $t = 0.36\, \rm ms$
for a case with
 $U_0 = 0.394\, \rm m\, s^-{^1}$
and
 $\Delta T = 400$
K (
 $We = 8$
and
 $\mathcal {E} = 3.55 \times 10^{-6}$
for dimensionless values), as shown in figure 8(a). The dashed line corresponds to the position of the spreading front. It is evident that the squeezing term is negligible at the neck region, while the evaporation term is significantly larger. Besides, our numerical data verify that the two terms have opposite signs around the location of spreading front. Furthermore, in figure 8(b), the temporal evolution of the absolute value of the ratio between the evaporation term and the squeezing term is depicted for various
 $\Delta T$
values at the spreading front. This representation illustrates that the evaporation term consistently dominates and becomes more significant at higher superheat conditions. Based on our numerical observations, it is reasonable to simplify (4.17) as follows:
 \begin{equation} -\frac {1}{\tilde {h}}=\frac {1}{\tilde {r}}\frac {\partial }{\partial \tilde {r}}\left (\frac {\tilde {r}\tilde {h}^{3}}{12 } \frac {\partial \tilde {P}_{g}}{\partial \tilde {r}}\right ), \end{equation}
which indicates the evaporation term balances the pressure term at the high superheat regime actually.
Comparison of the squeezing term
 ${\partial h}/{\partial t}$
(dash dotted line) and the evaporation term
 $({\lambda _v \Delta T})/({\rho _v \mathcal {L} h})$
(solid line) appearing in the lubrication equation (4.5). (a) Distribution of the two terms along the radial axis, corresponding to the particular case of
 $U_0 = 0.394\,\rm m\,s^{-1}$
,
 $\Delta T = 40\, \rm K$
at
 $t = 0.358\, \rm ms$
and
 $\Delta T = 400\, \rm K$
at
 $t = 0.36\, \rm ms$
, respectively, while the dashed line is the spreading front; (b) time evolution of the absolute value of the ratio between the two terms for various superheats of
 $\Delta T = 120, 400$
and
 $600$
K. It is clear that, near the spreading front, the evaporation term always dominates over the squeezing term while the two have opposite signs.

To find a self-similar solution at the spreading front, self-similar ansatze are widely adopted (Mani et al. Reference Mani, Mandre and Brenner2010; Duchemin & Josserand Reference Duchemin and Josserand2011; Mirjalili & Mani Reference Mirjalili and Mani2020; Chantelot & Lohse Reference Chantelot and Lohse2021). Such an ansatz provides self-similar expressions for the film thickness, vapour pressure and velocity potential, as denoted by the following equations:
 \begin{align} \tilde {h} \left (\tilde {r},\tilde {t} \right ) = \tilde {h}_{min }(\tilde {t}) H(\xi ), \quad \tilde {P}_g \left (\tilde {r},\tilde {t} \right ) = \tilde {P}_{max }(\tilde {t}) \Pi (\xi ), \quad \tilde {\phi } \left (\tilde {r},\tilde {y},\tilde {t} \right ) = \tilde {\phi }_{0}(\tilde {t}) \Phi (\xi , \eta ) .\end{align}
In these expressions,
 $\xi = (\tilde {r}-\tilde {r}_{0}(\tilde {t}))/\tilde {l}(\tilde {t})$
and
 $\eta = \tilde {y}/\tilde {l}(\tilde {t})$
represent self-similar variables in the neck region. Here,
 $\tilde {r}_0(\tilde {t})$
corresponds to the
 $r$
-coordinate of the spreading front, while
 $\tilde {l}(\tilde {t})$
signifies the horizontal length scale. It is important to note that the solution in the neck region exhibits wave-like characteristics to the leading order. For instance, the time derivatives of variable
 $\tilde {h} (\tilde {r},\tilde {t} )$
have three contributions as follows:
 \begin{equation} \frac {\partial \tilde {h}}{\partial \tilde {t}} = H(\xi )\frac {{\rm d} \tilde {h}_{min }(\tilde {t})}{{\rm d} \tilde {t}} - \frac {\xi \tilde {h}_{min }(\tilde {t})}{\tilde {l}(\tilde {t})} \frac {{\rm d} \tilde {l}(\tilde {t})}{{\rm d} \tilde {t}}\frac {{\rm d} H(\xi )}{{\rm d} \xi } - \frac {\tilde {h}_{min }(\tilde {t})}{\tilde {l}(\tilde {t})} \frac {{\rm d} \tilde {r}_0(\tilde {t})}{d \tilde {t}}\frac {{\rm d} H(\xi )}{{\rm d} \xi },\end{equation}
which correspond to the decrease in the minimum height, change of the horizontal length scale and radial movement of the spreading front, respectively. Mani et al. (Reference Mani, Mandre and Brenner2010) evaluated the relative size of these terms and find that the last advection term is dominant. Thus it can be hypothesized that the neck region is wave-like in character as
 $\partial \tilde {h}/ \partial \tilde {t} \approx -(\dot r_0 \tilde {h}_{min }/\tilde {l} )\partial H / \partial \xi \approx -\dot r_0 \partial \tilde {h} / \partial \tilde {r}$
, where
 $\dot r_0(t)$
represents the front velocity, and a similar proposal can also be used for the pressure and velocity potential fields. Consequently, temporal derivatives can be approximated using spatial derivatives, represented as
 $\partial / \partial \tilde {t} \approx -\dot r_0(\tilde {t})\partial / \partial \tilde {r}$
. Substituting these self-similar expressions into (4.14)–(4.16) and (4.18), we obtain the following scaling relationships:
 \begin{equation} \frac {\dot r_{0} \tilde {\phi }_0 (\tilde {t})}{\tilde {l}(\tilde {t})}\frac {\partial \Phi }{\partial \xi } = -\tilde {P}_{max }(\tilde {t}) \Pi,\end{equation}
 \begin{equation} \frac {\dot r_0 \tilde {h}_{min }(\tilde {t})}{\tilde {l}(\tilde {t})}\frac {\partial H}{\partial \xi } = c \frac {\tilde {\phi }_0(\tilde {t})}{\tilde {l}(\tilde {t})} \frac {\partial \Phi }{\partial \eta }, \end{equation}
 \begin{equation} - \frac {1}{H \tilde {h}_{min }(\tilde {t})} = \frac {\tilde {h}^3_{min }(\tilde {t}) \tilde {P}_{max }(\tilde {t})}{\tilde {l}^2(\tilde {t})}\frac {\partial }{\partial \xi }\left (\frac {H^{3}}{12 } \frac {\partial \Pi }{\partial \xi }\right ) .\end{equation}
By combining equations (4.21) to (4.23) and utilizing the method of separating variables, a set of scaling laws for the dimensionless maximum vapour pressure and the horizontal length scale can be derived
 \begin{equation} \tilde {P}_{max } \sim \tilde {h}_{min }^{-2/3} ,\end{equation}
 \begin{equation} \tilde {l} \sim \tilde {h}_{min }^{5/3} ,\end{equation}
 \begin{equation} \tilde {\kappa }_{max } \sim \tilde {h}_{min }/\tilde {l}^2 \sim \tilde {h}_{min }^{-7/3} .\end{equation}
Upon obtaining these self-similar solutions, figure 9 presents the values of
 $\tilde {P}_{max }$
and
 $\tilde {\kappa }_{max }$
for various impact conditions, varying
 $U_0$
and
 $\Delta T$
, in the high superheat regime. These dimensionless values, re-scaled according to the newly established scaling correlations (4.24) and (4.26), collapse onto single curves. Furthermore, an additional noteworthy observation emerges from the descending rate of the curve featured in figure 9, revealing a conspicuous correlation between
 $\tilde {P}_{max }$
,
 $\tilde {\kappa }_{max }$
and
 $\tilde {h}_{min }$
. In order to give a more quantitative comparison between the numerical results and the derived self-similar solutions, we also conduct a linear fit on the data presented in figure 9. In figure 9(a), the fit gives the exponent of
 $-0.7$
, aligning closely with the predicted value of
 $-2/3$
as outlined in (4.24). In figure 9(b), in contrast to the single exponent of
 $-7/3$
predicted by (4.26), we have to acknowledge that there is a change in the slope from
 $-2.1$
to
 $-2.55$
for the numerical results. Considering the complexity of the problem and the comprehensive inclusion of the neglected effects in our numerical simulations, such as inertia, viscosity and surface tension, these slight deviations are reasonable to some extent. Consequently, the self-similar solutions for
 $P_{max }$
and
 $\kappa _{max }$
exhibit a degree of credibility in the high superheat regime. Note that the above graph illustrates the correlation between one variable (
 $P_{max }(t)$
and
 $\kappa _{max }(t)$
) and another variable (
 $h_{min }(t)$
), with the initial input parameters (
 $U_0$
and
 $\Delta T$
) implicitly indicated in the results. We will then investigate the direct connection between the input and output quantities, referring to the context below as well as in figure 12.
Variation of maximum vapour pressure
 $P_{max }$
and maximum interfacial curvature
 $\kappa _{max }$
as functions of the minimum vapour thickness
 $h_{min }$
, all normalized using new scaling factors provided in the right column of table 2. These impact scenarios correspond to high superheat conditions, with
 $U_0 = 0.34, 0.37, 0.39, 0.42\, \mathrm {m\, s^-{^1}}$
and
 $\Delta T = 300, 400, 500, 600\,\mathrm {K}$
. Both panels exhibit a remarkable agreement, with numerical data collapsing onto single curves.

Next, we provide a prediction for
 $h_{min }$
in the high superheat regime. As the droplet approaches the liquid pool, the initially disregarded capillary pressure (
 $P_\sigma$
) at the spreading front, denoted as the second term on the left-hand side of (4.3), cannot be ignored. This is because the dimensionless curvature at the neck scales as
 $\tilde {\kappa }_{max } \sim \tilde {h}_{min }^{-7/3}$
while the dimensionless maximum pressure at the neck increases as
 $\tilde {P}_{max }\sim \tilde {h}_{min }^{-2/3}$
. Consequently, the growth rate of the capillary pressure (
 $\tilde {P}_{\sigma } \sim \tilde {\kappa }_{max } \sim \tilde {h}_{min }^{-7/3}$
) surpasses that of the maximum vapour pressure (
 $\tilde {P}_{max } \sim \tilde {h}_{min }^{-2/3}$
). As a result, surface tension becomes dominant in regularizing the neck region as it approaches
 $h_{min }$
. Therefore, it is necessary to retain the complete set of equations (4.3), and the simplified (4.15) is no longer applicable.
To verify this quantitatively, we record the time evolution of
 $P_\sigma = \sigma \kappa _{max }$
and
 $P_{max }$
at
 $U_0 = 0.394\, \rm ms^-{^1}$
,
 $\Delta T = 120 \ \mathrm {and} \ 400\,\mathrm {K}$
(
 $We = 8$
,
 $\mathcal {E} = 1.06 \times 10^{-6} \ \mathrm {and} \ 3.55 \times 10^{-6}$
), as presented in figure 10(a). We observe that, during the initial falling stage, vapour pressure dominates over capillary pressure, making the surface tension term negligible. However, after
 $t = 0.36\mathrm {ms}$
,
 $P_\sigma$
significantly increases and becomes comparable to
 $P_{max }$
. Furthermore, figure 10(b) highlights the role of capillary forces in preventing contact by showing the time histories of the minimum film thickness when the surface tension is normal (
 $\sigma = 1.7\times 10^{-2}\,\mathrm {N\, m^-{^1}}$
) and two orders smaller (
 $\sigma = 3.4\times 10^{-4}\,\mathrm {N\, m^-{^1}}$
). Clearly, by reducing the surface tension coefficient, we observe that
 $h_{min }$
decreases much faster even at very high superheat of
 $\Delta T = 400\,\mathrm {K}$
, indicating that the growth of vapour pressure alone cannot prevent droplet–pool coalescence, but capillary pressure can. In this transitional stage, the self-similar solution, which does not include capillary effects, breaks down. Thus, it seems that capillary pressure should be responsible for preventing the Leidenfrost droplet from contacting the liquid pool in the early impact stage.
(a) Time evolution of the maximum vapour pressure (
 $P_{g, max }$
, solid lines) and capillary pressure (
 $P_{\sigma }$
, dashed lines). (b) Minimum vapour thickness as a function of time, shown for cases with the standard
 $\sigma$
(solid lines) and reduced
 $\sigma /50$
(dash-dotted lines). These results correspond to impact conditions with
 $U_0 = 0.394\, \rm m\, s^-{^1}$
and two distinct superheats,
 $\Delta T = 120 \,\mathrm {K}$
(green colour) and
 $400\,\mathrm {K}$
(yellow colour).

Therefore, we assume that the film thickness reaches its minimum value when the two pressures are of comparable magnitude, namely
 $P_{\sigma } \approx P_{max }$
(
 $We^{-6/5} \mathcal {E}^{1/5} \tilde {\kappa } \sim \tilde {P}_g$
in dimensionless form). By substituting (4.24) and (4.26) into this equation, we obtain the minimum film thickness as follows:
 \begin{equation} \frac {h_{min }}{R_0}\sim We^{-28/25} \mathcal {E} ^{13/25}. \end{equation}
The derived scaling law offers valuable insights into the impact of various parameters on
 $h_{min }$
in the high superheat regime of the Leidenfrost problem. In dimensional terms, the minimum thickness adheres to a scaling relationship of
 $h_{min } \propto U_0^{-56/25} \Delta T^{13/25}$
, a formulation that closely aligns with the numerical results obtained in the high superheat regime, as demonstrated in figure 5. Notably, this expression exhibits a remarkable similarity to the relationship
 $h_{min } \propto U_0^{-2}\Delta T ^{1/2}$
derived by Chantelot & Lohse (Reference Chantelot and Lohse2021), despite the adoption of different characteristic scales (refer to table 2).
4.3. Reconstruction of the self-similar solutions at moderate superheat regime
Now, let us focus on the moderate superheat regime, where the influence of evaporation on the thin vapour film is substantial but not overwhelmingly dominant. It is important to emphasize that we obtain (4.27) in the high superheat regime based on two assumptions: first, the evaporation-induced velocity becomes dominant in the falling stage; second, in the lubrication equation, the evaporation term is balanced by the pressure-induced flow. However, in this intermediate regime, these two assumptions may not be fully valid. First of all, we find that the previously derived characteristic scalings (see (4.6b)) no longer hold true. Our empirical observations, illustrated in figure 7(b), reveal that in this moderate superheat regime, i.e. at
 $\Delta T \lt 200\,\mathrm {K}$
, the central dimple height
 $h_d$
does not conform to the anticipated
 $\Delta T^{2/5}$
variation law. Consequently, we have to employ
 $P_g \sim \mu _v R_0U_0/h^2$
as the basis for characterizing vapour pressure, and the scaling relations established by Mani et al. (Reference Mani, Mandre and Brenner2010) and Mirjalili & Mani (Reference Mirjalili and Mani2020) remain valid, as given in (4.6a)–(4.9a). Then, we can re-non-dimensionalize the governing equations for liquid and vapour flow, and they are given as follows:
 \begin{equation} \frac {\partial \tilde {\boldsymbol {u}}}{\partial \tilde {t}} + St^{-1/3} \tilde {\nabla } \left | \tilde {\boldsymbol {u}}\right |^2 = -\tilde {\nabla } \tilde {P}_l ,\end{equation}
 \begin{equation} \tilde {P}_g + We^{-1}St^{-1/3} \tilde {\kappa }= \tilde {P}_l ,\end{equation}
 \begin{equation} \frac {\partial \tilde {h}^{\pm }}{\partial \tilde {t}} + S t^{-1 / 3} \tilde {u}_{l}^{\pm } \frac {\partial \tilde {h}^{\pm }}{\partial \tilde {x}} = \tilde {v}_{l}^{\pm } ,\end{equation}
 \begin{equation} \frac {\partial \tilde {h}}{\partial \tilde {t}}=\frac {1}{\tilde {r}}\frac {\partial }{\partial \tilde {r}}\left (\frac {\tilde {r}\tilde {h}^{3}}{12 } \frac {\partial \tilde {P}_{g}}{\partial \tilde {r}}\right )-St^{-1/3}\frac {1}{\tilde {r}}\frac {\partial }{\partial \tilde {r}} \left ( \frac {\tilde {r}\tilde {h} \left (\tilde {u}^+ + \tilde {u}^- \right )}{2}\right ) + \frac {\mathcal {E} St^{5/3}}{We \tilde {h}}. \end{equation}
Considering the range of impact parameters in the numerical simulations where the Stokes number is very high (
 $St\sim O(10^5)$
), the leading-order equations in the moderate superheat regime are identical to (4.14)–(4.16), with the exception of the lubrication equation (4.17), which now becomes
 \begin{equation} \frac {\partial \tilde {h}}{\partial \tilde {t}}=\frac {1}{\tilde {r}}\frac {\partial }{\partial \tilde {r}}\left (\frac {\tilde {r}\tilde {h}^{3}}{12 } \frac {\partial \tilde {P}_{g}}{\partial \tilde {r}}\right ) + \frac {\mathcal {E} St^{5/3}}{We \tilde {h}} .\end{equation}
Variation of maximum vapour pressure
 $P_{max }$
and maximum interfacial curvature
 $\kappa _{max }$
as functions of the minimum vapour thickness
 $h_{min }$
, all normalized using scaling factors provided in (4.33) and (4.35). These impact scenarios correspond to moderate superheat conditions, with
 $U_0 = 0.34, 0.37, 0.39, 0.44\, \mathrm {m\,s}^{-1}$
and
 $\Delta T = 40, 80, 120\,\mathrm {K}$
. Notably, we adjust the correlation from
 $\tilde {\kappa }_{max } \sim \mathcal {E}^{2/3}$
to
 $\tilde {\kappa }_{max } \sim \mathcal {E}^{1/2}$
in panel (b) to achieve better data collapse.

In this regime, it is not straightforward to derive a theoretical scaling law from (4.32) if all three terms are included. Therefore, considering the moderate superheat condition (
 $40\,\mathrm {K} \lt \Delta T \lt 200\,\mathrm {K}$
), we maintain the assumption that the evaporation term is balanced by pressure, as was done in (4.23). Subsequently, by employing the self-similar ansatz as previously outlined in § 4.2, we can derive self-similar solutions applicable to the moderate superheat condition, which are presented as follows:
 \begin{equation} \tilde {P}_{max } \sim \tilde {h}_{min }^{-2/3} We^{-1/3} St^{5/9} \mathcal {E}^{1/3}, \end{equation}
 \begin{equation} \tilde {l} \sim \tilde {h}_{min }^{5/3} We^{1/3} St^{-5/9} \mathcal {E}^{-1/3} ,\end{equation}
 \begin{equation} \tilde {\kappa }_{max } \sim \tilde {h}_{min }/\tilde {l}^2 \sim \tilde {h}_{min }^{-7/3}We^{-2/3}St^{10/9}\mathcal {E}^{2/3} .\end{equation}
In a similar fashion, we proceed to analyse the values of
 $P_{max }$
and
 $\kappa _{max }$
obtained from our numerical results in this moderate superheat regime, corresponding to different values of
 $U_0$
(i.e. 0.34 , 0.37 , 0.39 and 0.44 m s–1) and
 $\Delta T$
(i.e. 40, 80 and 120 K), as illustrated in figure 11. However, the numerical results show discrepancies. On one hand, when attempting to rescale dimensionless
 $P_{max }$
using the scaling relation provided in (4.33), it becomes evident that the data cannot be collapsed onto a single curve, as depicted in figure 11(a). On the other hand, (4.35) implies that the dimensionless curvature evolves with the evaporation rate, following the correlation
 $\tilde {\kappa }_{max } \sim \mathcal {E}^{2/3}$
. However, our numerical results, as shown in figure 11(b), suggest that this relation is closer to
 $\tilde {\kappa }_{max } \sim \mathcal {E}^{1/2}$
. These discrepancies between numerical results and theoretical models can be attributed to two pivotal simplifications we made before. Firstly, we ignored the evaporation induced velocity when selecting the characteristic scales (4.6a)–(4.9a), where the vapour pressure was scaled as
 $P_g \sim \mu _v R_0 U_0/h^2$
. Notably, the value of
 $U_e/U_0$
is not so small for the moderate superheat conditions (
 $40\,\mathrm {K} \lt \Delta T \lt 200\,\mathrm {K}$
), as depicted in figure 6. Thus such simplification leads to an underestimation of the impact of evaporation in the respective characteristic scales and subsequent dimensionless normalization. Secondly, we disregarded the left-hand side in (4.32) and maintain the assumption that the evaporation term is fully balanced by the pressure term as was done in considering the high superheat regime. This assumption may not be entirely tenable, as illustrated in figure 8(a), where the evaporation term only dominates the squeezing term within a much narrower range around the spreading front for the condition of
 $\Delta T = 40 \,\mathrm {K}$
compared with
 $\Delta T = 400 \,\mathrm {K}$
. Thus the significance of evaporation has been overemphasized at this stage. As a result, it appears that in this moderate superheat regime, those neglected terms may play some roles, and ignoring any of them leads to inaccuracies.
Consequently, to better match our numerical solution, we adjust the exponent from
 $2/3$
with
 $1/2$
in the following analysis. With this modification, we can still derive the expression for
 $h_{min }$
by equating the maximum vapour pressure with the capillary pressure, i.e.
 $P_{max } \approx P_\sigma$
(
 $\tilde {P}_g \sim We^{-1} St^{-1/3} \tilde {\kappa }$
in dimensionless form). Substituting the scaling relation for
 $P_{max }$
and the modified relation for
 $\kappa _{max }$
into this expression, we obtain the following revised expression:
 \begin{equation} \frac {h_{min }}{R_0} \sim We^{-4/5} St^{-8/15} \mathcal {E} ^{1/10} .\end{equation}
This scaling relation provides an accurate prediction for
 $h_{min }$
in the moderate superheat regime, taking into account the nuanced interplay between evaporation and other influencing factors. The dimensional correlation
 $h_{min } \propto U_0^{-32/15}\Delta T^{1/10}$
can indeed accurately predict our numerical results for moderate superheat situations, as evidenced by the power exponents presented in figure 5. This robust agreement further reinforces the significance of the balance between gas pressure and surface tension in preventing the interfaces from approaching in the early stages of impact. Regrettably, we have to acknowledge that the scaling laws described in (4.33)–(4.35) serve as the approximations for the moderate superheat regime primarily due to the aforementioned two key simplifications. Besides, since these simplifications underestimate and overestimate the effect of evaporation respectively, the conclusion drawn for this moderate superheat regime cannot seamlessly transition to either low or high superheat conditions. Nonetheless, the methodology we employed allows for a coherent description of various superheat regimes from a physical standpoint. When the superheat is very high (
 $\Delta T \gt 200\,\mathrm {K}$
), the dominance of evaporation is evident in both the initial descent and subsequent spreading stage. As the superheat decreases to the moderate superheat regime (
 $40\,\mathrm {K} \lt \Delta T \lt 200\,\mathrm {K}$
), the effect of evaporation diminishes gradually in the initial stage but remains significant in the second stage as the vapour film thickness at the spreading front
 $h_{min }$
is considerably smaller than the minimum height of the central dimple
 $h_d$
. Finally, the low superheat regime, or the so-called isothermal regime, arrives (
 $\Delta T \lt 40\,\mathrm {K}$
) as the superheat decreases further, where the effect of evaporation in the whole impact process is negligible.
In summary, our analysis, based on lubrication and potential flow theories, has unveiled two distinct regimes characterizing the short-time dynamics of a Leidenfrost droplet impacting a superheated liquid pool. In the moderate superheat condition, phase-change effects are initially negligible during the droplet’s descent but gradually come to dominate the lubrication flow of the vapour film as the superheat increases. In this regime, the minimum film thickness at the spreading front scales as
 $h_{min } \propto U_0^{-32/15}\Delta T^{1/10}$
. On the other hand, in the high superheat condition, phase-change effects exert dominance throughout the entire impact process, from the initial falling stage to the final levitation stage. In this regime, we obtain
 $h_{min } \propto U_0^{-56/25} \Delta T^{13/25}$
as a corresponding scaling law. Importantly, in both regimes, the variation of the minimum film thickness with the falling velocity approximates
 $h_{min } \propto U_0^{-2}$
, which aligns remarkably well with our numerical results. Furthermore, the scaling laws also predict the observed tendencies of
 $h_{min } \propto \Delta T^{1/10}$
and
 $h_{min } \propto \Delta T^{1/2}$
in different regimes of our numerical simulations.
Lastly, in figure 12, we present the dimensionless values of
 $h_{min }$
for these two distinct superheat regions, normalized using the scaling laws (4.27) and (4.36). These findings enhance our understanding of the intricate interplay between phase-change effects and the impact dynamics in Leidenfrost droplet scenarios.


4.4. Comment on the critical impact velocity and superheat
In reality, both intermolecular van der Waals forces and gas kinetic effects (for air at atmospheric pressure
 $p_{atm} \approx 10^5\, \rm Pa$
, the mean free path is approximately 70 nm) become significant and cannot be disregarded as the vapour film thickness decreases to the scale of 100 nm (Couder et al. Reference Couder, Fort, Gautier and Boudaoud2005; Thoroddsen et al. Reference Thoroddsen, Thoraval, Takehara and Etoh2012; Tran et al. Reference Tran, de Maleprade, Sun and Lohse2013). However, it is still a challenge to incorporate all these diverse effects in the DNS; here, we directly employ a fixed critical thickness
 $h_c$
to explore the potential coalescence criterion.
By substituting the critical value into the minimum film thickness
 $h_{min }$
in the derived scaling law (4.27) and (4.36), the corresponding phase diagram for the critical impact velocity and superheat can be obtained, as presented in figure 13, where the solid and dash dotted lines correspond to different critical thicknesses, with
 $h_c$
set at 200 nm and 100 nm, respectively. It can be observed that each solid and dash dotted line comprises three segments: an orange interval derived from the high superheat regime (4.27), a green interval from the moderate superheat regime (4.36) and a purple interval calculated based on the isothermal scaling derived by Mirjalili & Mani (Reference Mirjalili and Mani2020). These piecewise segments divide the parameter space into two regions: on the left side of the lines, where
 $h_{min }$
exceeds
 $h_c$
, coalescence of interfaces does not occur; while on the right side of the lines,
 $h_{min }$
is smaller than
 $h_c$
and this would result in the occurrence of coalescence. Additionally, we also depict the critical lines derived from (4.27) across all impact conditions as grey dashed lines in figure 13. Notably, they expands the coalescence domain compared with the prediction relying on the combination of (4.27) and (4.36).
It should be noted that the critical lines presented in figure 13 are not only influenced by the specific critical thickness
 $h_c$
, which depends on the intricate coalescence mechanics, but also by the working fluid’s physical properties. Consequently, this diagram is relatively qualitative in nature and cannot be seen as a universal criterion for predicting whether the coalescence occurs. Besides, the vapour film collapse throughout the entire impact process can be driven by multiple mechanisms (Chantelot & Lohse Reference Chantelot and Lohse2021), beyond the short-time contact specifically examined in this study. Therefore, a comprehensive understanding of all these mechanisms is essential for accurately predicting the dynamic Leidenfrost temperature.
Phase diagram of the non-coalescence and coalescence regions for ethanol drops impacting onto a superheated silicon oil pool in the parameter space defined by impact velocity
 $U_0$
and superheat
 $\Delta T$
. The solid and dash-dotted lines demarcate the boundaries between these regions, estimated from the combination of scaling laws (4.27) and (4.36), with critical thicknesses of
 $h_c = 200\,\mathrm {nm}$
(solid) and
 $h_c = 100\,\mathrm {nm}$
(dash-dotted), respectively. Additionally, the grey dashed lines indicate the boundaries derived using only (4.27) across the parameter space.

5. Conclusions
In this work, we have numerically examined the dynamic interplay resulting from the impact of an ethanol droplet onto a superheated silicon oil pool. Our focus has been on elucidating the intricate short-time dynamics inherent in the Leidenfrost system. Specifically, we have placed particular emphasis on tracking the temporal evolution of the minimum thickness of the thin vapour film. By systematically varying both the impact velocity and the degree of superheat, we have uncovered valuable insights into the behaviour of this film, a parameter denoted as
 $h_{min }$
, which fundamentally governs whether the droplet will undergo direct coalescence with the pool or remain suspended above it.
The numerical results have unveiled a discernible influence exerted by superheat induced evaporation on the thickness of the vapour film. Notably, we have developed a theoretical framework that unveils the presence of a self-similar solution governing the formation of cusps on the droplet surface in the context of phase change. This framework is built upon two key leading-order assumptions: firstly, during the initial falling stage, the dominance of the evaporation effect leads to a substantial deviation in the scale of vapour pressure compared with isothermal scenarios. This disparity also delineates two distinct superheat situations. Secondly, the vapour pressure at the location of minimum thickness primarily arises from equilibrium with evaporation, which is general as the interfaces approaching. Besides, the theoretical correlations link
 $h_{min }$
to impact conditions. For scenarios characterized by moderate superheat conditions, we have observed a scaling relationship of
 $h_{min }\propto U_0^{-32/15}\Delta T^{1/10}$
(
 $h_{min }/R_0 \sim We^{-4/5}St^{-8/15}\mathcal {E}^{1/10}$
in dimensionless form). Conversely, under conditions of high superheat, this relationship transitions to
 $h_{min }\propto U_0^{-56/25}\Delta T^{13/25}$
(
 $h_{min }/R_0 \sim We^{-28/25}\mathcal {E}^{13/25}$
in dimensionless form). Significantly, both scaling relationships align exceptionally well with our numerical findings, further validating the credibility and accuracy of our theoretical model. Moreover, our careful numerical investigations have enabled us to disentangle the intricate interplay between various factors influencing the short-time dynamics of the vapour layer. Through rigorous quantitative analysis, we have discerned subtle balances among drainage, evaporation and pressure effects, particularly in the context of high superheat conditions.
Remarkably, the numerical and theoretical analyses illuminates that the vapour pressure ultimately achieves equilibrium by balancing against the capillary pressure, driven by the rapid growth of curvature at the spreading front. Significantly, this strongly indicates that evaporation alone cannot prevent the coalescence of the droplet with the liquid pool; instead, the influence of capillary pressure emerges as a pivotal factor. This equilibrium is instrumental in defining the minimum film thickness, which, in essence, prevents early contact between the droplet and pool interfaces through the influence of van der Waals forces. This multifaceted interplay of forces underscores the intricate physical factors governing the dynamics of dropletpool interactions in the Leidenfrost regime.
Funding.
The authors gratefully acknowledge the supports from the NSFC (12222208), and from National Key R
 $\&$
D Program of China (2022YFE03130000, 2023YFA1011000).
Declaration of interests.
The authors report no conflict of interest.
Appendix A. Ethanol drop impact onto the superheated wall
To further validate our numerical findings and compare them with experimental data, we conducted simulations of an ethanol droplet impacting a superheated solid substrate, consistent with the experimental study by Chantelot & Lohse (Reference Chantelot and Lohse2021). Our numerical simulations were still performed in a two-dimensional axisymmetric system, with the superheated liquid pool replaced by a solid wall. The initial diameter of the droplet was set to
 $D_0 = 2.4$
mm, and the physical properties of the vapour and liquid were the same as those listed in table 1.
Figure 14 presents the numerical results of the minimum vapour film thickness under various impact conditions, normalized by the scaling law
 $h_{min }/R_0 \sim We^{-1}\mathcal {E}^{1/2}$
(
 $h_{min }\propto U_0^{-2}\Delta T^{1/2}$
) provided by Chantelot & Lohse (Reference Chantelot and Lohse2021). Experimental results from Chantelot & Lohse (Reference Chantelot and Lohse2021) are also included for comparison. It is evident that our numerical results align well with the experimental data in the high superheat regime, providing further validation for the reliability of our numerical results. Additionally, these results suggest that the substrate boundary condition has minimal influence on the scaling correlation between
 $h_{min }$
and
 $U_0$
and
 $\Delta T$
.
Numerical results of the minimum vapour film thickness (
 $h_{min }$
) for an ethanol droplet impacting a superheated solid substrate. The results are normalized using the scaling law
 $h_{min }/R_0 \sim We^{-1}\mathcal {E}^{1/2}$
(
 $h_{min }\propto U_0^{-2}\Delta T^{1/2}$
) provided by Chantelot & Lohse (Reference Chantelot and Lohse2021). Experimental data (Chantelot & Lohse Reference Chantelot and Lohse2021) are also included for comparison, demonstrating good agreement and affirming the reliability of the numerical results.

Appendix B. The behaviour of the spreading front
In figure 4, we reported an inflection point appeared at the reduced time
 $(t-t_0)U_0/R_0 \approx 0.015 (t \approx 0.36\,\mathrm{ms})$
for different impact conditions. In order to investigate whether this behaviour is unique to the droplet–pool impact system or not, we also numerically analysed the time evolution of the radial spreading front for a droplet impacting onto a solid substrate, as depicted in figure 15. The initial conditions mirror the results presented in Appendix A.
Clearly, the inflection point persists in this scenario, indicating that this behaviour is neither unique to the drop-pool impact system nor solely due to the deformable liquid pool interface. Besides, we also observe that in both impact scenarios, the inflection point corresponds to the moment
 $(t \approx 0.365\,\mathrm {ms})$
when the thickness of the vapour layer reaches its minimum at the spreading front. While the surface tension also dominates over other effects at this time moment, as depicted in the main text, it decelerates the radial flow to create an inflection on the curves describing the radial position of the spreading front.
Time evolution of the normalized radial position of the spreading front for the problem of drop impacting on superheated solid substrate. The results correspond to the conditions of
 $U_0 = 0.394\, \mathrm {m\, s^-}{^1}$
and
 $\Delta T = 20, 80, 120, 200, 400\, \mathrm {K}$
, while the black dashed line shows the Wagner prediction
 $\sqrt {3(t - t_0)U_0/R_0}$
.

Additionally, we also remark that the prefactors of numerical results fitted in figures 4 and 15 are slightly different, although both of them seem to approach
 $\sqrt {3}$
predicted by Wagner. In particular, the prefactor corresponding to the droplet–solid impact system is almost
 $\sqrt {3}$
while it is
 $\sqrt {2.5}$
in the droplet–pool impact system. This slight decrease can be attributed to the retention of the droplet when impacting onto another deformable liquid interface, as opposed to a solid wall (Philippi et al. Reference Philippi, Lagrée and Antkowiak2016).
Appendix C. Relevant scales to characterize the short-time dynamics of the drop impact problem
In § 4.1, we have introduced the characteristic scales commonly used for isothermal impact problems, as well as those newly derived scales to characterize the Leidenfrost scenarios within the scope of this research. We will now give more details on how to derive these scaling laws, which can be viewed as an extension of the works presented by Bouwhuis et al. (Reference Bouwhuis, van der Veen, Tran, Keij, Winkels, Peters, van der Meer, Sun, Snoeijer and Lohse2012) and Mirjalili & Mani (Reference Mirjalili and Mani2020).
In the early stage of impact, the approaching droplet interacts with the gas layer, inducing a flow in the gas over a radial length scale
 $L = \sqrt {R_0 h}$
, taking into account the parabolic shape of the drop interface. As the thickness of the gas layer
 $h$
is much smaller than the radial length scale
 $L$
, the gas pressure adheres to the lubrication approximation of the Stokes equation, which describes the viscous, incompressible gas flow between the drop interface and pool surface
 \begin{equation} \frac {\partial P_g}{\partial r } \sim \mu _v \frac {\partial ^2 u}{\partial y^2} ,\end{equation}
where
 $P_g$
represents the gas pressure and
 $u$
stands for the radially outward velocity within the gas layer. Following the mass conservation law,
 $u$
can be scaled as
 $u \sim (U_0 + U_e) L /h$
with
 $U_0$
and
 $U_e = \lambda _v \Delta T/\rho _v h \mathcal {L}$
denote the initial falling velocity and the evaporation-induced velocity, respectively. Subsequently, an estimate for the gas pressure can be obtained as
 $P_g \sim \mu _v L u / h^2 \sim \mu _v R_0 (U_0 + U_e) / h^2$
, derived from the Stokes equation (C1).
The liquid pressure
 $P_l$
can be estimated from the unsteady Bernoulli equation
 \begin{equation} \frac {\partial \phi }{\partial t } \sim \frac {P_l}{\rho _l}. \end{equation}
Through dimensional analysis, the deceleration time scale can be approximated as
 $t \sim h/U_0$
, and the potential in the liquid can be scaled as
 $\phi \sim U_0 L$
. Thus, the liquid pressure scales as
 $P_l \sim \rho _l U_0^2 L / h$
.
The condition for the droplet to deform implies that the pressure in the gas must be sufficiently high to decelerate the falling liquid locally from velocity
 $U_0$
to rest, that is to say the gas pressure must balance the inertial pressure in the droplet as
 $P_g \sim P_l$
. This equilibrium allows us to arrive at the scaling relations of thickness, lateral length, pressure and time
 \begin{equation} h \sim R_0 St^{-2/3}\left ( 1 + \frac {U_e}{U_0} \right ) ,\end{equation}
 \begin{equation} L \sim R_0 St^{-1/3}\left ( 1 + \frac {U_e}{U_0} \right )^{1/2} ,\end{equation}
 \begin{equation} P_g \sim \rho _l U_0^2 St^{1/3}\left ( 1 + \frac {U_e}{U_0} \right )^{-1}, \end{equation}
 \begin{equation} t \sim R_0 St^{-2/3} U_0^{-1} \left ( 1 + \frac {U_e}{U_0} \right ). \end{equation}
When the initial falling velocity is sufficiently high or the superheat is very low, the ratio of
 $U_e/U_0$
becomes small and can be neglected. In this case, the characteristic scales (C3)–(C6) reduce to the form seen in the isothermal scenario, as outlined in the left column of table 2. Conversely, if evaporation plays a dominant role, the approximation of
 $ (U_e/U_0 + 1 ) \approx U_e/U_0$
leads to the newly derived scaling correlations, as presented in the right column of table 2.
On the other hand, if we set the scale of the pressure inside the drop directly based on its initial inertia as
 $P_l \sim \rho _l U_0^2$
, another group of scaling laws can be obtained
 \begin{equation} h \sim R_0 St^{-1/2}\left ( 1 + \frac {U_e}{U_0} \right )^{1/2}, \end{equation}
 \begin{equation} L \sim R_0 St^{-1/4}\left ( 1 + \frac {U_e}{U_0} \right )^{1/4}, \end{equation}
 \begin{equation} t \sim R_0 St^{-1/2}U_0^{-1}\left ( 1 + \frac {U_e}{U_0} \right )^{1/2} .\end{equation}
Note that the length scale (C7) without considering phase change was also deduced and justified by Klaseboer, Manica & Chan (Reference Klaseboer, Manica and Chan2014). However, for the sake of consistency with previous models for isothermal cases (Mani et al. Reference Mani, Mandre and Brenner2010; Hicks & Purvis Reference Hicks and Purvis2011; Bouwhuis et al. Reference Bouwhuis, van der Veen, Tran, Keij, Winkels, Peters, van der Meer, Sun, Snoeijer and Lohse2012; Mirjalili & Mani Reference Mirjalili and Mani2020), we did not adopt these scaling relations in this paper and just include them here for the readers who may be interested in exploring them further.
Appendix D. Validation of the saturated vapour assumption for the vapour film
As the droplet impacts onto the substrate, heat transfer through the gas layer completes in a significantly short timescale, i.e.
 $h^2 / \alpha _v \approx 0.1\,\mu s$
, where
 $\alpha = \lambda /\rho c_{p}$
represents the thermal diffusivity coefficient. This timescale is notably shorter compared with that characterizing the approaching stage. Consequently, we can expect a linear temperature profile within the vapour layer during the descending stage, leading to substantial heat transfer to the droplet and the formation of a thermal boundary layer near the interface as the vapour thickness diminishes. The thickness of the thermal boundary layer inside the droplet scales as
 $\sqrt {\alpha _l t}$
, which is very thin within this short time span. Consequently, temperature of the liquid at the bottom interface rapidly increases from its initial or ambient temperature
 $T_a$
to the boiling temperature
 $T_{sat}$
. Additionally, the Jakob number
 $Ja = c_{p,l}(T_{sat} - T_a)/\mathcal {L}$
can be defined to compare sensible heat with latent heat, with a value of approximately 0.18 in the current study, indicating that the energy required to heat the liquid is significantly less than the energy needed for the phase change. Therefore, it is commonly assumed in various theoretical analyses that the temperature of the bottom interface reaches
 $T_{sat}$
, as discussed in other works (Sobac et al. Reference Sobac, Rednikov, Dorbolo and Colinet2014; Castanet et al. Reference Castanet, Chaze, Caballina, Collignon and Lemoine2018; Chantelot & Lohse Reference Chantelot and Lohse2021; Gordillo & Riboux Reference Gordillo and Riboux2022).
In reality, as the interfacial temperature increases, the vapour pressure also rises as described by the Antoine equation
 \begin{equation} \log _{10}P_{sat} = 5.33675 - \frac {1648.22}{T-273.15 + 230.918} ,\end{equation}
where
 $P_{sat}$
and
 $T$
are in units of bar and K, respectively. Accordingly, the vapour concentration increases to 100 % as the temperature reaches the boiling point, based on the correlation between interfacial concentration
 $Y_{\Gamma }$
and vapour pressure
 \begin{equation} Y_{\Gamma } = \frac {P_{sat} M_{v}}{\left (P_{atm} - P_{sat} \right ) M_g + P_{sat} M_v} ,\end{equation}
where
 $M_v$
and
 $M_g$
denote the molar mass of vapour and ambient gas, and
 $P_{atm}$
is the ambient pressure.