INTRODUCTION
The fisheries sector plays a vital role in Indian economic development, provides nutritional security and creates many employment opportunities. Indian marine fish production depend on coastal waters and about 90% of the catch comes from depths starting at 50 m (Balachandran et al., Reference Balachandran, Menon and Pillai1996). Poor technology and economic viability are the important constraints in the exploration of deep-sea resources. Unfortunately, only a few of the maritime states in India are exploring deep-sea fishery (Mathew, Reference Mathew2003). Therefore, the exploration of deep-sea resources is important for increased fish production in the country.
In the global aspects of biodiversity, deep-slopes and deep-reefs are the two habitats where most new marine taxa are likely to be found (Eschmeyer et al., Reference Eschmeyer, Fricke, Fong and Polack2010). The general characters of deep-sea fishes are high longevity, slow growth, late maturity and low fecundity, which means the deep sea is the most vulnerable ecosystem and its recovery will be slow (Moratto et al., Reference Moratto, Watson, Pitcher and Pauly2006). Studies about the deep-water community structure from the South-eastern Arabian Sea are limited; there have not been many attempts to investigate the species assemblage and community structure. Hitherto, surveys of Fisheries Oceanographic Research Vessel (FORV) ‘Sagar Sampada’ have contributed significant information on deep-sea fishery resources of India (Nair & Joseph, Reference Nair and Joseph1984; Sivakami, Reference Sivakami1989; James & Pillai, Reference James and Pillai1990; Panicker et al., Reference Panicker, Boopendranath and Syed Abbas1993; Khan et al., Reference Khan, Zacharia, Nandakumaran, Mohan, Arputharaj, Nagaraja and Ramakrishnan1996; Venu & Kurup, Reference Venu and Kurup2002; Jayaprakash et al., Reference Jayaprakash, Kurup, Sreedhar, Venu, Thankappan, Manjebrayakath, Pachu, Thampy and Sudhakar2006).
Studies on species abundance distribution and community structure of the area are scarce, while some limited studies are available (Hashim, Reference Hashim2012; Sudhakar et al., Reference Sudhakar, Sreedhar and Meenakumari2013). This study focuses on the community structure of the demersal ichthyofauna of the South-eastern Arabian Sea. However, continuous study and monitoring of the diversity plays a vital role in the conservation of the deep-sea ichthyofauna. With this study, we aimed to explore the species assemblages and community structure of the deep-sea habitat of the South-eastern Arabian Sea. This study also investigated the changes in the community structure of two extremes of the mesopelagic zone (200 and 1000 m depth).
MATERIALS AND METHODS
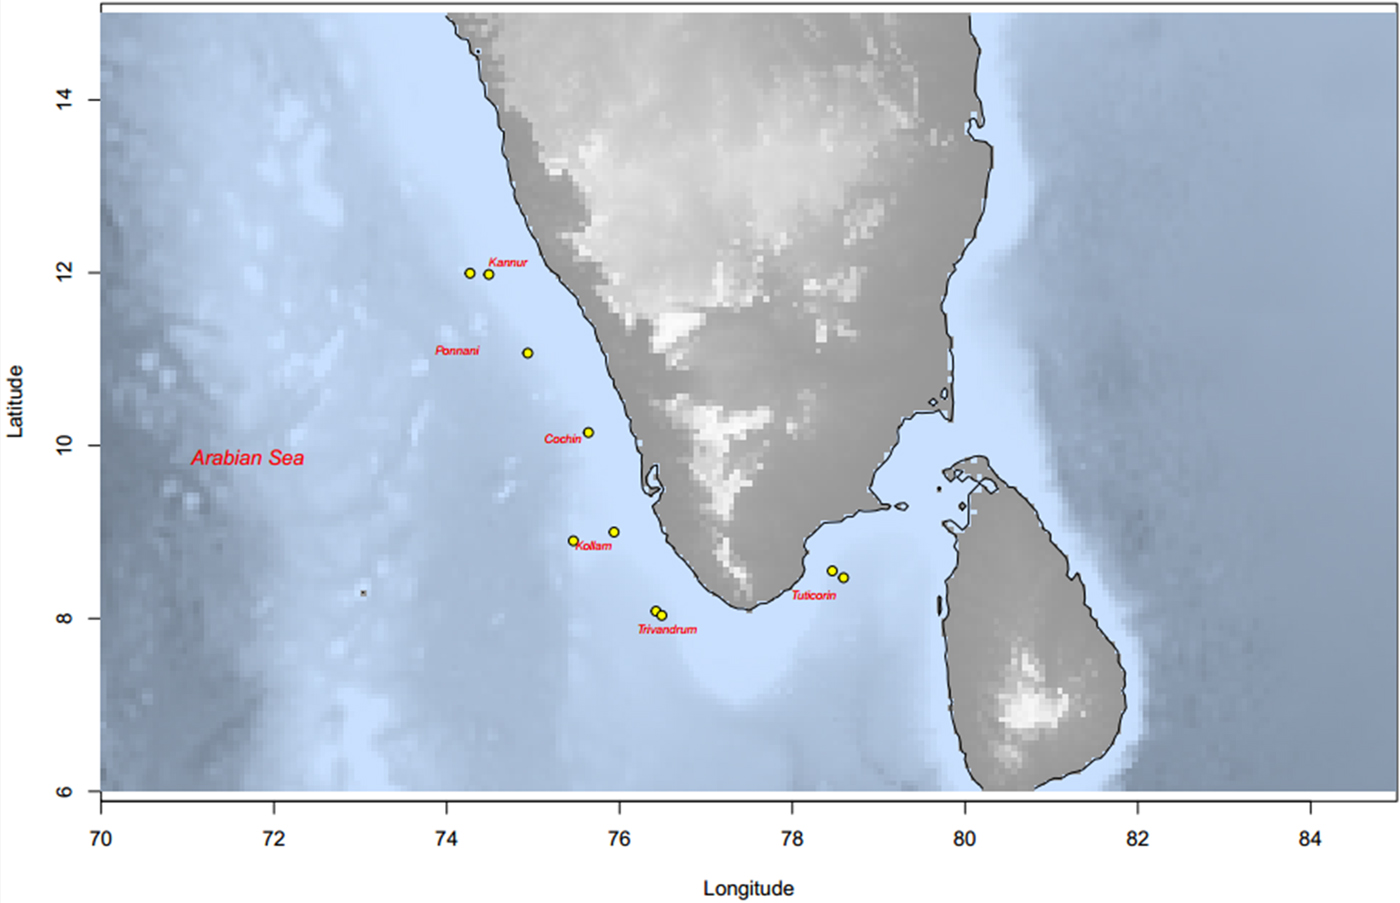
The study area lies between 8.02–11.58°N 74.16–78.35°E (Figure 1) off the South-east Arabian Sea. Samples for this study have been collected during the FORV ‘Sagar Sampada’ Cruise No: 322-research expedition, in the depth zone of ~200 and ~1000 m, from 6–19 January 2014. Stations with depths ranging from 180 to 220 m were considered ~200 m depth and stations with depths ranging from 970 m to 1110 were considered ~1000 m.
Map showing the study area and sampling stations.

High Speed Demersal Trawl II (HSDT, 38 m) and Expo-model Demersal Trawls (45.6 m) were used for the fishing operations. The ground was scanned using a SIMRAD EK 60 echo-sounder to determine the most suitable sea bottom for trawling. The stations were fixed using a navigation chart. Speed of the vessel was kept at 3.5–4.5 knots and the duration of the operation was standardized to 1 h. Map of study area and sampling sites are created using R software (R Core Team, 2016) with marmap package (Eric & Benoit, Reference Eric and Benoit2013).
The collected samples were identified based on the publications of Alcock (Reference Alcock1899), Smith & Heemstra (Reference Smith and Heemstra1986), FishBase (Froese & Pauly, Reference Froese and Pauly2016) and classification was made using the Catalog of Fishes online (Eschmeyer et al., Reference Eschmeyer, Fricke and van der Laan2016). Diversity indices and community structure were calculated using PRIMER Version 6 for windows (Clarke & Warwick, Reference Clarke and Warwick2001; Clarke & Gorley, Reference Clarke and Gorley2006). We were used only fishes for analysis because the current study is about the species assemblages and community structure of demersal ichthyofauna.
Based on the individual species data of each transect, diversity indices including Margalef's richness index (d), Shannon diversity index (H′log2), Pielou's evenness index (J′) and Simpson diversity index (1 − λ) were calculated.
Cluster analysis was done to find out the similarities between stations, using the Bray–Curtis coefficient hierarchical agglomeration method and was used to produce the dendrogram from the square root transformed data. The species were ranked in terms of abundance, the ranked abundances were calculated as percentages of the total abundances of all species and were plotted against the relevant species rank. K-dominance curves were constructed to ascertain the dominant species at each site and understand its contribution in the total diversity; it helps in comparing different sites qualitatively.
RESULTS
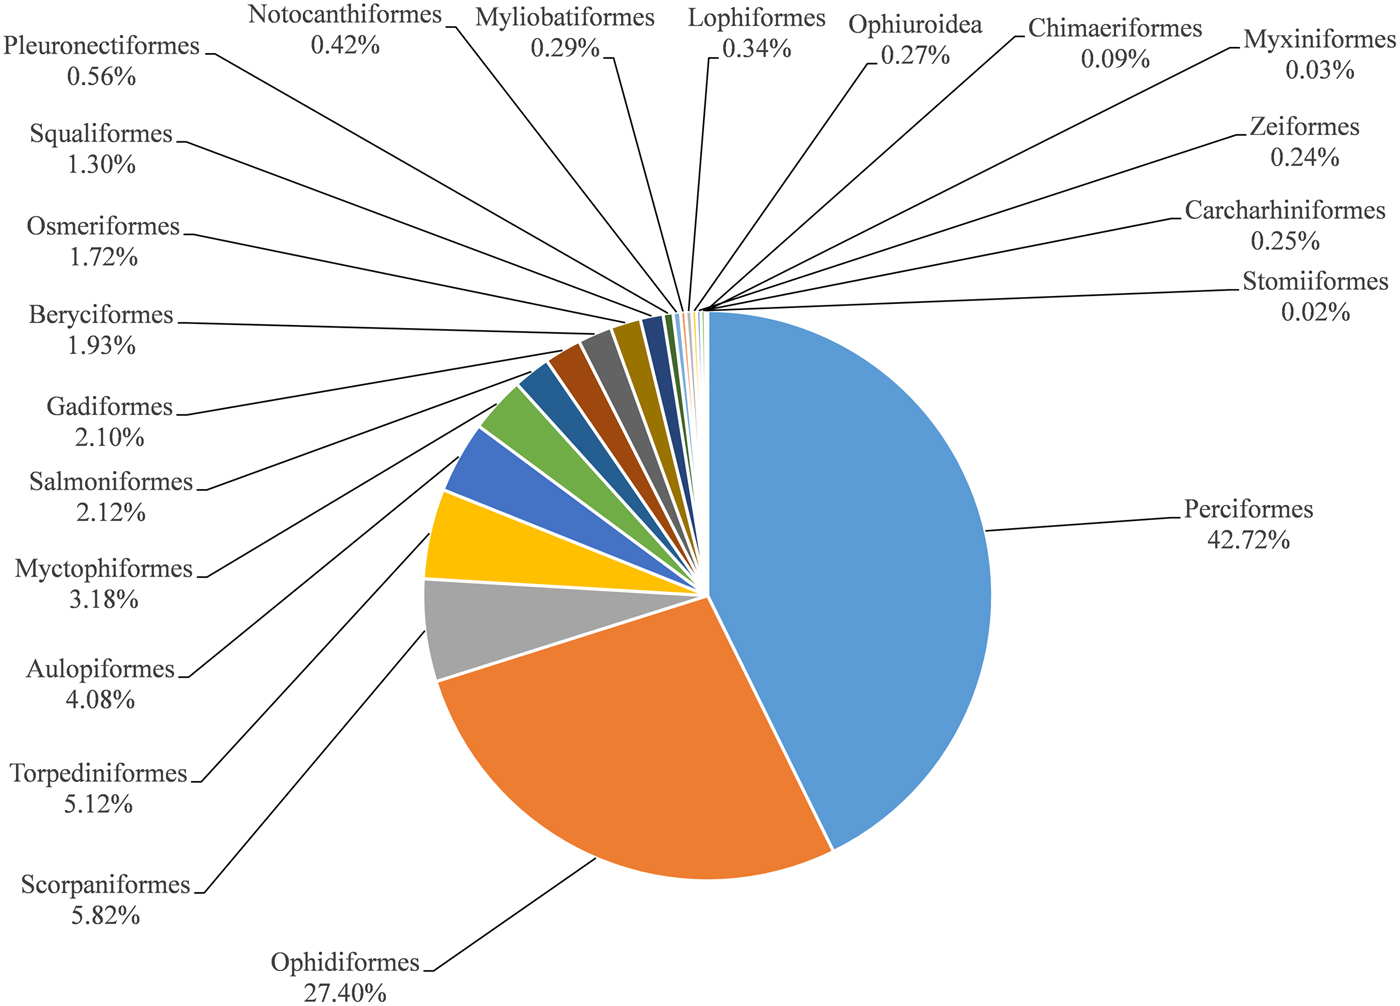
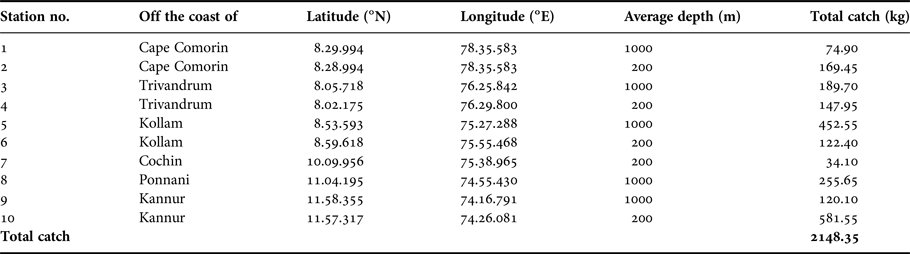
The total catch (Table 1), catch composition is presented in Figure 2. Perciformes dominated with 42.72%, followed by Ophidiiformes (27.40%), Scorpaeniformes (5.82%), and Aulopiformes (4.08%), Myctophiformes (3.18%), Salmoniformes (2.12%).
Composition of demersal fishes of the South-east Arabian Sea.

Total catch at different depths from the South-east Arabian Sea.

Species composition
From the catch composition (Figure 2), we can conclude that our study area is dominated with Perciformes (42.72%) and is also composed with Ophidiiformes (27.40%), Scorpaeniformes (5.82%), Aulopiformes (4.08%), Myctophiformes (3.18%) and Salmoniformes (2.12%).
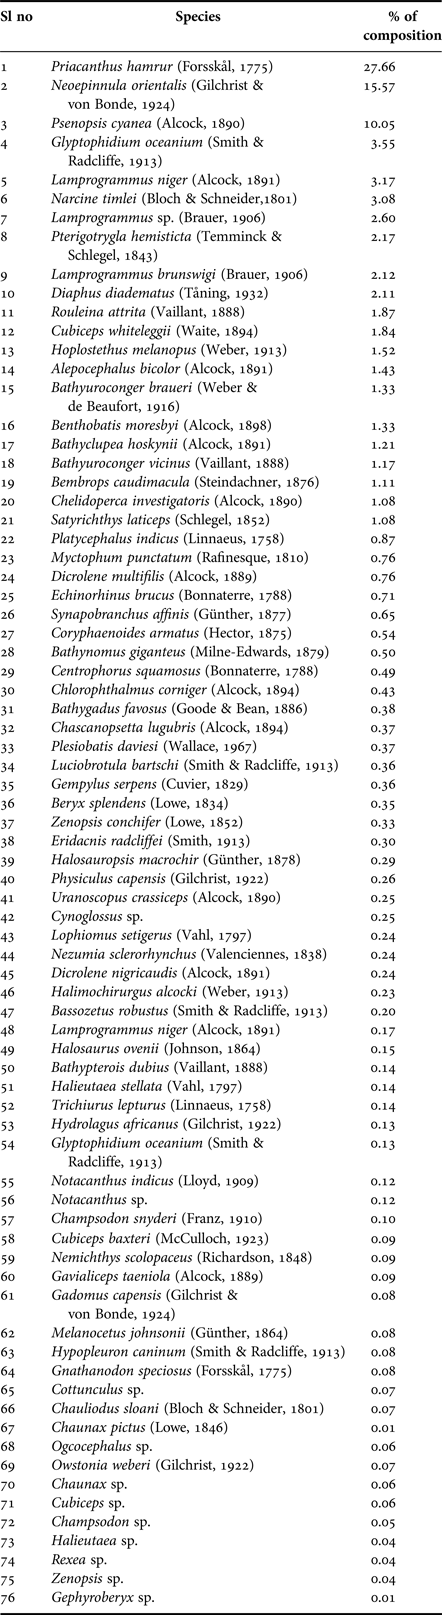
The total ichthyofaunal biomass is composed of 76 species from 22 orders and the composition of each species is sorted in percentage (Table 2). The catch composition is dominated by Priacanthus hamrur (Forsskål, 1775) (27.66%) and composed with other major species: Neoepinnula orientalis (15.57%), Psenopsis cyanea (10.05%), Glyptophidium oceanium (3.55%).
Species composition of demersal ichthyofauna from the South-east Arabian Sea.

Diversity indices
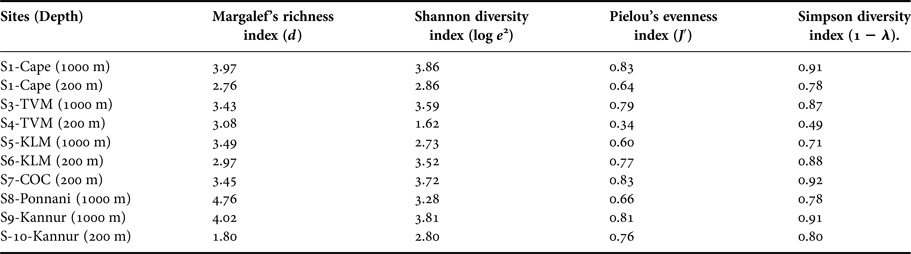
The cluster analysis and k-dominance plot were constructed using Primer Version v6 (Clarke & Gorley, Reference Clarke and Gorley2006). The calculated diversity indices are Margalef's richness index (d) (Margalef, Reference Margalef1958), Shannon index (log e 2) (Shannon & Weaver, Reference Shannon and Weaver1949), Pielou's evenness index (J′) (Pielou, Reference Pielou1966) and Simpson diversity index (1 − λ) (Table 3).
Diversity indices of 10 sampling stations of the South-east Arabian Sea.

Margalef's richness index (d)
Margalef's richness index (d), weights number of species in the community rather than individuals. It is estimated that the normal value of Margalef's index lies between 2.5–3.5 in a healthy environment (Khan et al., Reference Khan, Murugesan and Lyla2004). In this study, Margalef's richness index for 200 m varies between 1.80–3.40 with an average of 2.79 and for 1000 m depth varies between 3.43–4.02, with an average of 3.72. Maximum value observed is 4.02 at 1000 m depth (11.85°N 74.16°E) and minimum value observed is 1.80 at 200 m depth (11.57°N 74.26°E). Margalef's richness is slightly higher at 200 m and 1000 m depth, which is higher than previous studies Sudhakar et al., Reference Sudhakar, Sreedhar and Meenakumari2013 (Table 4).
Average diversity indices at different depth zones and its comparison with earlier study in the South-eastern Arabian Sea.

Shannon diversity index (log e 2)
During the present study, Shannon diversity index for 200 m varies between 1.62–3.52 with an average of 2.57 and varies between 3.28–3.86 at 1000 m depth, with an average of 3.57. Maximum value observed is 3.86 at 1000 m depth (8.29°N 78.35°E), minimum value observed is 1.62 (8.02°N 76.29°E). The Shannon diversity index (which takes into account the number of individuals as well as number of taxa) varies between 0.0–5.0 (Turkmen & Kazanci, Reference Turkmen and Kazanci2010). More than 4.5 is uncommon (Magurran, Reference Magurran2004). Values of Shannon diversity index are slightly higher than the values of the previous studies of Sudhakar et al. (Reference Sudhakar, Sreedhar and Meenakumari2013) (Table 4).
Pielou's evenness index (J′)
Equitability is often expressed as Pielou's evenness index (J′), and the value lies between one and zero. The index refers how close numbers of each species are in an ecosystem. It is a measure of diversity, which refers to the equality of species numbers in a community structure. In this study, Pielou's evenness index for 200 m varies between 0.34–0.81 with an average of 0.57 and for 1000 m depth varies between 0.71–0.78 with an average of 0.74. For 200 m depth, Pielou's evenness is higher than the previous report of Sudhakar et al. (Reference Sudhakar, Sreedhar and Meenakumari2013), while values are lower for the 1000 m study (Table 4).
Simpson diversity index (1 − λ)
The Simpson index 1 − λ is an equitability or evenness index and the value of 1 − λ is always <1. In this study, we observed that the Simpson (1 − λ) of the South-eastern Arabian Sea varies between 0.49–0.91 with an average of 0.80.
Cluster analysis
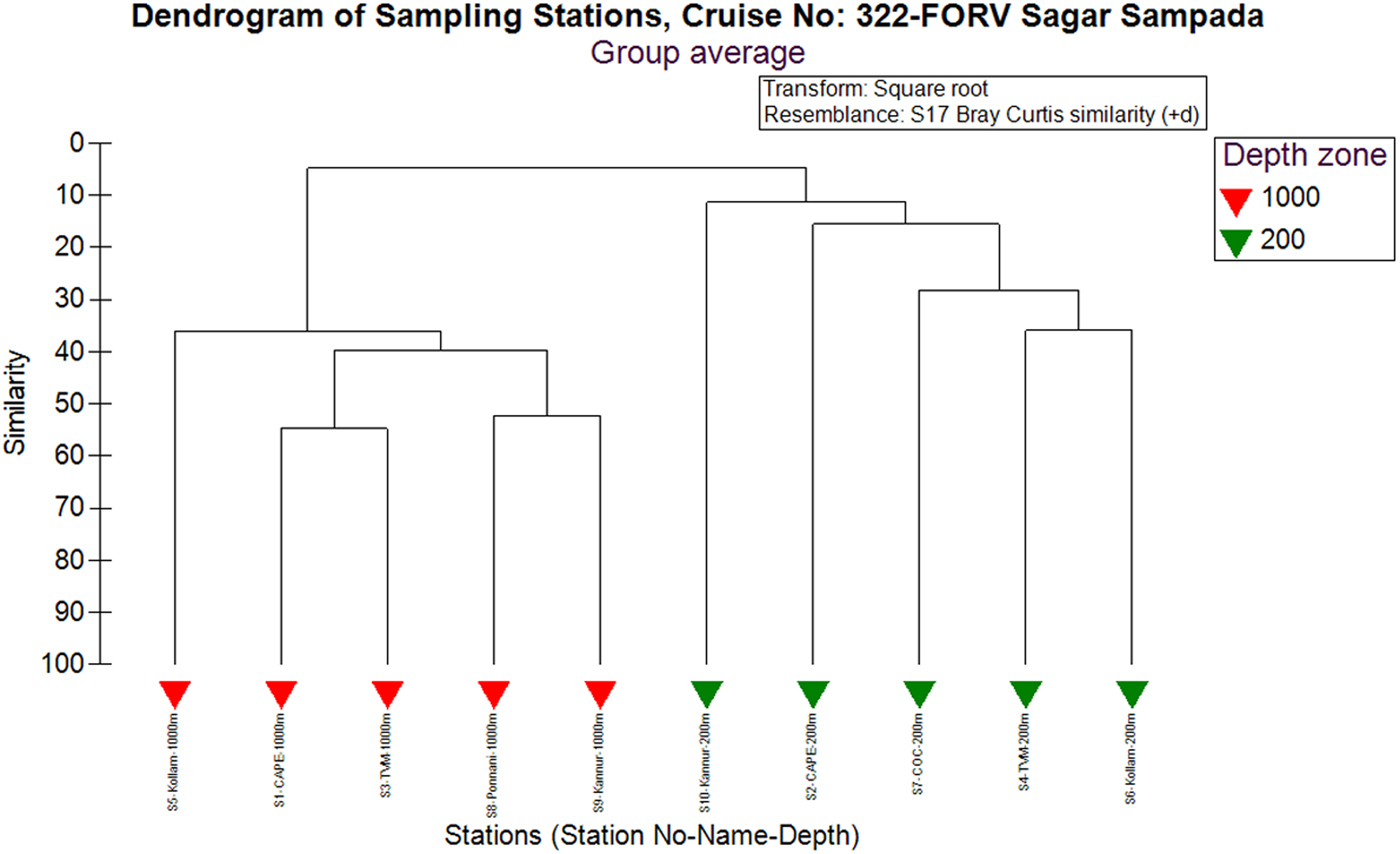
Cluster analysis is a technique in which sequences are linked together according to their similarities and produces a two dimensional dendrogram. The vertical axis of the dendrogram represents the distance or similarity between clusters. The horizontal axis represents the objects and clusters (Figure 3).
Dendrogram of the results of running the species abundance data through the Group Average clustering algorithm.

In this study, there is no similarity observed between ~200 m depth zones and ~1000 m depth zones. We can see the five stations of 200 m depths form a single cluster and 1000 m depth stations are formed into another cluster with zero percentage similarity in the community structure. That means the stations of similar depth are in the same group. It shows the similarity of the similar depth stations in the community structure. Moreover, adjacent stations with the same depth are showing close similarity.
K-dominance plot
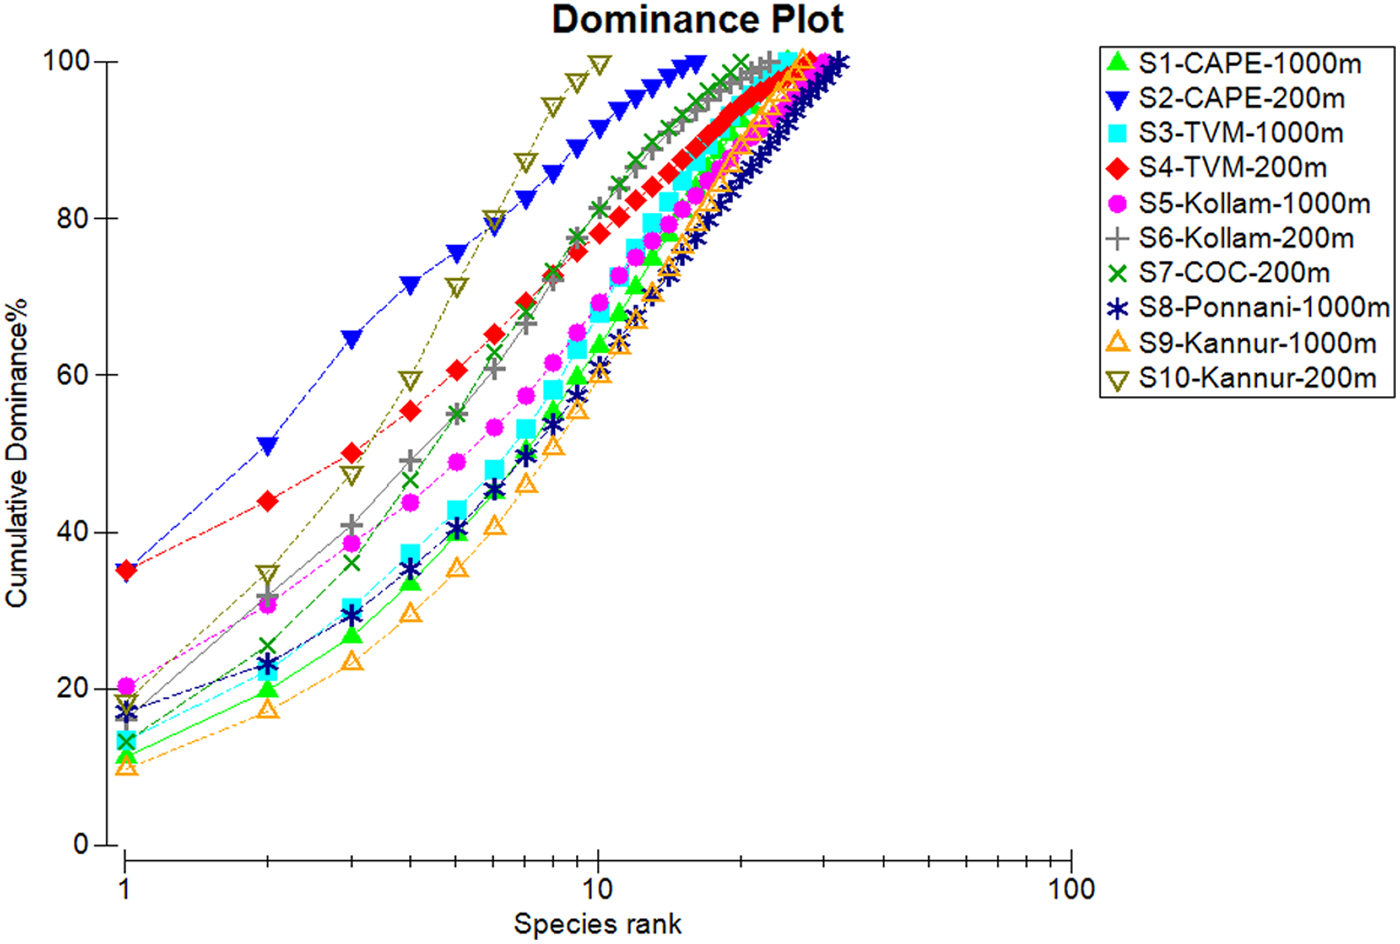
Figure 4 is a plot of the percentage cumulative abundance plotted against log species rank (Lambshead et al., Reference Lambshead, Piatt and Shaw1983). It is a graphical method used for comparing diversity between samples. Note that the lower line has the higher diversity and that if the lines for two samples cross then they will tend to rank differently for different diversity indices.
K-dominance plot for the 10 stations of the South-eastern Arabian Sea.

K-dominance plots for the sites revealed that at the 200 m isobaths, the first 10 species that contributed total abundance of each station about 99% (S-10), 90% (S-2), 83% (S-7), 81% (S-4) and 81% (S-6) respectively. In the 1000 m, isobaths k-dominance plots revealed that the first 10 species that contributed total abundance at each station are 77% (S-5), 71% (S-3), 67% (S-1), 63% (S-8), 61% (S5).
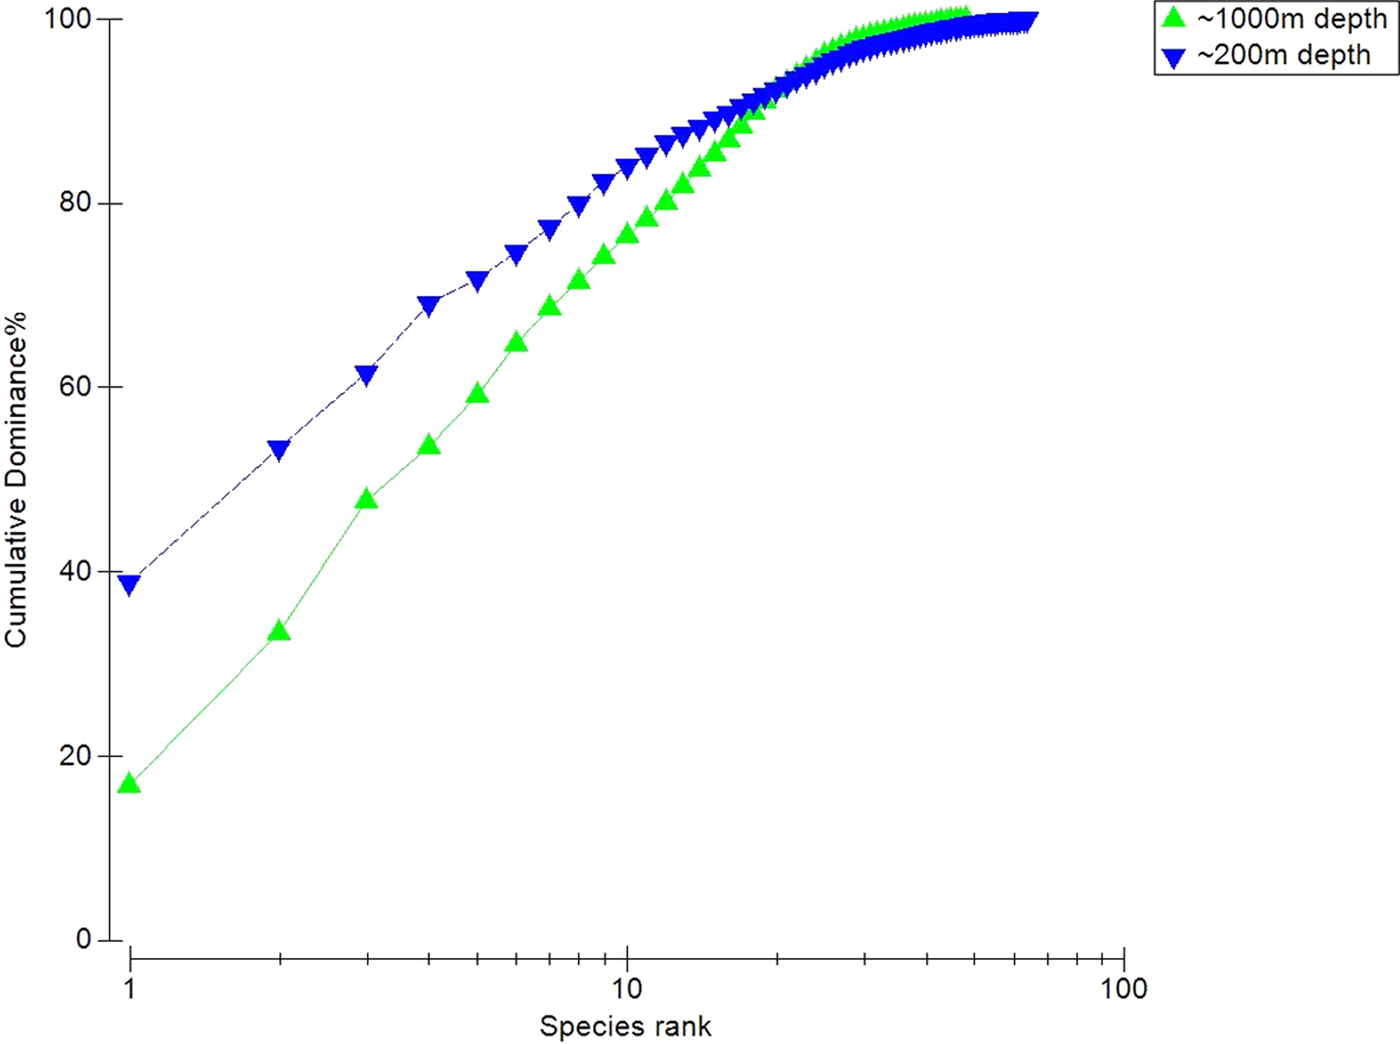
K-dominance curves (Figure 5) for the two depth zones (~200 m and ~1000 m) were plotted. From this curve, in the ~200 m depth zone a single species contributes 40% of total abundance and 10 species contribute 83% of the total abundance. Probability of a single species contribution is 17% and the 10 species contribute 71% of the total abundance in the 1000 m depth zone. In the two extreme zones of the mesopelagic region, the ~1000 m depth zone is more diverse than the ~200 m depth zone.
K-dominance plot for the two depth zones of the South-eastern Arabian Sea.

DISCUSSION
In all, 76 species were identified and listed. Many species observed during the research expedition have not been included in the list because the present study focuses on ichthyofaunal diversity and assemblage. The reports on species checklist is one of the important tools to identify species diversity, especially in the deep-sea ecosystem. In the present study, diversity indices are comparatively higher at ~1000 m isobaths. Sudhakar et al. (Reference Sudhakar, Sreedhar and Meenakumari2013) reported that species diversity increases with increase in depth up to 900 m in the South-eastern Arabian Sea. A similar phenomenon has been reported from the Gulf of Mexico (Bianchi, Reference Bianchi1991; Powell et al., Reference Powell, Haedrich and McEachran2003), Mediterranean Sea (Moranta et al., Reference Moranta, Steianescu, Massuti, Morales-Nin and Lloris1998) and North Atlantic Ocean (Merrett et al., Reference Merrett, Gordon, Stehmann and Haedrich1991; Farina et al., Reference Farina, Fereire and Gonzalez-Gurriran1997). Classical diversity indices are helpful to measure the status of the diversity, and it can be used as a reference point for continuing studies, thus helping in the analyses of the status of the deep-sea ecosystem of this area.
Cluster analysis reveals the entirety of the different species assemblage and community structure in the two different depth zones. Diversity and species assemblages change according to depth. None of the species at 200 m are represented at 1000 m and the two depth zones (~200 and ~1000 m) are the two extremes of the mesopelagic realm. Currently the deep-sea bottom of the South-eastern Arabian Sea is not exploited for commercial fishing; these diversity values will be useful for future analyses if the area is exploited in the future.
The K-dominance plot of the 10 sampled stations of the South-eastern Arabian Sea is quite sigmoidal in shape. It reveals an undisturbed ecosystem in the deep waters of the study area. Bottom trawling operations in the region are limited to depths of 100–150 m. So the deep ecosystem is currently undisturbed by commercial trawlers. Dominance plot for the two different depth zones reveals that ~1000 m depth is more diverse than ~200 m depth.
ACKNOWLEDGEMENTS
The authors are grateful to the director of CMLRE and the chief scientist. They gratefully acknowledge the Captain, Fishing Master and the crews of FORV ‘Sagar Sampada’ for their heartfelt support. The authors are also thankful to Miss Ashleigh Sladen (Plymouth University, UK) for proofreading the manuscript.
FINANCIAL SUPPORT
The authors undertook the work reported here as a part of DS&DWF-MLR Project, Deep-sea and Distant Water Fishery (DS&DWF). Financial assistance was given by the Ministry of Earth Sciences, Government of India.