Introduction
Opisthorchis pedicellata Verma (1927) was described from two siluroids Rita rita Hamilton, 1822 and Bagarius bagarius Hamilton, 1822 in Lucknow (India). We have also collected numerous specimens of O. pedicellata from type hosts and locality. Morphologically, the worms are similar in terms of ratio of suckers, position of cirrus sac and extension of vitelline follicles, and arrangement of gonads. Recent molecular biology techniques permit discrimination between closely related species by comparing ribosomal DNA (rDNA) sequences. Earlier workers have used nuclear ribosomal DNA sequences to confirm the identity of some digeneans, namely Dicrocoelium dendriticum (Bian et al., Reference Bian, Zhao, Jia-Fang, Cheng, Du, Ma and Lin2013), Clonorchis sinensis (Xiao et al., Reference Xiao, Gao, Cai, Dai, Yang, Luo, Agatsuma and Wang2013), Glypthelmins (Razo-Mendivil et al., Reference Razo-Mendivil, Léon-Règagnon and De-Léon2004), Crassicutis cichlasomae (Razo-Mendivil et al., Reference Razo-Mendivil, Vázquez-Domínguez, Rosas-Valdez, Pérez-Ponce de León and Nadler2010) and Maritrema eroliae (Al-Kandari et al., Reference Al-Kandari, Al-Bustan and Alnaqeeb2011). The rDNA cluster is useful for platyhelminth systematics due to highly repeated and variable regions flanked by more conserved regions (Adlard et al., Reference Adlard, Barker, Blair and Cribb1993). The 18S rDNA gene is highly conserved, relatively slowly evolving and infers the phylogenetic relationship between major phyla (Hillis & Davis, Reference Hillis and Davis1986). However, the internal transcribed spacer (ITS) region, including ITS1 and ITS2 rDNA, is fast evolving and highly variable. ITS1 and ITS2 are used as diagnostic markers for species recognition (Chen et al., Reference Chen, Chang, Wei, Chen, Lein, Lin, Dai and Wallace2004; Nolan & Cribb, Reference Nolan and Cribb2005; Littlewood, Reference Littlewood2008). rRNA secondary structures have been used to support phylogenetic studies through reconstructing the most advantageous alignments. They provide morphological information of the molecule as a supplementary source of data and clarify appropriate models of evolution (Coleman, Reference Coleman2003, Reference Coleman2007; Subbotin et al., Reference Subbotin, Sturhan, Vovlas, Castillo, Tambe, Moens and Baldwin2007). The secondary structure of the ITS2 region has also proved to be an additional tool for systematic and taxonomic studies, due to a highly conserved core with four helices and some common motifs (Coleman, Reference Coleman2003, Reference Coleman2009; Selig et al., Reference Selig, Wolf, Müller, Dandekar and Schultz2008; Ghatani et al., Reference Ghatani, Shylla, Tandon, Chatterjee and Roy2012). We have therefore analysed rDNA to confirm whether O. pedicellata sp. 1 isolated from R. rita is identical to O. pedicellata sp. 2 from B. bagarius, and to establish their phylogeny with other members of the family Opisthorchiidae Looss, 1899 using various nuclear DNA (18S, ITS1 and ITS2 rDNA) regions. Additionally, secondary structures of rDNA of both the isolates were also reconstructed.
Materials and methods
Collection and examination of flukes
Forty-five adult specimens of Opisthorchis were obtained from the gall bladder of the freshwater fish, R. rita Hamilton, 1822 and 36 specimens from B. bagarius Hamilton, 1822, from the River Gomti in Lucknow, located at 26.50°N, 80.50°E, UP, India. The prevalence of infection from ten specimens of each fish species was 80% in R. rita and 60% in B. bagarius. The parasites were studied alive, followed immediately by fixation in 70% alcohol, stained with aceto-alum carmine, dehydrated in ascending grades of alcohol, cleared in clove oil and mounted in DPX. Figures were drawn using a camera lucida, attached to a phase-contrast microscope (Olympus CX-41; Olympus, Tokyo, Japan).
Molecular analysis
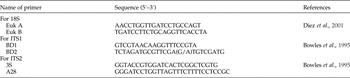
The genomic DNA of both adult flukes (O. pedicellata sp. 1 and O. pedicellata sp. 2) were extracted separately using DNeasy Tissue Kit (Qiagen, Hilden, Germany), with few modifications, and stored at −20°C. For polymerase chain reaction (PCR) amplification, universal primers of different rDNA marker gene regions (18S, ITS1 and ITS2) were used (table 1). Each PCR amplification reaction was performed in a final volume of 12.5 μl, containing 10× buffer (100 mm Tris, pH 9.0), 50 mm KCl and 15 mm MgCl2, 2.5 U Taq polymerase enzyme, 10 mm of each deoxynucleoside triphosphate (dNTP) and 3 μl DNA. The PCR conditions were as follows: initial denaturation at 94°C for 5 min; annealing for 18S at 58°C (1.10 min), ITS1 at 54°C (1.10 min) and ITS2 at 57°C (1.10 min); and final extension at 72°C for 10 min. PCR products were checked on 2% agarose gels in TAE (Tris–acetic acid–EDTA) buffer, stained with ethidium bromide (EtBr) and visualized under ultraviolet (UV) light. The purified PCR products were subjected to sequencing. Sequencing was carried out by Amnion Biosciences, Bangalore, on an automated sequencer (Model Name 3130 × 1/3130x/GA-1203-019). The sequences obtained were deposited in GenBank.
Primers used in this study.

Phylogenetic analysis
To evaluate the relationship, Basic Local Alignment Search Tool (BLAST, http://www.ncbi.gov/blast) was used for a sequence homology search. Nucleotide sequences were aligned by Clustal W (Thompson et al., Reference Thompson, Higgins and Gibson1994). BioEdit 7.0.9.0 (Hall, Reference Hall1999) software was used for manual alignment and sequence identity matrix. GC calculator (http: www.genomicsplace.com/gc_calc.html) was used to calculate GC percentage. Phylogenetic and molecular evolutionary analysis was done using MEGA 6 (Tamura et al., Reference Tamura, Stecher, Peterson, Filipski and Kumar2013). The phylogenetic trees were constructed using neighbour-joining (NJ) and maximum parsimony (MP) methods. Branch support was given using 1000 bootstrap replicates in MEGA 6 (Hillis & Bull, Reference Hillis and Bull1993).
Secondary structures, prediction and analysis
Secondary structures of 18S, ITS1 and ITS2 rDNA sequences of both the isolates of Opisthorchis were predicted by Mfold software version 3.2, using minimum free-energy folding algorithms (Zuker, Reference Zuker2003). RNA was folded at a fixed temperature of 37°C and the structure chosen from different output files. The ITS2 rDNA includes flanking 5.8S and 28S sequences, so these sequences annotated firstly changed using hidden Markov models (HMM) to retrieve the exact sequence of the region (Keller et al., Reference Keller, Schleicher, Schultz, Müller, Dandekar and Wolf2009; Koetschan et al., Reference Koetschan, Förster, Keller, Schleicher, Ruderisch, Schwarz, Müller, Wolf and Schultz2010) available at http://its2.bioapps.biozentrum.uniwuerzburg.de/. The consensus secondary structure was generated using LcoARNA software (Will et al., Reference Will, Reiche, Hofacker, Stadler and Backofen2007).
Results
Morphology
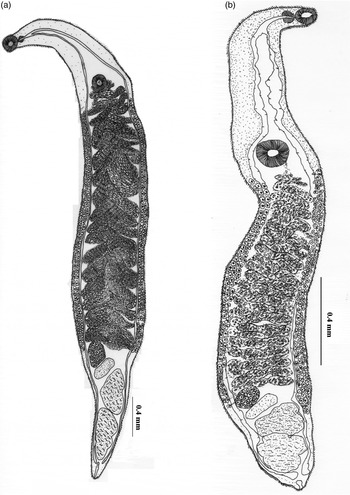
Two isolates of Opisthorchis (O. pedicellata sp. 1, O. pedicellata sp. 2) are described morphologically (fig. 1a and b).
The morphology of (a) Opisthorchis pedicellata sp. 1, (b) Opisthorchis pedicellata sp. 2.

Opisthorchis pedicellata sp. 1
Body elongated, flattened, spinose 12.00–14.20 mm × 0.23–0.26 mm. Oral sucker oval, terminal, 0.03–0.05 mm × 0.2–0.05 mm. Ventral sucker almost equal to oral sucker, 0.03–0.05 mm × 0.035–0.042 mm. Pre-pharynx present. Pharynx 0.01–0.02 mm × 0.012–0.018 mm. Intestinal caeca extending up to hind end of the body. Testes tandem, more or less lobed, close to each other in posterior region of body, 0.10–0.15 mm × 0.04–0.07 mm, 0.13–0.17 × 0.06–0.08 mm. Vitellaria extracaecal, extended slightly from the level of ventral sucker up to the anterior margin of ovary. Genital pore median, pre-acetabular. Uterus convoluted, filled with eggs, extended from the level of ventral sucker up to the level of ovary. Ovary rounded, pre-testicular, 0.06–0.08 mm × 0.04–0.06 mm. Eggs oval, operculated, 0.01–0.02 mm × 0.01–0.01 mm.
Opisthorchis pedicellata sp. 2
Body elongated, flattened, spinose 12.13–14.13 mm × 0.25–0.28 mm. Oral sucker oval, terminal, 0.02–0.04 mm × 0.063–0.068 mm. Ventral sucker almost equal or slightly larger than oral sucker, 0.010–0.12 mm × 0.11–0.13 mm. Pre-pharynx present. Pharynx 0.01–0.02 mm × 0.01–0.02 mm. Intestinal caeca extend up to hind end. Testes tandem, more or less lobed, close to each other in posterior region of body, 0.12–0.15 mm × 0.10–0.11 mm, 0.13–0.15 × 0.14–0.16 mm. Vitellaria extracaecal, extended slightly from the level of ventral sucker up to the anterior margin of ovary. Genital pore median, pre-acetabular. Uterus convoluted, filled with eggs, extended from the level of ventral sucker up to the level of ovary. Ovary rounded, pre-testicular, 0.03–0.06 mm × 0.07–0.09 mm. Eggs oval, operculated, 0.01–0.02 mm × 0.01–0.01 mm.
Molecular analysis
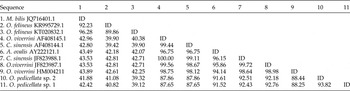
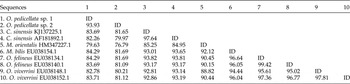
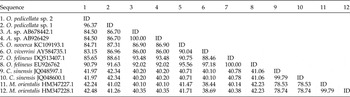
The nucleotide sequences obtained in this study were submitted to the GenBank database (National Center for Biotechnology Information) under the following accession numbers: O. pedicellata sp. 1 KU688151 (18S), KU688152 (ITS1) and KU688153 (ITS2), and O.pedicellata sp. 2 KU726243 (18S), KU716043 (ITS1) and KU716042 (ITS2). Data used in the present study were retrieved from GenBank. The amplicons of different markers for both isolates of Opisthorchis (O. pedicellata sp. 1 and O. pedicellata sp. 2) were of length 359 and 422 bp for 18S; 771 and 772 bp for ITS1; and 482 and 620 bp for ITS2. G + C content was 46–47% (18S); 51% (ITS1) and 49–51% (ITS2), respectively. Pairwise alignment of 18S sequences revealed the intraspecific variation (1.6%) in which three transitions and three transversions at six nucleotide sites were found. In contrast to 18S, data of intraspecific variation of ITS1 and ITS2 sequences were found to be more variable. The 1.9% intraspecific variation of ITS1 expressed 13 transitions and 17 transversions at 30 nucleotide sites, and that of ITS2 (2.6%) revealed seven transitions and six transversions at 13 nucleotide sites. In all, multiple sequence alignment results showed that the 18S sequence comprised 50% conserved, 47% variable and 33% parsimony-informative sites, whereas ITS1 sequence had 76% conserved, 19% variable and 11% parsimony-informative sites, while the ITS2 sequence had 37% conserved, 61% variable and 55% parsimony-informative sites. Sequence identity matrices for each marker are given in tables 2, 3 and 4.
Sequence identity matrix (%) for the 18S sequence of various members of the family Opisthorchiidae, as retrieved from GenBank. ID, identical.

Sequence identity matrix (%) for ITS1 sequences of the various members of the family Opisthorchiidae as retrieved from GenBank. ID, identical.

Sequence identity matrix (%) for ITS2 sequences of the various members of Opisthorchiidae as retrieved from GenBank. ID, identical.

Phylogenetic analysis
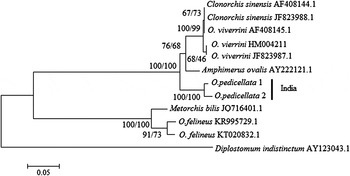
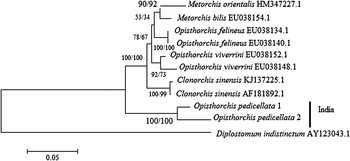
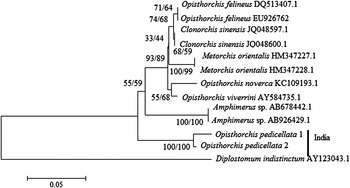
Phylogenetic trees were constructed by comparing both the sequences of Opisthorchis, using 18S, ITS1 and ITS2 of other members of the family Opisthorchiidae. Phylogenetic analysis based on distance (NJ) and character-based method (MP) showed similar topology (figs 2, 3 and 4). All the phylogenetic trees show the intra- and interspecies relationships, revealing closeness to each other with significant support (>70%). Diplostomum indistinctum (Diplostomidae Poirier, 1886) was used as an outgroup.
Tree depicting relationships between O. pedicellata sp. 1 and O. pedicellata sp. 2 inferred from 18S rRNA gene sequence data, using members of the Opisthorchiidae family for phylogenetic analysis. The tree is constructed using the neighbour-joining (NJ) and maximum parsimony (MP) methods.

Tree depicting relationships between O. pedicellata sp. 1 and O. pedicellata sp. 2 inferred from ITS1 rRNA gene sequence data, using members of the Opisthorchiidae family for phylogenetic analysis. The tree is constructed using the neighbour-joining (NJ) and maximum parsimony (MP) methods.

Tree depicting relationships between O. pedicellata sp. 1 and O. pedicellata sp. 2 inferred from ITS2 rRNA gene sequence data, using members of the Opisthorchiidae family for phylogenetic analysis. The tree is constructed using the neighbour-joining (NJ) and maximum parsimony (MP) methods.

Secondary-structure prediction and analysis
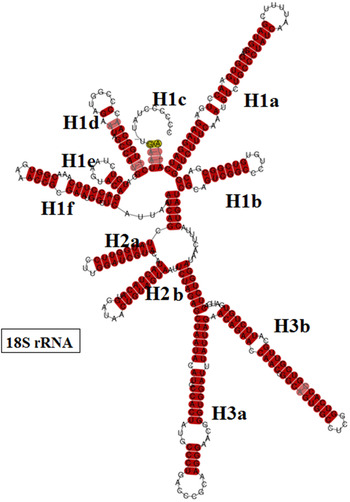
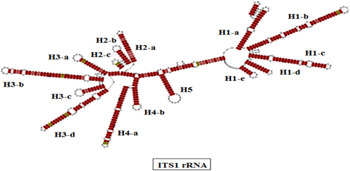
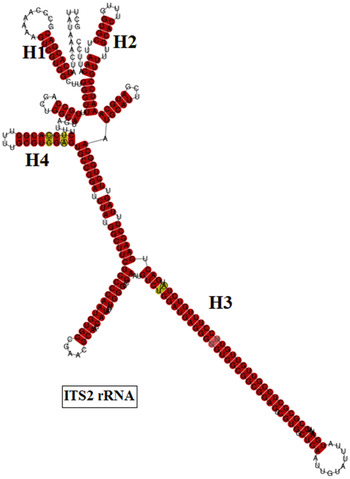
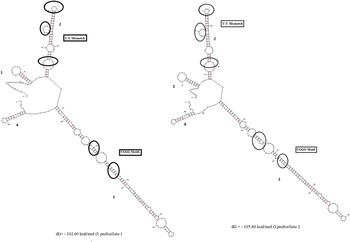
The secondary structures of 18S, ITS1 and ITS2 rRNA regions of both the species were generated, based on the consensus of sequences–structure of each of the domains, to determine variation in the helices/loops, using LcoARNA (figs 5, 6 and 7). 18S rRNA has a length of 359 bp and is comprised of three helices (H1–H3). H1 has six sub-helices and H2 and H3 have two sub-helices. In H1 and H3, sub-helices H1c, H1d and H3b show the smallest degree of conservation amongst the helices. The ITS1 rRNA secondary structure, having a length of 764 bp, comprises five helices (H1–H5), of which H1 has five sub-helices, H2 has three and H3 has four, and H4 has two sub-helices. H5 is a single helix. H1 and H5 show a high degree of conservation. The consensus structure of ITS2 helices H3 and H4 show the smallest degree of conservation, and helices H1 and H2 are the most conserved in their sequences, with no mismatches. The secondary structures of the annotated ITS2 sequences, having a length of 288 bp were analysed. The secondary structures demonstrate the typical four-helix model, with calculated minimum free energy −102.60 kcal/mol for O. pedicellata sp. 1 and −105.60 kcal/mol for O. pedicellata sp. 2 (fig. 8). Helices 1 and 4 of this model were found to be relatively very short, helix 2 having three U–U mismatches and helix 3 being the longest with two UGGG motifs.
The LcoARNA output for 18S rRNA: the predicted RNA structure in dot-bracket format; pairing reliabilities are colour-coded as per the Vienna RNA conservation colouring scheme.

The LcoARNA output for ITS1 rRNA: the predicted RNA structure in dot-bracket format; pairing reliabilities are colour-coded as per the Vienna RNA conservation colouring scheme.

The LcoARNA output for ITS2 rRNA: the predicted RNA structure in dot-bracket format; pairing reliabilities are colour-coded as per theVienna RNA conservation colouring scheme.

Inferred secondary structures of ITS2 regions; the U–U mismatch in helix 2 and UGGG in helix 3 are shown.

Discussion
PCR amplification and DNA sequencing provide a significant approach for distinguishing the morphological identity as well as genetic variability of closely related parasites (Nolan & Cribb, Reference Nolan and Cribb2005; Olson & Tkach, Reference Olson and Tkach2005). However, rDNA demonstrates significant intra- and interspecific variability among parasitic species and includes varying rates of evolution, from highly conserved (18S, 5.8S, 28S) to highly variable internal transcribed and non-transcribed or intergenic spacer regions (ITS1 and ITS2), the most commonly studied region for the investigation of species’ boundaries in digeneans (Hillis & Dixon, Reference Hillis and Dixon1991). The 18S sequences showed low intraspecific variability and confirmed that both the isolates of O. pedicellata were quite similar and differed only at six nucleotide sites (three transitions and three transversions) of 359 base positions. The 18S rDNA sequence is not a very useful marker for species discrimination, but is a helpful marker for higher taxonomic levels within the platyhelminths (Blair & Barker, Reference Blair and Barker1993; Shylla et al., Reference Shylla, Ghatani and Tandon2013). Intraspecific variation of the ITS1 sequence (1.9%) exhibits 13 transitions and 17 transversions at 30 nucleotide positions. However, in D. dendriticum it differs by 0.5% (Bian et al., Reference Bian, Zhao, Jia-Fang, Cheng, Du, Ma and Lin2013), 1.7% in C. sinensis (Xiao et al., Reference Xiao, Gao, Cai, Dai, Yang, Luo, Agatsuma and Wang2013), 1.0–5.2% in C. cichlasomae (Razo-Mendivil et al., Reference Razo-Mendivil, Vázquez-Domínguez, Rosas-Valdez, Pérez-Ponce de León and Nadler2010) and 10.9% in M. eroliae (Al-Kandari et al., Reference Al-Kandari, Al-Bustan and Alnaqeeb2011). The intraspecific variation in ITS2 sequences was found to be higher (2.6%) than those of the other molecular markers used in the present study, having seven transitions and six transversions at 13 nucleotide sites. In Glypthelmins, it was reported to differ by 5.44% (Razo-Mendivil et al., Reference Razo-Mendivil, Léon-Règagnon and De-Léon2004) and by 1.3% in D. dendriticum (Bian et al., Reference Bian, Zhao, Jia-Fang, Cheng, Du, Ma and Lin2013). A high degree of inter- and intraspecific genetic divergence at generic and species level is usually provided by the ITS2 region (McManus & Bowles, Reference McManus and Bowles1996; Itagaki et al., Reference Itagaki, Tsumagari, Tsutaumi and Chinone2003; Rinaldi et al., Reference Rinaldi, Perugini, Capuano, Fenizia, Musella, Veneziano and Cringoli2005; Ghatani et al., Reference Ghatani, Shylla, Tandon, Chatterjee and Roy2012), which was also observed in the present study. Phylogenetic studies utilizing nuclear DNA depicted a close association of 18S, ITS1 and ITS2 (100%) between both the isolates under study.
Secondary-structure prediction based on sequence–structure alignment helps in providing an accurate estimation of nucleotide similarity, which is sourced from the same evolutionary origin (Chilton et al., Reference Chilton, Hoste, Newton, Beveridge and Gasser2001). Secondary structures of 18S are valuable tools for phylogenetic studies (Hwang et al., Reference Hwang, Ree and Kim2000; Shylla et al., Reference Shylla, Ghatani and Tandon2013). Furthermore, the secondary structure of ITS2 also plays a vital role in phylogenetic analysis by searching for the best homology and generating optimal alignment between nucleotides (Subbotin et al., Reference Subbotin, Sturhan, Vovlas, Castillo, Tambe, Moens and Baldwin2007; Hongwei et al., Reference Hongwei, Overstreet and Subbotin2008). ITS2 is widely used as an effective marker for phylogenetic analysis of many individuals at lower taxonomic levels (Lott et al., Reference Lott, Burns, Zancope-Oliveira, Elie and Reiss1998; Murrell et al., Reference Murell, Campbell and Barker2001; Chen et al., Reference Chen, Chang, Wei, Chen, Lein, Lin, Dai and Wallace2004; Hongwei et al., Reference Hongwei, Overstreet and Subbotin2008). The ITS2 secondary structure demonstrates a remarkable four-helix model, which is common to almost all the eukaryotic taxa (Coleman, Reference Coleman2003; Schultz et al., Reference Schultz, Maisel, Gerlach, Müeller and Wolf2005). The comparative study of both isolates of O. pedicellata showed relatively short helices (1 and 4), three U–U mismatches in helix 2 and the longest helix (3) having two UGGG motifs. The consensus secondary structure of both isolates of O. pedicellata shows a high degree of conservation and the lowest degree of variation in base composition of helices of rRNA genes (18S, ITS1 and ITS2). The molecular data also displayed a high degree of homogeneity, with some variations in both the isolates. We are therefore of the opinion that both the isolates of O. pedicellata are of the same species, and that the variations may be due to different host species of the same family, living in a sympatric environment.
Acknowledgements
We are grateful to Professor K.C. Pandey of the Department of Zoology for helpful suggestions.
Financial support
Financial assistance to K.C. under a Rajiv Gandhi National Fellowship of UGC: F1-17.1/2013-14/RGNF-SC-UTT-51511/(SA-III) is acknowledged. Facilities developed under UGC-SAP (DRS-I and II), DST-PURSE, UGC-BSR (NA F-4-10/2010 BSR), Department of Zoology, University of Lucknow, Lucknow were also utilized for the present work.
Conflict of interest
None.