Direct observation of hand hygiene compliance is the gold standard for assessing and the basis for promoting hand hygiene. However, it is resource-consuming and provides only a momentary snapshot of performance. Considerable bias, known as the Hawthorne effect, has to be taken into account when interpreting such data,Reference Hagel, Reischke and Kesselmeier 1 although enhancing compliance by means of observation may be intended.Reference Haessler 2 In 2 earlier studies of shorter duration (≤20 weeks), no correlation between hand disinfectant consumption and compliance was found.Reference Sodre da Costa, Neves and Marra 3 , Reference Magnus, Marra and Camargo 4 We sought to determine the role of hand disinfectant consumption as a surrogate marker for hand hygiene compliance over a period of several years.
METHODS
Starting in 2007, we observed hand hygiene compliance once a year (in multiple sessions over several days) in the 24 major departments of our tertiary care hospital. Indications for hand disinfection are in accordance with the Five Moments for Hand HygieneReference Sax, Allegranzi, Chraiti, Boyce, Larson and Pittet 5 propagated by the World Health Organization in 2009. We calculated hand hygiene compliance as the rate of performed disinfections per observed indications in any healthcare worker involved in clinical care during an observation period of approximately 20 minutes. Usually, a monitoring period was announced ahead of time, and it was conducted in a transparent manner for the observed personnel. Hand hygiene compliance rates were subsequently communicated to the respective department.
Information on hand disinfectant consumption was ascertained using departmental orders from a single source, the hospital pharmacy. All handrub products were alcohol-based.
The total number of patient-days was gathered from internal controlling reports, which have been available since 2008. The officially mandated calculation changed in 2012 such that the day of hospital discharge was systematically omitted. To compensate for this, we added 1 patient-day to each case from 2012 onwards. With hand hygiene observations being part of routine quality assessment in our institution, no institutional review board approval was necessary for this project.
Values are expressed as means with 95% confidence intervals (95% CIs) for normally distributed continuous variables or as medians with interquartile ranges to describe nonnormally distributed variables, as appropriate. We first calculated mean annual compliance rates for all departments observed. For the assessment of correlation, we applied the Spearman rank test (in line with similar correlation studiesReference Sodre da Costa, Neves and Marra 3 , Reference Marra, Moura, Paes, dos Santos and Edmond 6 ).
In a second step, we used a linear mixed effects multilayer regression model with a department identifier as group variable (random effect) to analyze the association of handrub consumption with observed hand hygiene compliance, adjusted for the volume of patient-days and the observation year. This model was chosen to account for the substantial variability in handrub consumption between individual departments. The distributions of observed compliance, disinfectant use, and patient-days all appeared to be skewed. Suitable transformations were used to achieve normality.
Calculations were performed using Stata, version 12.1 (StataCorp, College Station, Texas). All testing was 2-tailed and P<.05 was considered to indicate statistical significance.
RESULTS
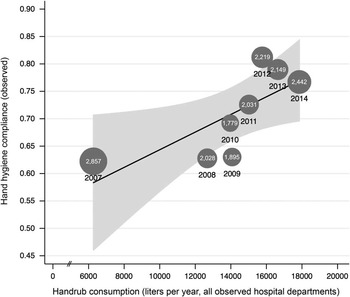
We collected hand hygiene compliance data from 2007 to 2014, with a median (interquartile range) of 2,095 (1,889–2,461) observed indications per year. The mean observed compliance rate was 0.71 (95% CI, 0.64–0.77) and increased over time from 0.62 in 2007 to 0.77 in 2014 ( Figure 1 ). An annual average of 14,033 L (95% CI, 11,077–16,989 L) of hand disinfectant was used in the observed departments, and mean consumption across the hospital increased from 6,270 L in 2007 to 17,854 L in 2014. Variability between departments was substantial, even after adjustment for the volume of patient-days. In 2014, median (interquartile range) disinfectant use across all departments was 65 (42–89) mL/patient-day, highest in the intensive care unit (226 mL/patient-day) and lowest in the ophthalmology department (26 mL/patient-day). This notable difference most likely represents a higher intensity of nursing care and more physician visits per patient-day in the intensive care unit than elsewhere. Likewise, the volume of patient-days increased from 298,415 to 324,725 between 2008 and 2014.
Correlation of handrub consumption and hand hygiene compliance (95% CI between lines in light gray area), including annual number of observed indications (dark gray circles).

There was a significant correlation over time between volume of disinfectant used for handrubs and hand hygiene compliance (P=.004, rho=0.881 for the Spearman rank test). Disinfectant use also continually increased over time (P<.001, rho=0.976). Similar positive correlations were found for hand hygiene compliance with time (P=.002, rho=0.905) and for the volume of patient-days with time (P<.001, rho=0.964).
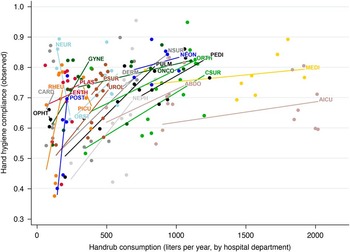
Given the considerable variability in handrub consumption between the departments ( Figure 2 ), we adjusted for “patient-days” as a fixed effect and modeled “department” as a random effect in a mixed model.
Comparison of observed hand hygiene compliance and handrub consumption grouped for each department in a different color. Each annual observation and handrub measurement is represented by a dot. Trend lines are derived from linear regression on the respective department. ABDO, department of abdominal surgery; AICU, adult intensive care unit; CARD, department of cardiology; CSUR, department of cardiac and vascular surgery; DERM, department of dermatology; ENTH, department of ear-nose-throat; GYNE, department of gynecology; MEDI, department of internal medicine; NEON, department of neonatology; NEPH, department of nephrology (including hemodialysis); NEUR, neurologic rehabilitation department; NSUR, department of neurosurgery; OBST, department of obstetrics; ONCO, department of oncology; OPHT, department of ophthalmology; ORTH, department of orthopedics; PEDI, department of pediatric internal medicine; PICU, pediatric intensive care unit; PLAS, department of hand and plastic surgery; POST, postanesthesia care unit; PSUR, pediatric surgery; PULM, department of pulmonology/thoracic surgery; RHEU, department of. rheumatology; UROL, department of urology.

In mixed effects regression analysis, even after adjustment for time, the observed compliance significantly correlated with handrub consumption (P=.005) and patient-days (P=.039). Of note, there was no correlation with the year of observation (P=.185) in the multivariable model.
DISCUSSION
The observed hand hygiene compliance rate correlated with handrub consumption and the volume of patient-days in the departments. This finding was not related to time (ie, the year of observation). Substantial variability was noticed between the departments, which was accounted for in the model, and which could be attributed to a number of possible factors. A major determinant is likely to be intensity of nursing care in a given department (patient turn-over, frequency of care measures): Handrub use in the intensive care unit outweighed that in the ophthalmology ward by far, although a similar hand hygiene compliance was observed ( Figure 2 ). Of note, the mean effect estimated from the mixed effects model describes the overall situation in the hospital, whereas individual departments may vary considerably.
One limitation is that we cannot rule out that aliquots used for handrub differed between the departments. Another limitation is that denominator data (patient-days) had to be adjusted because changes in the administrative data occurred during the study period. Accuracy of the gold standard may be limited and biased by the Hawthorne effect because direct observations included only a single assessment per year and department. This appears to be standard practice in other hospitals as well because resources for observations are limited. Notwithstanding this, the stable results and the positive correlation with handrub consumption support its validity. It is also important to note that hand hygiene observations are not designed to assess an individual’s disinfection technique as this is difficult to measure.Reference Tschudin-Sutter, Sepulcri, Dangel, Schuhmacher and Widmer 7 The increasing availability of electronic disinfection counting devices offers new perspectives to account for this.Reference Boyce 8 , Reference Morgan, Pineles and Shardell 9
Compared with the only 2 other studies, lasting 17 weeksReference Sodre da Costa, Neves and Marra 3 and 20 weeks,Reference Magnus, Marra and Camargo 4 in which no significant correlation could be demonstrated between handrub use and hand hygiene compliance, our 8-year study included far more observations using a linear mixed effects regression model. In the former study Sodre da Costa et alReference Sodre da Costa, Neves and Marra 3 tested for correlation by Spearman rank test in a single department, while in the latter study, similar to our approach, Magnus et alReference Magnus, Marra and Camargo 4 applied a normal linear mixed model in 3 selected departments.
In conclusion, disinfectant ordering data provides additional and readily available information on trends in hand hygiene compliance, thus complementing direct observations, the gold standard. Regular visits to each hospital department for hand hygiene observations should not be discontinued; they serve an additional purpose in providing infection prevention with a platform for hand hygiene education. However, because the Hawthorne effect and sporadic assessments limit the accuracy of this gold standard, consumption trend analyses may enhance traditional hand hygiene surveillance methods and may help when evaluating unexpected changes in compliance.Reference Magnus, Marra and Camargo 4 , Reference Marra, Moura, Paes, dos Santos and Edmond 6 , Reference Morgan, Pineles and Shardell 9
ACKNOWLEDGMENTS
We thank the entire infection prevention team and the link nurses of the University Clinic for Hospital Epidemiology who contributed to the repeated hand hygiene observations since their implementation in 2007.
Financial support. None reported.
Potential conflicts of interest. J.M. reports that he received honoraria for advisory boards and consulting fees from Astellas, and S.H. reports that he received honoraria for advisory boards from Gilead; all remunerations went to their home institutions. All other authors report no conflicts of interest relevant to this article.