1. Introduction
The theory of plate tectonics assumes that plates are rigid, and that motion occurs only along plate boundaries (Hess, Reference Hess, Engel, James and Leonard1962; Vine & Matthews, Reference Vine and Matthews1963; Wilson, Reference Wilson1965; Morgan, Reference Morgan1968; McKenzie & Morgan, Reference McKenzie and Morgan1969; Zheng et al. Reference Zheng, Chen, Dai and Zhao2015); however, within continents, buoyant crust can become detached from the underlying mantle and form mountain ranges and extensive tectonic belts (Gordon & Stein, Reference Gordon and Stein1992; Gordon, Reference Gordon1998). In fact, continental plate boundaries can be reactivated to form intracontinental tectonic belts or orogens, such as the Pyrenean, Alice Springs and Laramide orogens (Brown, Reference Brown1988; Goleby et al. Reference Goleby, Shaw, Wright, Kennett and Lambeck1989; Dunlap et al. Reference Dunlap, Teyssier, McDougall and Baldwin1995; Beaumont et al. Reference Beaumont, Munoz, Hamilton and Fullsack2000; English & Johnston, Reference English and Johnston2004; Copeland et al. Reference Copeland, Currie, Lawton and Murphy2017; Teixell et al. Reference Teixell, Labaume, Ayarza, Espurt, de Saint Blanquat and Lagabrielle2018); intracontinental tectonics therefore differ from classic plate tectonics. As such, further research on intracontinental tectonics is required.
Intracontinental orogenesis occurs in the interior of continents, far from plate boundaries, and is accompanied by reactivation of the pre-existing structural belts, crustal thickening, brittle deformation, and the creation of planar, diffuse fault distributions (Brown, Reference Brown1988; Goleby et al. Reference Goleby, Shaw, Wright, Kennett and Lambeck1989; Shaw et al. Reference Shaw, Etheridge and Lambeck1991; Dunlap et al. Reference Dunlap, Teyssier, McDougall and Baldwin1995; Zhang, Reference Zhang1999; Beaumont et al. Reference Beaumont, Munoz, Hamilton and Fullsack2000). Orogens and basins are the basic tectonic units within continents, and detailed research on these units is key for understanding intracontinental tectonics. Foreland basins develop during an orogeny as a result of loading by nearby orogenic highlands, and are also fed by the nearby orogen (Miall, Reference Miall and HSu2008). Intracontinental orogens are associated with flexural basins, and the depositional area is relatively small compared with plate boundary orogen–basin systems.
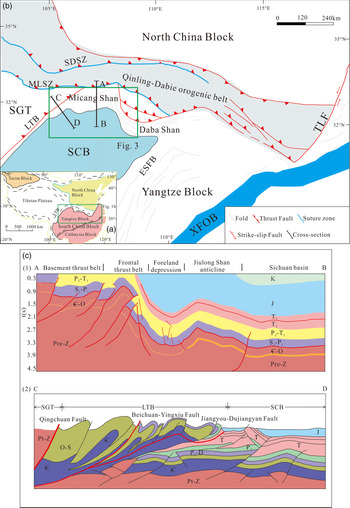
The Qinling orogenic belt in central China records the long-lived and multi-stage amalgamation of crustal blocks since the Proterozoic Eon (Meng & Zhang, Reference Meng and Zhang2000; Ratschbacher et al. Reference Ratschbacher, Hacker, Calvert, Webb, Grimmer, McWilliams, Ireland, Dong and Hu2003; Li et al. Reference Li, Meng, Duan and Li2014; Dong & Santosh, Reference Dong and Santosh2016; Li et al. Reference Li, He, Chen, Mei, Li and Zhang2016 a, b; Jiang et al. Reference Jiang, Ren, Zhou, Zhao, Liu and Sun2019). The orogenic belt can reveal the evolution of the North China and South China blocks (Fig. 1). However, its middle–late Mesozoic evolution remains controversial, and it is unclear if there was continuous collision between the North China and Yangtze blocks or intracontinental deformation. The Qinling–Dabie orogenic belt is thought to have been an intracontinental orogen since the Late Triassic Epoch (Li et al. Reference Li, Meng, Duan and Li2014, Reference Li, He, Chen, Mei, Li and Zhang2016 a, b; Dong & Santosh, Reference Dong and Santosh2016); but its formation time, phases and intracontinental deformation mechanisms are still debated. Moreover, it remains unknown whether there was a transition from a foreland to an intracontinental basin. Sedimentary basins preserve key information regarding surrounding orogenic belts (Dickinson & Suczek, Reference Dickinson and Suczek1979; McCann, Reference McCann1998; Carter & Moss, Reference Carter and Moss1999); study of the evolution of the Qinling orogenic belt and Sichuan Basin can therefore improve our understanding of intracontinental orogenesis.
Tectonic map and cross-section of the Sichuan Basin and adjacent orogenic belts. (a) Simplified tectonic map. A more detailed map is shown in (b). (b) Tectonic setting of the Sichuan Basin (modified from Ma et al. Reference Ma, Wang, Huang and Xie2019). Cross-sections A–B and C–D are shown in (c). The green rectangle indicates the area of Figure 3. (c) Interpreted seismic reflection profiles of the cross-sections in (b) (simplified from Xu et al. Reference Xu, Liu, Qu, Li, Sun and Liu2009; Fan et al. Reference Fan, Liu, Fan, Hu, Li, Mi, Han and Han2018). (1) Interpreted seismic profile through the Micang Shan tectonic belt, which can be divided into the basement thrust belt, frontal thrust belt, foreland depression, Jiulongshan anticline and Sichuan Basin. (2) Interpreted seismic reflection profile through the north of the Longmen Shan thrust belt, which is characterized by a thrust nappe structure and thrust duplex. ESFB – Eastern Sichuan fold-and-thrust belt; LTB – Longmen Shan thrust belt; MLSZ – Mianlue suture zone; SCB – Sichuan Basin; SDSZ – Shangdan suture zone; SGT – Songpan–Garzê terrane; TLF – Tan–Lu Fault; XFOB – Xuefeng Orogenic Belt.

In this study, we focused on the Lower Jurassic – Lower Cretaceous sedimentary sequences and structures in the northwestern Sichuan Basin, which is located to the south of the Qinling orogenic belt (Fig. 1b). The sedimentary sequences and structures were investigated in detail. Detrital zircons in the sedimentary rocks were dated and analysed for trace elements to determine their provenance and timing of deposition. Combined with information on the deformation and uplift of the surrounding tectonic belts, the spatiotemporal evolution of the depocentre and adjacent orogenic belt were reconstructed.
2. Geological background
2.a. Tectonic setting
The Sichuan Basin is located in SW China, and is one of the largest basins in the country. It is bounded by the Songpan–Garzê terrane (SGT) to the west, the Qinling orogenic belt to the north and the Xuefeng orogenic belt to the east (Fig. 1). The west Yangtze basement is mainly distributed in the Sichuan Basin and surrounding orogenic belts. The basement consists mainly of medium- to high-pressure mixed metamorphic crystalline complexes, and is divided into two units: Archean – lower Proterozoic (Ar–Pt1) and middle–upper Proterozoic (Pt2–Pt3) (Liu et al. Reference Liu, Li, Liu, Luo, Xu, Dai, Gong and Yong2006).
The Qinling orogenic belt has several branches to the west that connect with other tectonic belts, including the Songpan–Garzê terrane. The Micang Shan and Daba Shan tectonic belts, which are located in the southern Qinling orogenic belt, were affected by the Qinling orogeny during early Mesozoic time (Xu et al. Reference Xu, Liu, Qu, Li, Sun and Liu2009; Hu et al. Reference Hu, Chen, Qu, Wu, Yang and Zhang2012; Li et al. Reference Li, Zhang, Dong and Shing2013).
The Songpan–Garzê terrane is separated from the Sichuan Basin by the Longmen Shan thrust belt (LTB; Fig. 1). During Middle–Late Triassic time, the Songpan–Garzê terrane was covered with 5–15-km-thick turbidite deposits over an area > 200 000 km2 in the eastern Tibetan Plateau (Weislogel et al. Reference Weislogel, Graham, Chang, Wooden, Gherels and Yang2006; Enkelman et al. Reference Enkelman, Weislogel, Ratschbacher, Eide, Renno and Wooden2007). Silicic plutons were emplaced during the Permian–Jurassic periods in the Songpan–Garzê terrane (Yan et al. Reference Yan, Zhou, Qiu, Wells, Mu and Xu2018) and, in particular, syn- and post-orogenic granitoids were intruded during the Middle–Late Triassic and Early Jurassic epochs (Roger et al. Reference Roger, Malavieille, Leloup, Calassou and Xu2004; Weislogel, Reference Weislogel2008; Yuan et al. Reference Yuan, Zhou, Sun, Zhao, Wilde, Long and Yan2010). Post-orogenic extension commenced at 160 Ma and was accompanied by anatexis and granitoid intrusion (Xu et al. Reference Xu, Hou, Wang, Fu and Huang1992).
The LTB marks the eastern margin of the Tibetan Plateau, and is characterized by the sharp topographic transition from the > 5000-m-high Tibetan Plateau to the c. 500-m-high Sichuan Basin (Li et al. Reference Li, Liu, Chen, Deng, Hou, Wu and Cao2012). The LTB underwent multistage deformation during the Mesozoic and Cenozoic eras, and shows structural segmentation in strike and dip directions (Liu et al. Reference Liu, Li, Gao, Liu, Deng and Wang2009). Along the dip direction, the deformation progressed from NW to SE and changed from thick- to thin-skinned. Tectonism that occurred during the Mesozoic Era in the north is characterized by thrust nappes and duplexes (Fig. 1c; Fan et al. Reference Fan, Liu, Fan, Hu, Li, Mi, Han and Han2018), which is adjacent to our study area.
The LTB has been divided into three NE–SW-trending segments (the northern, central and southern segments) based on their different tectonic evolution (Li et al. Reference Li, Liu, Chen, Deng, Hou, Wu and Cao2012). The north of the LTB was influenced by the Qinling orogenic belt during the Mesozoic Era, and the south was influenced by uplift of the Tibetan Plateau during the Cenozoic Era.
The eastern Sichuan fold-and-thrust belt (ESFB; Fig. 1) is located in the eastern Sichuan Basin, and is separated from the Xuefeng orogenic belt to the east (Huang et al. Reference Huang, He, Li and Fan2019; Fig. 1). It is characterized by multi-layered detachments, and is divided into trough-like folds in the east and comb-like folds in the west (Zhang et al. Reference Zhang, Shan, Ni and Tan2015). The deformation changes from thick- to thin-skinned, and becomes younger towards the NW (Shi & Shi, Reference Shi and Shi2014). Uplift and erosion commenced at 164 Ma in the east and at 95–65 Ma in the west of the Xuefeng orogenic belt (Mei et al. Reference Mei, Liu, Tang, Shen and Fan2010).
2.b. Stratigraphy and tectonic evolution of the Sichuan Basin
The Sichuan Basin is a multi-cycle superimposed basin that developed on the basement of the Yangtze Block (Wang et al. Reference Wang, Zhao, Zhang and Wu2002). He et al. (Reference He, Li, Zhang, Zhao, Fan, Lu and Wen2011) divided the Sichuan Basin into four tectonostratigraphic sequences separated by unconformities or disconformities. Each sequence represents a basin evolution cycle. The lowest sequence is characterized by Yangtze-type Proterozoic basement that was a rift basin during the Neoproterozoic Era; sequences 2 and 3 were dominated by Palaeozoic marine carbonate deposition in the Proto- and Palaeo-Tethys, respectively; sequence 4 consists of Upper Triassic – Quaternary fluvial, deltaic and lacustrine deposits that formed in an intracontinental environment (He et al. Reference He, Li, Zhang, Zhao, Fan, Lu and Wen2011). The Upper Triassic Xujiahe Formation is widely distributed within the Sichuan Basin and is wedge-shaped. Its thickness decreases towards the east, based on an isopach map and seismic reflection profile (Meng et al. Reference Meng, Wang and Hu2005; He et al. Reference He, Li, Zhang, Zhao, Fan, Lu and Wen2011). The strike of the Lower Jurassic bedding trends E–W, and the thickness is uniform within the Sichuan Basin (Meng et al. Reference Meng, Wang and Hu2005; Shen et al. Reference Shen, Mei, Xu and Tang2007 a). The Middle Jurassic sediments are > 3000 m thick in the northeastern part of the basin, especially along the front of the Daba Shan tectonic belt (Meng et al. Reference Meng, Wang and Hu2005; Shen et al. Reference Shen, Mei, Xu and Tang2007 a). During the Late Jurassic Epoch, deposition occurred throughout the entire Sichuan Basin (Shen et al. Reference Shen, Mei, Xu, Tang and Tian2007 b). The Cretaceous sediments are a red terrestrial clastic sequence of conglomerate to mudstone (Wang et al. Reference Wang, Zhao, Zhang and Wu2002; Li et al. Reference Li, He, Chen, Mei, Li and Zhang2016 a). Cui et al. (Reference Cui, Long and Li1991) studied Upper Triassic – Lower Cretaceous conglomerates (i.e. the Jianmenguan Formation) along the Longmen Shan thrust belt to assess the palaeocurrent directions. This indicated that river flow occurred mainly towards the SE and ESE. Li et al. (Reference Li, He, Li, Wen, Mei, Li and Sun2016 b) also suggested that the dominant palaeocurrent direction in the northwestern Sichuan Basin was towards the south and SE during the Early Cretaceous Epoch, although some coeval NE-wards drainage developed during later deposition. The depocentre of the Sichuan Basin moved from the NW to the SW of the basin during the Late Cretaceous Epoch (Shen et al. Reference Shen, Mei, Xu and Tang2007 a; Li et al. Reference Li, He, Chen, Mei, Li and Zhang2016 a).
2.c. Uplift history of the northwestern Sichuan Basin
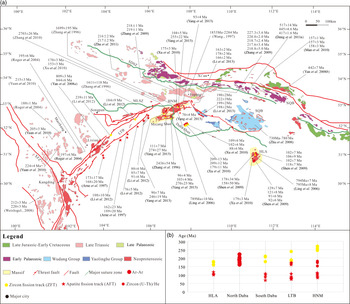
Low-temperature thermochronological analyses have been carried out to constrain the Mesozoic and Cenozoic uplift history in the area surrounding the NW of the Sichuan Basin (Fig. 2). Apatite (AFT) and zircon fission track (ZFT) data show that the north and south of the Daba Shan tectonic belt have similar cooling histories: two-stage uplift, with a first stage at 150–100 Ma and a second stage at 95–45 Ma (Fig. 1; Shen et al. Reference Shen, Mei, Xu, Tang and Tian2007 b; Li et al. Reference Li, Zhang, Dong and Li2010; Xu et al. Reference Xu, Zhou, Chang and Guillot2010; Shi et al. Reference Shi, Zhang, Dong, Hu, Wiesinger, Ratschbacher, Jonckheere, Li, Tian, Chen, Wu, Ma and Li2012), although there are small differences in the uplift rate and onset time. The (U–Th)/He thermochronology suggests that exhumation of the south of the Daba Shan tectonic belt began at 125–100 Ma (Tian et al. Reference Tian, Qiu, Kohn, Zhu, Hu, Gleadow and McInnes2012 b), which is later than in the north (Li et al. Reference Li, Zhang, Dong and Shing2013). The north of the Daba Shan tectonic belt underwent slow cooling at 135–95 Ma followed by relatively rapid cooling at 95–65 Ma (Li et al. Reference Li, Zhang, Dong and Li2010), whereas the south cooled rapidly at 150–100 Ma followed by relatively slow cooling at 100–45 Ma (Xu et al. Reference Xu, Zhou, Chang and Guillot2010).
(a) Simplified map showing the distribution of age data for magmatic rocks and low-temperature thermochronology (modified from Li et al. Reference Li, He, Li, Wen, Mei, Li and Sun2016 b). The low-temperature thermochronology data are distinguished by specific symbols (see the legend). The unmarked data are zircon U–Pb age. (b) A space–time diagram of the uplift history of the northwestern Sichuan Basin is shown. HLA – Huangling anticline; HNM – Hannan massif; LTB – Longmen Shan thrust belt; MLSZ – Mianlue suture zone; NQB – north Qinling belt; SDSZ – Shangdan suture zone; SQB – south Qinling belt.

Adjacent to the Daba Shan tectonic belt, the Huangling anticline and Hannan massif have similar cooling histories (Fig. 2). The uplift of the Huangling anticline can be divided into four stages: slow uplift at 200–160 Ma, rapid uplift at 160–100 Ma, a relatively stable stage at 100–45 Ma and rapid uplift after 45 Ma (Shen et al. Reference Shen, Mei, Liu and Xu2009; Xu et al. Reference Xu, Zhou, Chang and Guillot2010). The Hannan massif also experienced four-stage cooling: slow uplift at 230–150 Ma, rapid uplift at 150–105 Ma, slow uplift at 105–40 Ma and rapid uplift after 40 Ma (Xu et al. Reference Xu, Zhou, Chang and Guillot2010).
The Micang Shan tectonic belt adjoins the Hannan massif to the south, and the deformation of the Micang Shan tectonic belt changes from thick- to thin-skinned towards the south (Fig. 1c; Xu et al. Reference Xu, Liu, Qu, Li, Sun and Liu2009). Yang et al. (Reference Yang, Ratschbacher, Jonckheere, Enkelmann, Dong, Shen, Wiesinger and Zhang2013) suggested that the Hannan massif and Micang Shan tectonic belt experienced rapid cooling during the Middle Jurassic – Early Cretaceous epochs (165–95 Ma), followed by thermal stagnation at 95–10 Ma. The AFT data show that the uplift becomes younger from the Hannan massif towards the Micang Shan tectonic belt (Tian et al. Reference Tian, Zhu, Xu, Rao, Kohn and Hu2010, Reference Tian, Kohn, Zhu, Xu, Hu and Gleadow2012 a).
Low-temperature thermochronological studies have been carried out around the LTB and the margin of the Sichuan Basin (e.g. Arne et al. Reference Arne, Worley, Wilson, Chen, Foster, Luo, Liu and Dirks1997; Xu & Kamp, Reference Xu and Kamp2000; Clark et al. Reference Clark, House, Royden, Whipple, Burchfiel, Zhang and Tang2005; Godard et al. Reference Godard, Pik, Lave, Cattin, Tibari, Segoyer, Publlier and Zhu2009; Li et al. Reference Li, Liu, Chen, Deng, Hou, Wu and Cao2012). Li et al. (Reference Li, Liu, Chen, Deng, Hou, Wu and Cao2012) divided the cooling history along the LTB into five stages: Early Jurassic (c. 200 Ma), Late Cretaceous (c. 100 Ma), early Cenozoic (60–40 Ma), early Miocene (25–20 Ma) and late Miocene (14–9 Ma).
3. Sedimentary sequences and deformation of the northwestern Sichuan Basin
3.a. Sedimentary sequences and conglomerate distribution
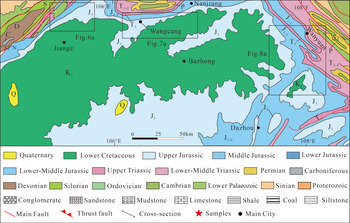
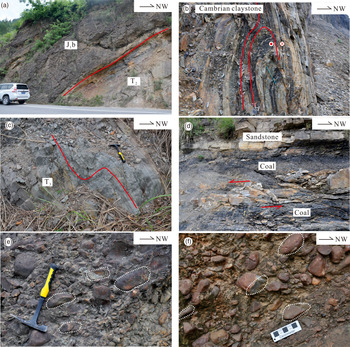
The strata in the northwestern Sichuan Basin range from pre-Ediacaran to Cretaceous in age, and the main exposed strata are Upper Triassic – Lower Cretaceous clastic rocks (Figs 3, 4). The Upper Triassic rocks are mainly grey quartzofeldspathic sandstone and siltstone, with intercalated shale and coal beds (Fig. 5d); based on field observations and cross-sections (Figs 5, 6), these have been strongly folded and sheared.

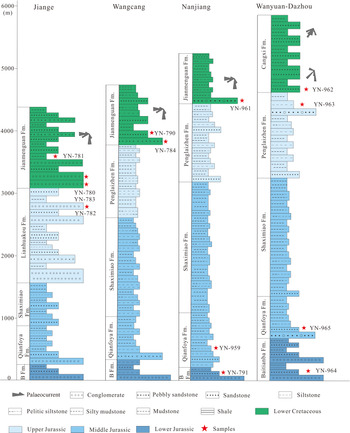
Schematic stratigraphy of the northwestern Sichuan Basin based on geological map. Red stars indicate sample locations. The palaeocurrent data are from Li et al. Reference Li, He, Li, Wen, Mei, Li and Sun(2016 b). Fm – Formation; B Fm – Baitianba Formation.

Field photographs showing the deformation and conglomerates in the NW Sichuan Basin. (a) Lower Jurassic strata disconformably overlying Middle Triassic strata along the front of the Longmen Shan thrust belt. (b) Two-stage deformation of Cambrian slate within the Longmen Shan thrust belt. (c) An upright open to gentle fold developed in Upper Triassic strata along the front of the Longmen Shan thrust belt. (d) Upper Triassic interbedded coal and sandstone with an oblique foliation that indicates left-lateral shear. (e, f) Conglomerates in the Lower Jurassic Baitianba and Lower Cretaceous Jianmenguan formations, near Jiange. The clasts are pebble- to cobble-sized and aligned.

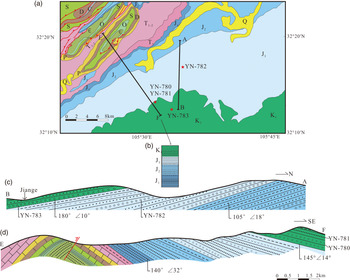
Geological map, stratigraphic column and cross-sections of the western part of the northwestern Sichuan Basin. (a) Geological map. (b) Lower Jurassic – Lower Cretaceous stratigraphy. (c)-(d) Cross-sections A–B and E–F. Legends as in Figure 3.

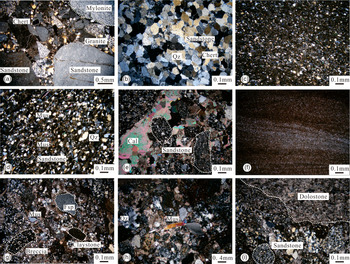
The Lower Jurassic Baitianba Formation is < 200–300 m thick and unconformably overlies Upper Triassic rocks (Figs 4, 6). The thickness and composition of the Baitianba Formation are uniform across our study area (Figs 4, 6–8). Oligomictic conglomerates occur at the base of the sequence and contain clasts of quartzite, chert and quartzose sandstone (Figs 5e, 9). Rounded granite and sandstone clasts are also found in the conglomerate, alongside occasional mylonite and mudstone clasts (Fig. 9a). The conglomerate is mostly clast-supported, and the composition of the conglomerate matrix is similar to the clasts (i.e. mainly quartzite, chert and quartzose sandstone), with characteristics typical of deposition in a fluvial or fan delta environment. Grey sandstone and mudstone overlie the oligomictic conglomerate (Fig. 4). Coal-bearing beds occur in the lower mudstone.
The Middle–Upper Jurassic strata are typically < 3000 m thick, but up to 4000 m thick along the front of the Daba Shan tectonic belt (Fig. 4). Conglomerates deposited in fluvial environments are found only at the base of the Upper Jurassic Lianhuakou Formation along the Longmen Shan thrust belt (Figs 4, 6). Middle–Upper Jurassic rocks along the front of the Micang Shan and Daba Shan tectonic belts consist of red mudstone, shale, quartzofeldspathic sandstone and siltstone, although no conglomerate was deposited in the Upper Jurassic strata. In our study area, the Middle–Upper Jurassic strata comprise mainly quartzofeldspathic sandstone, red siltstone and mudstone (Fig. 9). Fine-grained sediment indicates that the source was more distal than during the Early Jurassic Epoch.
The Lower Cretaceous strata are < 1000 m thick and are represented by the Jianmenguan and Cangxi formations, which constitute thick basal conglomerate, red coarse-grained sandstone and mudstone (Figs 4–8). The conglomerate occurs mainly at the base of the Jianmenguan Formation along the front of the Longmen Shan thrust belt. The matrix of the conglomerates is variable, and includes grains of dolomite, quartz, feldspar and chert. The clasts are mainly poorly sorted, gravel-sized subangular granite, dolomite and sandstone (Fig. 9). However, the sediments along the front of the Micang Shan and Daba Shan tectonic belts are slightly different to those in the west. Thin conglomerates are distributed sporadically along the front of Micang Shan and Daba Shan and, from Wanyuan to Dazhou, the Jianmenguan Formation is replaced by the Cangxi Formation, which conformably overlies the Penglaizhen Formation (Figs 3, 4). There is no conglomerate in the Cangxi Formation, which consists mainly of sandstone, siltstone and mudstone (Fig. 9f).
In summary, the Upper Jurassic – Lower Cretaceous conglomerates become finer and thinner-bedded from NW to SE, and transition into coarse sandstone along the front of the Daba Shan tectonic belt (Fig. 4).
3.b. Deformational structure along the northwestern margin of the Sichuan Basin
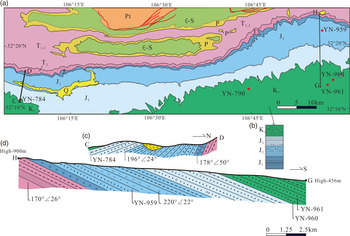
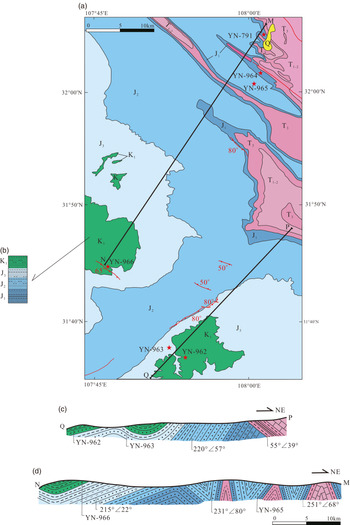
Figures 6–8 are enlarged geological maps of Figure 3, and six cross-sections are also shown. Each cross-section cuts through the central basin and into the adjacent Longmen Shan, Micang Shan and Daba Shan tectonic belts. In the western segment, the Cambrian – Upper Triassic strata in the Longmen Shan thrust belt are deformed. The folds are almost upright, and their limbs dip c. 45° (Figs 5c, 6d). Thrust faults developed imbricate structures, and transport older strata above the Triassic strata. To the SE, the Lower Jurassic – Lower Cretaceous strata within the Sichuan Basin are exposed in sequence; these strata dip gently to the SE (Fig. 6).
In the centre of the Micang Shan tectonic belt, deformation was characterized by formation of two map-scale anticlines (Figs 1c, 7), and a flexural belt developed at the margin of the Sichuan Basin. The Upper Triassic – Lower Cretaceous strata within the Sichuan Basin dip gently to the south and are mostly undeformed.
Geological map, stratigraphic column and cross-sections of the central part of the northwestern Sichuan Basin. (a) Geological map. (b) Lower Jurassic – Lower Cretaceous stratigraphy. (c)-(d) Cross-sections C–D and G–H. Legends as in Figure 3.

In the eastern segment, the Lower Triassic – Middle Jurassic strata within the Daba Shan tectonic belt were deformed by comb-like folds (Fig. 8). The Triassic strata are exposed at the top of the anticline and the Middle Jurassic strata are restricted to the syncline. Only the Middle Jurassic – Lower Cretaceous strata remain gently dipping, and are exposed from the NE to the SW of the study area.
Geological map, stratigraphic column and cross-sections of the eastern part of the northwestern Sichuan Basin. (a) Geological map. (b) Lower Jurassic – Lower Cretaceous stratigraphy. (c)-(d) Cross-sections P–Q and M–N. Legends as in Figure 3.

In summary, the Lower–Upper Jurassic strata dip to the SE along the LTB, to the south along the Micang Shan tectonic belt and to the SW along the Daba Shan tectonic belt (Figs 6–8). The Longmen Shan and Daba Shan thrust faults cut Triassic strata and dip to the NW and NE, revealing material that was eroded from the north of the Sichuan Basin.
4. Detrital zircon U–Pb dating and trace-element analysis
4.a. Sample collection
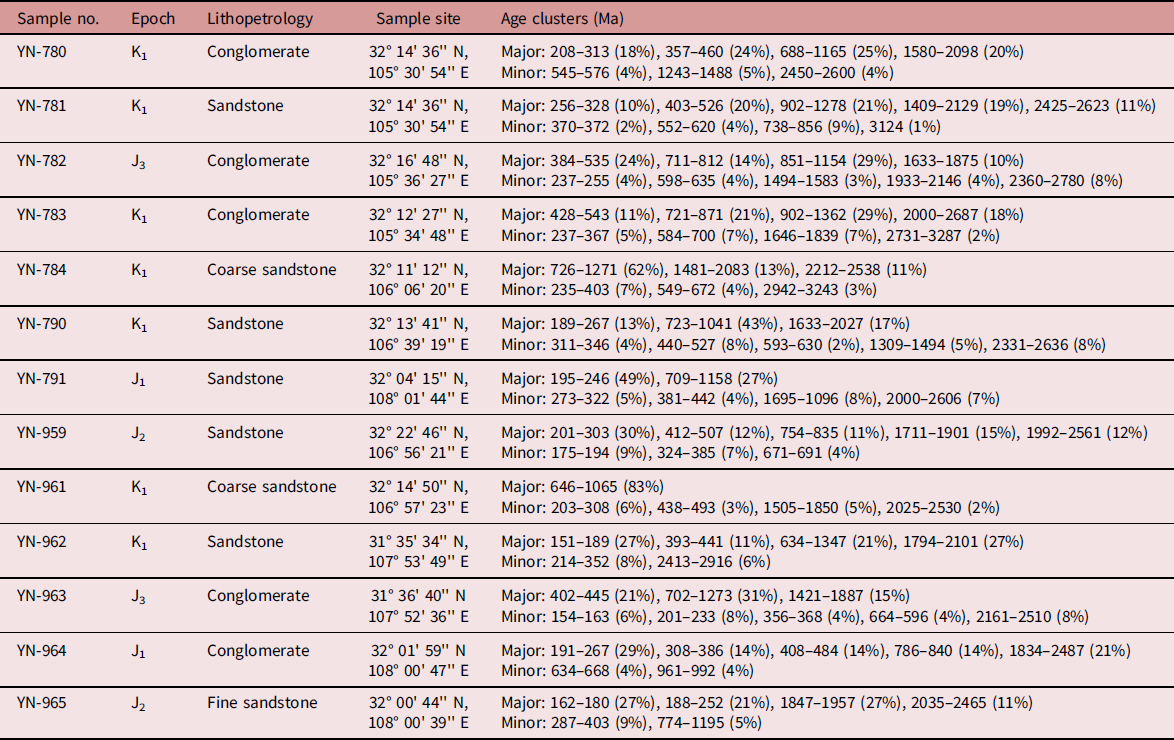
A total of 13 samples were collected from our study area (locations in Figs 4, 6–8). Detailed sample descriptions are listed in Table 1. Thin-sections of each sample were prepared to observe the composition and microstructure. Thirteen samples were selected for detrital zircon U–Pb dating and trace-element analysis. Samples YN-780, YN-781, YN-783, YN-784, YN-790 and YN-961 are from the Lower Cretaceous Jianmenguan Formation, YN-962 is from the Cangxi Formation, sample YN-782 is from the Upper Jurassic Lianhuakou Formation, YN-963 is from the Penglaizhen Formation, and YN-959 and YN-965 are from the Middle Jurassic strata. Samples YN-791 and YN-964 from the Lower Jurassic Baitianba Formation were also collected (Fig. 4).
Sample descriptions and detrital zircon U–Pb age data from the northwestern Sichuan Basin

4.b. Analytical methods
Zircon grains were separated from sandstones and conglomerates using conventional heavy-liquid and magnetic techniques, then hand-picked under a binocular microscope and mounted in epoxy resin. The epoxy mounts were polished to expose the zircon cores, then coated with gold prior to analysis. Transmitted and reflected light images were prepared and cathodoluminescence (CL) images were acquired on a CAMECA electron microprobe, revealing the internal structures and allowing us to select optimal sites for U–Pb dating and trace-element analyses.
Zircon U–Pb dating was carried out using a laser ablation ion-coupled plasma mass spectrometer (LA-ICP-MS) at Beijing Createch Testing Technology Co. Ltd, Beijing, China. Detailed operating conditions and data reduction procedures are provided by Hou et al. (Reference Hou, Li and Tian2009). Laser sampling was performed using an ESI NWR 193 nm laser ablation system coupled to an AnlyitikJena Plasma Quant MS Elite ICP-MS. The laser spot size was 25 μm in diameter, the shot frequency was 8 Hz and the energy density was 2.01 J cm–2. GJ-1 zircon was used as the external standard for U–Pb dating. Trace-element contents were calculated using NIST 610 as the external standard and Si as the internal standard (Liu et al. Reference Liu, Gao, Hu, Gao, Zong and Wang2010). During the analyses, GJ-1 zircon samples were measured twice before and after every 6–15 analyses to correct for instrument drift, and Plešovice zircon was measured once to assess the quality of the analyses. Each analysis incorporated c. 15–20 s of background (gas blank) acquisition followed by 45 s of data acquisition. Off-line data selection, integration of background and analyte signals, time-drift corrections and quantitative calibration for U–Pb dating was performed by ICPMSDataCal (Liu et al. Reference Liu, Gao, Hu, Gao, Zong and Wang2010).
The data were processed using Isoplot 4.13 (Ludwig, Reference Ludwig2011). Ages younger than 1000 Ma were calculated using 206Pb/238U ratios, and ages older than 1000 Ma were calculated using 207Pb/206Pb ratios (Sircombe, Reference Sircombe1999; Cawood & Nemchin, Reference Cawood and Nemchin2000; He et al. Reference He, Klemd, Zhang, Zong, Sun, Tian and Huang2015).
4.c. Analytical results
In total, 1125 zircon grains from 13 samples were analysed (Table 1); detailed U–Th–Pb data are listed in online Supplementary Tables S1–S13 (available at http://journals.cambridge.org/geo).
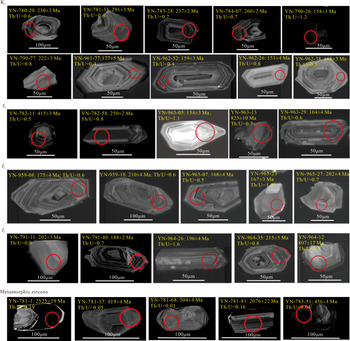
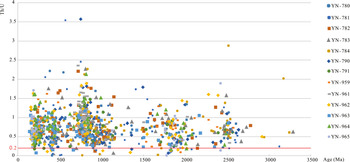
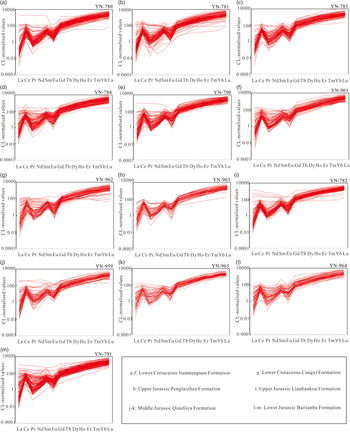
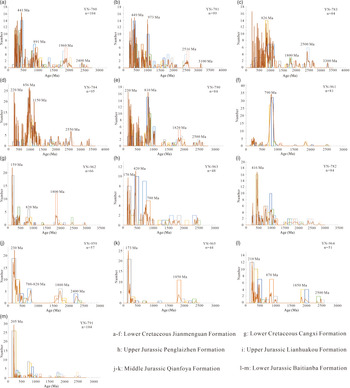
Representative CL images and corresponding ages are shown in Figure 10, and all CL images are shown in the online supplementary material. The zircon grains are 80–180 μm in length and euhedral or subhedral, with well-developed oscillatory zoning demonstrating their magmatic origin (Hoskin & Schaltegger, Reference Hoskin and Schaltegger2003; Fig. 10). The zircons mostly have Th/U ratios of 0.2–1.5, with only 15 grains (1.5%) yielding ratios of < 0.1 (Fig. 11). Generally, the Th/U ratio of igneous zircon is ≥ 0.5, but some less common igneous rocks contain zircons with Th/U ratios of c. 0.2–1.0 (Hoskin & Schaltegger, Reference Hoskin and Schaltegger2003); Th/U ratios of > 0.1 in these samples therefore suggests an igneous provenance. The chondrite-normalized rare earth element (REE) patterns of the zircon are plotted in Figure 12. The zircons are depleted in light REEs (LREEs) and enriched in heavy REEs (HREEs). The HREEs slope more steeply than the LREEs, and the zircons have positive Ce and negative Eu anomalies, indicating that most zircon grains are igneous in origin (Hoskin & Ireland, Reference Hoskin and Ireland2000; Hoskin & Schaltegger, Reference Hoskin and Schaltegger2003). Detrital zircon U–Pb age probability plots for each sample are shown in Figure 13. The main age clusters are: 2600–2200, 1850–1600, 850–720, 540–400, 250–180 and 180–140 Ma.
Photomicrographs of conglomerates and sandstones. (a) Conglomerate from the Lower Jurassic Baitianba Formation, collected near the Longmen Shan thrust belt. (b) Lower Jurassic sandstone from the front of the Longmen Shan thrust belt. (c) Lower Jurassic sandstone from the front of the Daba Shan tectonic belt. (d) Middle Jurassic sandstone from the front of the Micang Shan tectonic belt. The composition is variable and similar to sample YN-964. (e) Sample YN-782 of an Upper Jurassic conglomerate. (f) Fine-grained sample from the Lower Cretaceous Cangxi Formation at the front of the Daba Shan tectonic belt. (g–i) Samples from Lower Cretaceous strata: (g) YN-780, (h) YN-784 and (i) YN-783. Qz – quartz; Mus – muscovite; Fsp – feldspar; Cal – calcite.

Cathodoluminescence images of representative concordant detrital zircon. Red circles indicate the location of U–Pb age analyses. Sample names, analysis numbers and the calculated ages are also shown.

Th/U ratios versus U–Pb ages of the concordant detrital zircon grains from all analytical samples.

Chondrite-normalized REE patterns of zircon grains from all analytical samples.

Probability density diagram of detrital zircon ages for the Lower Jurassic – Lower Cretaceous strata. Data are from this study.

4.c.1. Lower Cretaceous Jianmenguan Formation
A total of 108 zircon grains from YN-780 were analysed for their U–Pb isotopic compositions, and 104 yielded reliable results (Table 1; Fig. 13a). There are four major age populations, 2098–1580 Ma (20%), 1165–688 Ma (25%), 460–357 Ma (24%) and 313–208 Ma (18%), and three minor clusters, 2606–2450 Ma (4%), 1488–1243 Ma (5%) and 576–545 Ma (4%). All the zircon grains have oscillatory zoning and high Th/U ratios (>> 0.2), suggesting a magmatic provenance.
The 102 zircon grains from YN-781 were analysed for their U–Pb isotopic compositions, and 99 yielded reliable results (Table 1; Fig. 13b). The major age clusters are 2623–2425 Ma (11%), 2129–1409 Ma (19%), 1278–902 Ma (21%), 526–403 Ma (20%) and 328–256 Ma (10%). The minor clusters are 3124 Ma (1%), 856–738 Ma (9%), 620–552 Ma (4%) and 372–370 Ma (2%). Three zircon grains have relatively low Th/U ratios (0.1–0.2) and bright overgrowth rims, which suggest they experienced Pb loss or formed during a metamorphic event. Three more grains have Th/U ratios of < 0.1, suggesting a metamorphic origin (Fig. 10). The remaining zircons have high Th/U ratios and oscillatory zoning, implying a magmatic origin (Fig. 10).
A total of 88 zircon grains from YN-783 were analysed for their U–Pb isotopic compositions, and 84 yielded reliable results (Table 1; Fig. 13c). There are four major age clusters, 2687–2000 Ma (18%), 1362–902 Ma (29%), 871–721 Ma (21%) and 543–428 Ma (11%), and four minor clusters, 3287–2731 Ma (2%), 1839–1646 Ma (7%), 700–584 Ma (7%) and 367–237 Ma (5%). Only two grains have Th/U ratios of < 0.1, which would suggest a metamorphic origin, and CL images of two more with Th/U ratios of 0.1–0.2 suggest they experienced Pb loss or formed during a metamorphic event. The remaining grains have high Th/U ratio and magmatic oscillatory zoning.
Of the 96 zircon grains analysed from YN-784, only one was excluded (Table 1; Fig. 13d). The remaining grains yielded three major age populations, 2538–2212 Ma (11%), 2083–1481 Ma (13%) and 1271–726 Ma (62%), and three minor age populations, 3243–2942 Ma (3%), 672–549 Ma (4%) and 403–235 Ma (7%). Only three grains have low Th/U ratios (0.026, 0.043 and 0.014), suggesting a metamorphic origin. The remaining grains have high Th/U ratios and magmatic oscillatory zoning.
Of the 91 zircon grains analysed from YN-790, 84 yielded reliable results (Table 1; Fig. 13e). There are three major age populations, 2027–1633 Ma (17%), 1041–723 Ma (42%) and 267–189 Ma (13%), and five minor age populations, 2636–2331 Ma (8%), 1494–1309 Ma (5%), 630–593 Ma (2%), 527–440 Ma (8%) and 346–311 Ma (4%). In addition, there is one zircon grain with an age of 158 ± 1.2 Ma, a Th/U ratio of 1.2 and magmatic oscillatory zoning. Only one zircon has a low Th/U ratio (0.07) and is interpreted to be metamorphic; the others have ratios of >> 0.2 and are interpreted to be magmatic.
Of the 85 zircon grains analysed from YN-961, 81 yielded reliable results (Table 1; Fig. 13f). Age clusters around 2503–2025 Ma (2%), 1850–1505 Ma (5%), 1065–646 Ma (83%), 493–438 Ma (3%) and 308–203 Ma (6%) were obtained. In addition, there is one zircon grain with an age of 176 ± 5 Ma. All of the grains have high Th/U ratios and oscillatory zoning, and are most likely magmatic in origin.
4.c.2. Lower Cretaceous Cangxi Formation
Of the 69 zircon grains selected from sample YN-962 for analysis, 66 yielded reliable results (Table 1; Fig. 13g). Several age clusters around 2916–2413 Ma (6%), 2101–1794 Ma (27%), 1347–634 Ma (21%), 441–393 Ma (11%), 352–214 Ma (8%) and 189–151 Ma (27%) were determined. Only one zircon has a low Th/U ratio (0.09) and a metamorphic origin; the others have high Th/U ratios and are interpreted to be magmatic in origin.
4.c.3. Upper Jurassic Penglaizhen Formation
Of the 55 zircon grains selected from YN-963 for analysis, 48 yielded reliable results (Table 1; Fig. 13h). They yielded several age clusters, namely: 2510–2161 Ma (8%), 1887–1421 Ma (15%), 1273–702 Ma (31%), 664–596 Ma (4%), 445–402 Ma (21%), 368–356 Ma (4%), 233–201 Ma (8%) and 163–154 Ma (6%). Only one zircon with a Th/U ratio of 0.07 is interpreted to have a metamorphic origin; the others have a magmatic origin.
4.c.4. Upper Jurassic Lianhuakou Formation
Of the 90 zircon grains selected from sample YN-782 for analysis, 84 yielded reliable results (Table 1; Fig. 13i). They have several age clusters, namely: 2780–2360 Ma (8%), 2146–1933 Ma (4%), 1875–1633 Ma (10%), 1583–1494 Ma (3%), 1154–851 Ma (29%), 812–711 Ma (14%), 635–598 Ma (4%), 535–384 Ma (24%) and 255–237 Ma (4%). Only one zircon with a Th/U ratio of 0.13 may have undergone metamorphism; the others have high Th/U ratios and magmatic origins, as also shown by CL images.
4.c.5. Middle Jurassic Qianfoya Formation
Of the 67 zircon grains selected from YN-959 for analysis, 57 yielded reliable results (Table 1; Fig. 13j). They yielded several age clusters, namely: 2561–1992 Ma (12%), 1901–1711 Ma (15%), 835–754 Ma (11%), 691–671 Ma (4%), 507–412 Ma (12%), 385–324 Ma (7%), 303–201 Ma (30%) and 194–175 Ma (9%). All the zircon grains have high Th/U ratios and are interpreted as having a magmatic origin.
Of the 47 zircon grains analysed from YN-965, 44 yielded reliable results (Table 1; Fig. 13k). They yielded several age clusters, namely: 2465–2035 Ma (11%), 1957–1847 Ma (27%), 1195–774 Ma (5%), 403–287 Ma (9%), 252–188 Ma (21%) and 180–162 Ma (27%). Only one zircon grain with a Th/U ratio of 0.011 may have a metamorphic origin; the others have high Th/U ratios and oscillatory zoning, suggesting a magmatic origin.
4.c.6. Lower Jurassic Baitianba Formation
Of the 56 zircon grains selected from YN-964 for analysis, 51 yielded reliable results (Table 1; Fig. 13l). They yield several age clusters, namely: 2487–1834 Ma (21%), 992–961 Ma (4%), 840–786 Ma (14%), 668–634 Ma (4%), 484–404 Ma (14%), 386–303 Ma (14%) and 267–191 Ma (29%). All have high Th/U ratios and clear oscillatory zoning, and are interpreted as having a magmatic origin.
Of the 108 zircon grains selected from YN–791 for analysis, 104 yielded reliable results (Table 1; Fig. 13m). They yield several age clusters, namely: 2606–2000 Ma (7%), 1906–1695 Ma (8%), 1158–709 Ma (27%), 442–381 Ma (4%), 322–273 Ma (5%) and 246–195 Ma (49%). All have high Th/U ratios and are interpreted as having a magmatic origin.
5. Discussion
5.a. Sediment sources for the northwestern Sichuan Basin
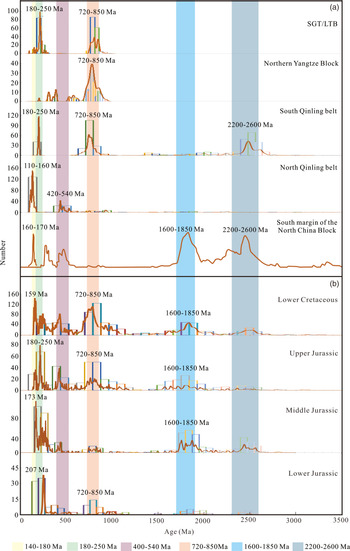
According to the tectonic framework presented in this study and palaeocurrent data from Cui et al. (Reference Cui, Long and Li1991) and Li et al. Reference Li, He, Li, Wen, Mei, Li and Sun(2016 b), the northwestern Sichuan Basin sediments might have been derived from the north and NW during the Early Jurassic – Early Cretaceous epochs. Our detrital zircon ages show more details of the provenance. They have mainly magmatic sources and yielded several age clusters: 2600–2200, 1850–1600, 850–720, 540–400, 250–180 and 180–140 Ma (Figs 13, 14). In order to compare the detrital zircon ages with those of surrounding areas, we also compiled magmatic zircon data from several adjacent areas, including the Yangtze Block, south Qinling belt, north Qinling belt and North China Block (Fig. 14a).
Probability density diagram of detrital zircon U–Pb ages for Lower Jurassic – Lower Cretaceous strata compared with age clusters from potential source regions. (a) Potential source regions. North Qinling belt data are from Mao et al. (Reference Mao, Xie, Pirajno, Ye, Wang, Li, Xiang and Zhao2010) and Dong et al. (Reference Dong, Genser, Neubauer, Zhang, Liu, Yang and Heberer2011 a); south Qinling belt data are from Zhu et al. (Reference Zhu, Chen, Wang, Pham, Wang and Zhang2008, Reference Zhu, Zhang, Chen, Ding, Guo, Wang and Lee2011) and Hu et al. (Reference Hu, Liu, Chen, Qu, Li and Geng2013); northern Yangtze Block data are from Ling et al. (Reference Ling, Gao, Cheng, Jiang, Yuan and Hu2006); SGT/LTB data are from Roger et al. (Reference Roger, Malavieille, Leloup, Calassou and Xu2004), Weislogel (Reference Weislogel2008), Yan et al. (Reference Yan, Zhou, Wei, Gao, Liu, Xu and Shi2008 a), Yuan et al. (Reference Yuan, Zhou, Sun, Zhao, Wilde, Long and Yan2010) and Meng et al. (Reference Meng, Liu, Du, Liu and Liu2015); southern North China Block data are from Li et al. Reference Li, He, Li, Wen, Mei, Li and Sun(2016 b). (b) Lower Jurassic – Lower Cretaceous strata from the northwestern Sichuan Basin. These data were taken from Luo et al. (Reference Luo, Qi, Zhang, Wang and Han2014), Li et al. Reference Li, He, Li, Wen, Mei, Li and Sun(2016 b), Li et al. (Reference Li, He, Li, Lu, Fan, Sun and Huang2018) and this study.

The Precambrian age clusters are mainly related to the basement of the Yangtze and North China blocks. The age and distribution of the surrounding igneous rocks and crystalline basement are shown in Figures 1 and 2.
The 2800–1600 Ma migmatites have two distinct age populations: 2.6–2.2 Ga and 1.85–1.6 Ga (Fig. 14a). They are exposed in the south Qinling belt and along the southern margin of the North China Block (Zhang et al. Reference Zhang, Zhang, Fu, Tang and Song1996, Reference Zhang, Xu, Song, Wang, Chen and Li2010; He et al. Reference He, Liu, Wei, Xiao, Ma and Wu1997; Wang, Reference Wang1997; Hu et al. Reference Hu, Liu, Chen, Qu, Li and Geng2013). These crystalline basement rocks could have supplied material to the northwestern Sichuan Basin. There are two Neoproterozoic age clusters: a large cluster at 850–720 Ma and a minor cluster at 1.1–0.9 Ga (Fig. 14a). In the northern Yangtze Block, 850–720 Ma magmatic rocks are mainly exposed in the Hannan massif (Ling et al. Reference Ling, Gao, Cheng, Jiang, Yuan and Hu2006; Zhao et al. Reference Zhao, Zhou and Zheng2010; Fig. 2) and Huangling anticline (Ling et al. Reference Ling, Gao, Cheng, Jiang, Yuan and Hu2006; Fig. 2). Across the SGT and LTB, numerous 850–720 Ma igneous rocks are exposed (Yan et al. Reference Yan, Wang, Hanson, Druschke, Yan, Liu, Jian, Song, Wang and Jiang2003, Reference Yan, Zhou, Wei, Gao, Liu, Xu and Shi2008 a; Meng et al. Reference Meng, Liu, Du, Liu and Liu2015; Figs 2, 14a). In addition, the few 700–600 Ma zircon grains in our samples may have been supplied by the Yaolinghe Group (Li et al. Reference Li, Lu, Chen, Xiang, Zhou and Hao2003; Ling et al. Reference Ling, Ren, Duan, Liu, Mao, Peng, Liu, Cheng and Yang2008; Zhang et al. Reference Zhang, Zhang, Li and Lu2013; Fig. 2), which is found mainly in the south Qinling belt (Fig. 2).
Magmatic rocks of age 540–400 Ma are exposed predominantly in the north Qinling belt (Yan et al. Reference Yan, Chen, Wang, Yan, Wang, Li, Zhang and Jiang2008 b; Figs 2, 14a). Large volumes of 250–180 Ma intrusive rocks are distributed around the northwestern Sichuan Basin, including in the Songpan–Garzê terrane (Roger et al. Reference Roger, Malavieille, Leloup, Calassou and Xu2004; Weislogel, Reference Weislogel2008; Yuan et al. Reference Yuan, Zhou, Sun, Zhao, Wilde, Long and Yan2010), the Qinling orogenic belt (Zhang et al. Reference Zhang, Liu, Li, Wang, Han, Yang and Wu2009; Jiang et al. Reference Jiang, Jin, Liao, Zhou and Zhao2010; Zhu et al. Reference Zhu, Zhang, Chen, Ding, Guo, Wang and Lee2011) and the Longmen Shan thrust belt (Lv et al. Reference Lv, Yan, Wang, Gao and Qi2010), but none occur within the Yangtze Block (Figs 2, 14a). These igneous rocks were emplaced as syn- and post-orogenic responses to the extensive Late Triassic deformation caused by the collision of the North China and the Yangtze blocks (Zhang et al. Reference Zhang, Liu, Li, Wang, Han, Yang and Wu2009; Jiang et al. Reference Jiang, Jin, Liao, Zhou and Zhao2010; Zhu et al. Reference Zhu, Zhang, Chen, Ding, Guo, Wang and Lee2011).
Geological mapping shows that Late Jurassic – Early Cretaceous magmatic rocks are only exposed in the north Qinling belt, with ages of mainly 158–100 Ma (Mao et al. Reference Mao, Xie, Pirajno, Ye, Wang, Li, Xiang and Zhao2010; Dong et al. Reference Dong, Zhang, Neubauer, Liu, Genser and Hauzenberger2011 b, Reference Dong, Yang, Liu, Sun, Li, Cheng, Zhang, Zhang, He and Zhang2016; Fig. 14a); this age is slightly younger than the 180–150 Ma cluster obtained in this paper. Dong et al. (Reference Dong, Yang, Liu, Sun, Li, Cheng, Zhang, Zhang, He and Zhang2016) suggested that these magmatic rocks were mainly generated by N–S-aligned compressional intracontinental deformation along the old boundary between the North China and the Yangtze blocks.
5.a.1. Sediment sources during the Early Jurassic Epoch
A total of 155 detrital zircon grains were analysed from YN-791 and YN-964 from the Lower Jurassic Baitianba Formation, located in front of the Daba Shan tectonic belt. The 250–180 Ma age cluster with a peak age of 207 Ma is the most significant (Fig. 14b). The south Qinling belt, SGT/LTB and southern margin of the North China Block have the 250–180 Ma age cluster and likely contributed sediments to the northwestern Sichuan Basin (Fig. 14). The second-largest age cluster of detrital zircons is 850–720 Ma, which is significant in the northern Yangtze Block and south Qinling belt (Fig. 14). A small number of 540–400 Ma detrital zircons may have come from the north Qinling belt. Based on these data, the source regions of the Lower Jurassic sedimentary rocks were the south Qinling belt, the SGT/LTB, the northern Yangtze Block and the north Qinling belt (Figs 1, 2). This is also consistent with the palaeocurrent data.
5.a.2. Sediment sources during the Middle Jurassic Epoch
Samples YN-959 and YN-965 are from Middle Jurassic strata along the front of the Micang Shan and Daba Shan tectonic belts, respectively (Fig. 8). The data for these two samples and those from Luo et al. (Reference Luo, Qi, Zhang, Wang and Han2014) and Li et al. (Reference Li, He, Li, Lu, Fan, Sun and Huang2018) reveal a large number of 250–160 Ma zircon grains, which indicates that the south Qinling belt and SGT/LTB were likely the main sources (Fig. 14). In addition, the 1.85–1.6 and 2.6–2.2 Ga zircons are similar to the age clusters along the southern margin of North China Block (Fig. 14). We therefore suggest that the material was derived mainly from the south Qinling belt and SGT/LTB, with a contribution from the southern margin of the North China Block.
5.a.3. Sediment sources during the Late Jurassic – Early Cretaceous epochs
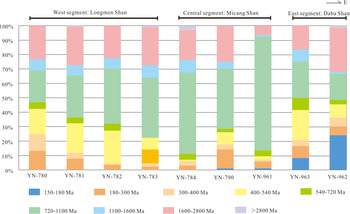
The detrital zircons from the Late Jurassic and Early Cretaceous samples have similar age clusters including 2500, 1850–1600, 850–720, 420 and 250–140 Ma (Fig. 14). There are differences in the age distributions from west to east (Fig. 15). In the front of the Micang Shan tectonic belt, the main age cluster is 1100–720 Ma and there are relatively few 250–180 Ma zircon grains (Fig. 15). This may indicate that the sediment at the front of the Micang Shan tectonic belt was derived mainly from the northern Yangtze Block. The Daba Shan tectonic belt has a more complex distribution of ages, and most of the 180–140 Ma detrital zircons are found along the belt (Fig. 15), suggesting that the south and north Qinling belts were its main sediment sources. Along the LTB, there is no 180–140 Ma age cluster, and the largest clusters are at 1100–720 and 500–400 Ma (Fig. 15).
Histogram of the percentages of each age cluster from the Upper Jurassic – Lower Cretaceous samples dated in this study, which are displayed from west to east.

Apart from these main clusters, there are also some 300–250 Ma magmatic zircons in our samples, especially in YN-780 and YN-781, which are adjacent to the Longmen Shan thrust belt. Analysis of the provenance of the Songpan–Garzê terrane shows a 280–250 Ma population of magmatic zircon in Upper Triassic turbidites (Weislogel et al. Reference Weislogel, Graham, Chang, Wooden, Gherels and Yang2006). We speculate that the 300–250 Ma detrital zircons in the northwestern Sichuan Basin were partly derived from recycled zircon in the Songpan–Garzê terrane. This is also supported by the decrease from west to east in the number of 300–250 Ma zircon grains. Combining the detrital zircon data, the distribution of conglomerates, the structures surrounding the northwestern Sichuan Basin and the palaeocurrent directions (Cui et al. Reference Cui, Long and Li1991; Li et al. Reference Li, He, Li, Wen, Mei, Li and Sun2016 b), we propose that the sediments along the front of the Longmen Shan, Micang Shan and Daba Shan tectonic belts were derived from the SGT/LTB and northern Yangtze Block, Yangtze Block, and north and south Qinling belts, respectively.
5.b. Evolution of the northwestern Sichuan Basin
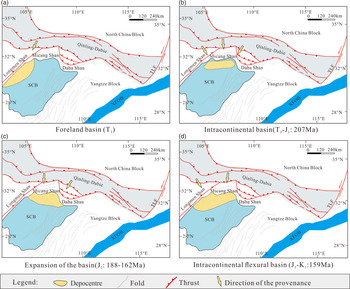
The Late Triassic sedimentary sequence in the northwestern Sichuan Basin is wedge-shaped (Meng et al. Reference Meng, Wang and Hu2005), and it has been interpreted as a foreland basin in front of LTB (Meng et al. Reference Meng, Wang and Hu2005; Chen et al. Reference Chen, Xu, Wang, Wang, Zeng, Wang and Li2008; Luo et al. Reference Luo, Qi, Zhang, Wang and Han2014). The depocentre of the basin was located in front of the LTB during the Late Triassic Epoch (Fig. 16a). Many changes have taken place since the Early Jurassic Epoch. The conglomerate at the base of the Lower Jurassic strata unconformably overlies the Upper Triassic Xujiahe Formation, and its clasts consist mainly of quartz sandstone. The depocentre moved to the central part of the northwestern Sichuan Basin, and the deposits were no longer wedge-shaped (Fig. 16b). The evidence indicates that the northwestern Sichuan Basin had transformed from a foreland setting into an intracontinental setting by the Early Jurassic Epoch. The thickness of Middle Jurassic sediments within the northwestern Sichuan Basin is > 2000 m, especially along the Daba Shan tectonic belt. The Middle Jurassic was a period of rapid subsidence, and the depocentre was located along the Micang Shan and Daba Shan tectonic belts. The transition of sedimentary facies from braided river to lacustrine systems implies the expansion of the basin (Meng et al. Reference Meng, Wang and Hu2005; Fig. 16c).
Schematic maps showing the evolution of the Sichuan Basin through time, with the main structures, terranes, basin depocentres and palaeocurrents. Abbreviations as for Figure 1. (a) The Late Triassic collision between the North China and Yangtze blocks resulted in the formation of a foreland basin in front of the Longmen Shan thrust belt. The sediment supplied to the foreland basin was derived from the Qinling orogenic belt. (b) During the Early Jurassic Epoch, the mountains surrounding the northwestern Sichuan Basin were relatively undeformed, and supplied sediment to the northwestern Sichuan Basin from the NW, north and NE. (c) During the Middle Jurassic Epoch, the load of the surrounding mountains led to thick sedimentation in the northwestern Sichuan Basin, especially in front of the Daba Shan tectonic belt. The depocentre was in the front of Daba Shan tectonic belt and the sediment was supplied mainly from the north and NE. (d) During the Late Jurassic – Early Cretaceous epochs, the mountains surrounding the northwestern Sichuan Basin deformed and uplifted during an intracontinental orogeny, which shifted the depocentre to the corner of the Longmen Shan and Micang Shan tectonic belts. The sediment in the northwestern Sichuan Basin was derived mainly from the north and NW.

During the Late Jurassic – Early Cretaceous epochs, thick conglomerate sequences were deposited in the NW, thinning to the SE, which indicates rapid deposition in the northwestern corner of the northwestern Sichuan Basin (Fig. 16d). The multiple provenance regions of the sandstone indicate a nearby source and transportation from the adjacent tectonic belts. The northwestern Sichuan Basin was an intracontinental flexural basin fed by the adjacent Longmen Shan, Micang Shan and Daba Shan tectonic belts during this time.
5.c. Constraints on the timing of deformation of the northwestern Sichuan Basin and surrounding areas
The absence of Jurassic–Cretaceous strata within the orogens hampered the investigation of the late Mesozoic deformation of the Longmen Shan, Micang Shan and Daba Shan tectonic belts; however, the Jurassic–Cretaceous strata within the Sichuan Basin can provide important information about the deformation of the surrounding areas.
The northwestern Sichuan Basin transformed from a syn-orogenic peripheral foreland basin to an intracontinental basin during the Early Jurassic Epoch. Accompanying this change, the surrounding orogenic belt also transformed into an intracontinental setting. The age distribution of zircon in samples YN-791 and YN-964 show a distinct peak at 207 Ma, within a large cluster at 220–190 Ma (Fig. 14b). This age peak suggests that the transition in tectonic setting occurred after 207 Ma.
Samples YN-965 and YN-959 are the sandstone from the Middle Jurassic Epoch, a period of expansion for the Sichuan Basin. They have major clusters of ages at 180–160 and 194–175 Ma, respectively. Combining our data with those for the samples from Luo et al. (Reference Luo, Qi, Zhang, Wang and Han2014) and Li et al. (Reference Li, He, Li, Lu, Fan, Sun and Huang2018), there is a distinct age peak for the three samples at 173 Ma, with a large cluster of ages at 186–162 Ma (Fig. 14). AFT data also shows a rapid reheating at 188–165 Ma (Xu et al. Reference Xu, Zhou, Chang and Guillot2010), which is consistent with our data. This constrains the timing of the expansion of the Sichuan Basin to 186–162 Ma.
The presence of an intracontinental flexural basin caused by the load of the Longmen Shan, Micang Shan and Daba Shan tectonic belts indicates an intracontinental orogeny in the surrounding orogenic belts during the Late Jurassic – Early Cretaceous epochs. Combining all of the Early Cretaceous samples, including the samples from this paper and three samples from Li et al. Reference Li, He, Li, Wen, Mei, Li and Sun(2016 b), yields a large cluster of ages at 175–147 Ma, with a peak at 159 Ma (Fig. 14). These data constrain intracontinental deformation to be no earlier than c. 159 Ma.
5.d. Intracontinental shortening and uplift corresponding to deposition in the northwestern Sichuan Basin
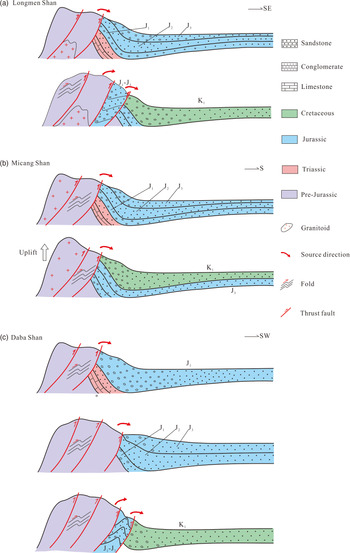
With transformation of the Sichuan Basin from a foreland to an intracontinental setting, the surrounding orogenic belts also underwent intracontinental deformation beginning during the Early Jurassic Epoch. Dating using AFT shows regional uplift along the Micang Shan and Daba Shan tectonic belts at 135–100 Ma (Shen et al. Reference Shen, Mei, Xu, Tang and Tian2007 b, 2009; Li et al. Reference Li, Zhang, Dong and Li2010; Tian et al. Reference Tian, Zhu, Xu, Rao, Kohn and Hu2010, Reference Tian, Kohn, Zhu, Xu, Hu and Gleadow2012 a, b; Xu et al. Reference Xu, Zhou, Chang and Guillot2010; Shi et al. Reference Shi, Zhang, Dong, Hu, Wiesinger, Ratschbacher, Jonckheere, Li, Tian, Chen, Wu, Ma and Li2012; Yang et al. Reference Yang, Ratschbacher, Jonckheere, Enkelmann, Dong, Shen, Wiesinger and Zhang2013); however, AFT dating can only record the thermal history below the closure temperature and earlier uplift cannot be confirmed. The Lower Cretaceous sediment in the central segment was supplied by the Yangtze basement, which indicates that the Micang Shan tectonic belt had uplifted, preventing the transport of sediment from the Qinling orogenic belt (Fig. 17b). Our data shows that intracontinental shortening occurred after 159 Ma, and we suggest that the uplift of the Micang Shan tectonic belt was accompanied by N–S-aligned intracontinental shortening. Low-temperature thermochronology, sedimentology and deformational structures show that the uplift and shortening of the Daba Shan tectonic belt occurred simultaneously with that of the Micang Shan tectonic belt (Fig. 17c).
Schematic diagram of the evolution of an orogen–basin system. (a) The Longmen Shan thrust belt was relatively undeformed during the Jurassic Period. Beginning during the Early Cretaceous Epoch, the intracontinental orogeny progressed E-wards, involving the Jurassic strata within the northwestern Sichuan Basin in the deformation and supplying material to the Lower Cretaceous deposits. (b) The Micang Shan tectonic belt was relatively undeformed during the Jurassic Period. Uplift began during the Early Cretaceous Epoch; however, sedimentation within the northwestern Sichuan Basin was continuous. The intracontinental deformation in front of the Micang Shan tectonic belt was slight. (c) The Daba Shan tectonic belt was relatively quiescent during the Early Jurassic Epoch. During the Middle Jurassic Epoch, the heavy load resulted in thick sedimentary deposits. Until the Early Cretaceous Epoch, the Jurassic strata were involved in the intracontinental orogeny and supplied material to the Lower Cretaceous deposits.

The Lower Jurassic and Lower Cretaceous conglomerates within the Sichuan Basin, as well as the structures along the Longmen Shan thrust belt, record intracontinental orogeny and uplift (Fig. 17a). Given that much of the detrital zircon in the Early Cretaceous samples along the Longmen Shan tectonic belt could be transported from the Songpan–Garzê terrane and the south Qinling belt, we suggest that significant uplift of the Longmen Shan tectonic belt did not occur during the Middle–Early Jurassic epochs.
Early Jurassic – Early Cretaceous intracontinental shortening in the Longmen Shan, Micang Shan and Daba Shan tectonic belts developed simultaneously under the same N–S-aligned compressional stress field, although the trends of the three belts are different. The strike-slip faults within LTB can accommodate N–S-aligned compression in the NE-striking LTB, and the arcuate Daba Shan tectonic belt was affected by the obstruction of the rigid Yangtze basement (Figs 2, 16). The sedimentary and structural characteristics suggest that the intensity of deformation along the Longmen Shan, Micang Shan and Daba Shan tectonic belts was different. The Micang Shan tectonic belt was only slightly deformed because the Yangtze basement (such as the Hannan massif) formed a barrier. The Daba Shan tectonic belt was relatively active during the Late Jurassic Epoch, and the Longmen Shan tectonic belt became relatively active during the Late Jurassic – Early Cretaceous epochs.
6. Conclusions
The U–Pb ages of detrital zircon yield several clusters at 2600–2200, 1850–1600, 850–720, 540–400, 250–180 and 180–140 Ma. The distribution of conglomerate, deformational structures, detrital zircon ages and palaeocurrent directions suggest that the sediments in the northwestern Sichuan Basin were derived from the NW, north and NE, including the northern Yangtze Block, the SGT/LTB, the southern margin of the North China Block, and the north and south Qinling belts. The youngest U–Pb age clusters constrain the tectonic events during the Mesozoic Era. The tectonic setting changed from a continental margin to an intracontinental setting after 207 Ma. Rapid deposition occurred within the northwestern Sichuan Basin at 186–162 Ma, and intracontinental compression along the Longmen Shan, Micang Shan and Daba Shan tectonic belts began after 159 Ma. The sedimentary characteristics within the northwestern Sichuan Basin and the deformation within the surrounding orogens indicate that the deformation and basin formation were caused by N–S-aligned intracontinental compression rather than the continued collision between the North China and Yangtze blocks.
Acknowledgements
We greatly appreciate the constructive comments and suggestions from the editor Olivier Lacombe, reviewer Renata Schmitt and an anonymous reviewer. This work was supported by a National Nature Science Foundation Grant of China to Qian Tao (grant no. 41702238), National Science Foundation grant to Dengfa He (grant no. 41430316) and the State Key Laboratory Programs of the China University of Geosciences, Beijing.
Supplementary material
To view supplementary material for this article, please visit https://doi.org/10.1017/S001675682100011X