I. INTRODUCTION
The component analysis of atmospheric aerosol such as suspended particle matters (SPM) is important for the estimation of the hazardous pollutant source, as well as for the evaluation of the influence on human health and climate change on a global scale. The inorganic component of aerosol collected on filters can be analyzed easily and non-destructively using XRF. The XRF method is effective when a large number of filter samples need to be analyzed rapidly, such as for the trend analysis. Especially EDXRF has attracted attention because of handling of the samples and compact size compared to wavelength dispersive X-ray fluorescence (WDXRF), and has been often used (Okuda et al., Reference Okuda, Takada, Kumata, Nakajima, Hatakeyama, Uchida, Tanaka, He and Ma2013).
The EDXRF spectrometer equipped with secondary targets and polarized optics used in this study has advantages of high peak-to-background (PB) ratio and lower limit of detection (LLD) compared to EDXRF spectrometers with conventional direct excitation. This spectrometer also has the advantage of reduced sample damage because of small amount of X-ray radiation.
The quantification software is based on the semi-quantitative analysis method. This software uses full-profile fitting of measured spectra combining the thin-film FP method with the iteration procedure. Since this method utilizes the peak profiles of each element which are calculated theoretically in the fitting process, accurate quantitative results can be obtained even if there are overlapping peaks. Even if bulk samples are used as standards, it can be applied to the analysis of thin film such as filter samples using the fitting process with the combination of thin-film FP method.
In the experiment, accurate quantitative results for the standard aerosol filters with this method were obtained. In this paper, polarized optics EDXRF, thin-film FP calculation, and profiling fitting procedure and the analysis results are described.
II. INSTRUMENT
The Rigaku EDXRF spectrometer “NEX CG” with polarized optics was used. It has an air-cooled end-window 50 W X-ray tube with Pd target and polarized optics with up to five secondary targets for high PB ratio (Moriyama et al., Reference Moriyama, Ikeda, Doi and Fess2011). The detector is a silicon drift detector. The measuring atmosphere of filter samples is in vacuum and measuring diameter is 20 mm.
III. SEMI-QUANTITATIVE ANALYSIS SOFTWARE
The NEX CG includes RPF–SQX (Rigaku profile fitting–spectra quant X) software (Hara et al., Reference Hara, Kawahara, Matsuo and Doi2010) for the standardless analysis based on a fundamental parameter method (Kataoka, Reference Kataoka1989) combined with full-profile fitting method. The sensitivities are pre-calibrated using pure materials to cover the analyses of all elements from Na to U. The RPF–SQX software can cover different types of samples including multi-layered films and aerosol collected filters.
The computational scheme of RPF–SQX is summarized in Figure 1. The calculation procedure follows that: (1) first a sample is measured to obtain a spectrum. (2) Next the initial values of the thickness and contents in the sample are set. (3) Then, a profile is constructed for each individual element using the intensity obtained by the FP method and response function. The total spectrum is then calculated by summing up each individual profile. (4) The calculated total spectrum is then compared with the measured spectrum. The contents are adjusted until both spectra become equal in the figure.
(Color online) The computational scheme of RPF–SQX.

The final results are obtained by fitting of the entire spectrum, not peak intensity. The profile of each individual element is calculated using the FP method and the response function of the detector to match the measured spectrum.
The response function of the detector is required for RPF–SQX. When the semiconductor detector receives monochromatic X-rays, the output signal does not only have a peak but also have additional artifacts. The response function consists of a main peak, tail, shelf, escape peak, and sum peak at double the energy of the main peak. The hypermet function was adopted as the equation of response function (Campbell and Wang, Reference Campbell and Wang1992).
Figure 2 shows the profiles of the MnKα and Kβ lines using the response function obtained from a manganese metal sample. In this method, the sum peak created by the combination of the Kα and Kβ main peaks has also been considered. The parameters expressing the response function depend on the energy of the main peak. These parameters have been predetermined during system calibration and are stored in the software data base.
(Color online) Profiles of the MnKα and Kβ lines using the response function.
Figure 3 illustrates an example of spectral fitting using the response functions. This figure shows the measured spectrum and fitting profile of a soil sample, which contains a small amount of hazardous elements As, Se, Pb, and Hg. Their peaks overlap with each other. The profile of each K and L line is fitted using the response function and the intensity obtained by the FP method for accurate peak overlap correction. There is a good match between the measured and fitted spectra even though many peaks overlap.
(Color online) Results of the measured spectrum and fitting profile of a soil sample (JSAC0466).
It is necessary to use the thin-film FP method for the analysis of filter samples. The theoretical XRF intensity equation of the thin-film FP method was used (Shiraiwa and Fujino, Reference Shiraiwa and Fujino1969; Kataoka and Arai, Reference Kataoka and Arai1990).
Figure 4(a) shows the spectra of PbLα and Lβ lines obtained by measuring bulk and thin-film lead samples. The intensities of spectra are normalized with peak top intensities of the PbLα line. As shown in the figure, the intensity of Lβ line of the thin film is clearly smaller than that of the bulk metal. Figure 4(b) shows the relationship between the intensity ratios of PbLβ to PbLα and sample thickness. The intensity ratio of Lβ to Lα decreases as the sample becomes thinner because of self-absorption of Pb. Therefore, in order to obtain accurate full-profile fitting, it is necessary to perform profile fitting using the thin-film FP method to reflect the self-absorption.
(Color online) (a) Peak profiles of PbLα and Lβ lines of bulk and think film (50.5 µm cm−2) lead samples. (b) Relationship between intensity ratios of PbLβ to PbLα and sample thickness.
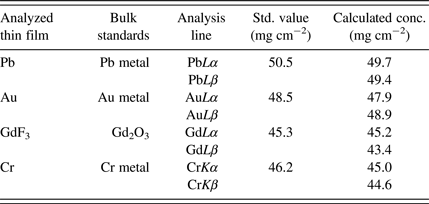
Table I compares the analysis results of the thin-film samples using both α and β analytical lines.
Analysis results of the thin-film standard samples using α and β analytical lines.
Bulk pure materials were used for the sensitivities of individual elements.
The result exhibits good agreement between standard and analysis values using any analytical line, even though the sensitivities have been registered using bulk samples and the agreement is an essential requirement for the quantification process with full-profile fitting.
Figure 5 shows the measured and fitted spectra fitted using the thin-film FP method of polymer samples with two different thicknesses. This polyethylene standard sample contains not only Pb but also As, which lines overlap with each other.
(Color online) Spectra of polymer samples (BCR680: As 30.6 ppm Pb 107.6 ppm) of different thickness. (a) Measured spectra. (b) Individual fitted spectra using RPF–SQX with quantified values.
Analytical value is about the same even when the thickness of the sample is different and fitting profiles are matched to measured spectra.
The results suggest that using the thin-film FP method and profile fitting, the accurate values can be obtained even if spectra overlap and thickness of the sample is different.
IV. AEROSOL SAMPLE ANALYSIS
The spectra of aerosol filter sample (NIST SRM 2783) are shown in Figure 6. It can be seen that it is necessary to consider the influence of the overlapping lines in order to obtain an accurate analysis result.
(Color online) Spectra of the aerosol filter standard sample (NIST SRM 2783).
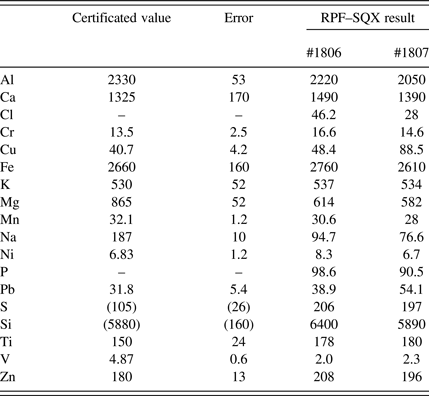
The semi-quantitative analysis results of this sample using RPF–SQX are shown in Table II. The analyzed results are in good agreement with standard values without the use of special thin-film standard samples.
Analysis results of the aerosol filter standard sample (NIST SRM 2783) obtained using RPF–SQX analysis.
Figure 7 shows detection limits MDL (method detection limits) of NEX CG. MDL is defined as 68% confidence level 1σ rather than 3σ according to US Environmental Protection Agency method I.O-3.3. The bars indicate MDL obtained in this experiment by measuring the sample of MICROMATTERTM thin-film standard samples. Measurement time is 300 s at each secondary target. The square plots show the typical MDLs by XRF listed in US EPA method IO-3.3. The experimental results of MDL obtained in the study are superior for most of the elements.
(Color online) Detection limits (MDL). The bars indicate MDLs obtained in this study. The square plots show the MDLs in US EPA method I.O. 3.3.
V. CONCLUSION
Aerosol filter samples contain many elements causing line overlaps in spectra. Combination of full-profile fitting with detector response functions and the thin-film FP method gives accurate analysis results even for the trace elements. Accurate theoretical intensity calculation for all lines for thin film enabled aerosol filter analysis using bulk standards. Good results could be obtained for a wide concentration range of inorganic elements in aerosol filters using semi-quantitative analysis without the need for a large number of reference standards.