

1 Introduction
The English genitive alternation, i.e. the variation between the of-genitive (the defence of the commonwealth, ARCHER <1653merc.n2b>) and the s-genitive (the commonwealth's defence), is – along with the dative alternation – without doubt one of the most extensively studied sites of variation in the grammar of English. The ‘Saxon’ s-genitive consists of two noun phrases in which the possessive relation is expressed by a clitic s attached to the possessor noun (commonwealth) such that the possessor (commonwealth) precedes the possessum (defence). The of-genitive places the possessum before the possessor and consists of two phrases: a noun phrase (the possessum) and a prepositional phrase (the possessor) headed by the preposition of.
Notwithstanding the sizable body of literature on genitive variation, there are still gaps in our knowledge about the genitive alternation. Thus, building on research reported in Wolk et al. (Reference Wolk, Bresnan, Rosenbach and Szmrecsanyi2013), we explore historical genitive variation in a substantially extended data set covering both British and American texts dating from the period between 1650 and 1999. By contrast to Wolk et al. (Reference Wolk, Bresnan, Rosenbach and Szmrecsanyi2013), we are in this article specifically interested in two constraints that have their roots in the dynamics of spoken language: rhythm (which is a speech-based factor because it comes within the remit of phonology) and weight (which is speech-based because the factor presumably owes its existence to online processing and parsing efficiency issues). The research objectives that guide the present study are, first, to quantify the effect that these two speech-based constraints have on genitive variation in written data with a longitudinal twist. Second, we would like to gauge the appropriateness of different operationalisations of rhythm and weight, given the nature of the data set under analysis.
The history of the genitive alternation is well known. The inflected (‘Saxon’) genitive was the dominant form during the Old English period. This changed when the inflected genitive ceded ground to the periphrasis with of during the Middle English period. Nonetheless, the s-genitive experienced a surprising comeback during the Early Modern English period (Rosenbach & Vezzosi Reference Rosenbach, Vezzosi, Sornicola, Poppe and Shisha-Halevy2000; Rosenbach Reference Rosenbach2002). Researchers agree that its text frequencies are currently on the rise (Dahl Reference Dahl1971; Raab-Fischer Reference Raab-Fischer1995; Hinrichs & Szmrecsanyi Reference Hinrichs and Szmrecsanyi2007), and that the s-genitive has been spreading into previously disfavoured contexts for a couple of centuries (Wolk et al. Reference Wolk, Bresnan, Rosenbach and Szmrecsanyi2013; Szmrecsanyi et al. forthcoming). That said, research on genitive variation in the Late Modern English period is still rather sparse.
Why focus on rhythm and weight? Rhythm is a factor situated at the syntax–phonology interface, and it is a late arrival in the probabilistic analysis of syntactic variation. Although psycholinguistic experiments on production and processing have long established an effect of rhythm on speech (Kelly & Bock Reference Kelly and Bock1988; Kelly Reference Kelly1989; McDonald et al. Reference McDonald, Bock and Kelly1993), rhythm has only recently been shown to be a determinant of grammatical variation and language change in English (Minkova Reference Minkova, Adamson, Law, Vincent and Wright1990, Reference Minkova1991; Schlüter & Rohdenburg Reference Schlüter and Rohdenburg2000; Schlüter Reference Schlüter and Rapp2002a, Reference Schlüter, Fanego, López-Couso and Pérez-Guerra2002b, Reference Schlüter2005, forthcoming; Mondorf Reference Mondorf, Rohdenburg and Mondorf2003; Gries Reference Gries, Cihlar, Franklin and Kaiser2007). The universal tendency of languages towards rhythmic regularity – more precisely, the evenly spaced distribution of stress – is termed the Principle of Rhythmic Alternation (Selkirk Reference Selkirk1984). Our take on the Principle of Rhythmic Alternation is informed by Schlüter (Reference Schlüter2005), who defines an ideal rhythm as the alternation ‘between maximally contrasting units, i.e. between stressed and unstressed syllables’ (Schlüter Reference Schlüter2005: 18). The Principle of Rhythmic Alternation is assumed to apply cross-linguistically, including stress-timed languages such as English (for a discussion see Schlüter Reference Schlüter2005: 22–6). Schlüter (Reference Schlüter2005) demonstrates how the Principle of Rhythmic Alternation has affected syntactic and morphological variation and change in English. Investigating the influence of rhythm on attributive structures, Schlüter reports, for instance, that the extremely low frequency of a-adjectives (e.g. awake, aware, ashamed) in prenominal position (e.g. an awake person) in Present-day English is conditioned by the Principle of Rhythmic Alternation. Typically, a-adjectives are stressed on their second (mostly final) syllable (awáke), whereas nouns are usually stressed on the first syllable; thus, the prenominal use of a-adjectives would result in two adjacent stressed syllables, causing a stress clash and thereby violating the Principle of Rhythmic Alternation (Schlüter Reference Schlüter2005: 79–85; see also Schlüter Reference Schlüter, Gisborne and Trousdale2008). More recent studies have analysed the influence of rhythm on syntactic alternations in English (Anttila et al. Reference Anttila, Adams and Speriosu2010; Grafmiller forthcoming; Shih et al. forthcoming). Anttila et al. (Reference Anttila, Adams and Speriosu2010) analyse the interplay of stress clash and end weight in the dative alternation (hé gíves the kéys to Tóm vs hé gíves Tóm the kéys), focusing on a small number of prosodic factors. Shih et al. (forthcoming) and Grafmiller (forthcoming), on the other hand, explore rhythm's role in the genitive alternation using a more extensive multivariate design. In Present-day English, rhythm is reported to be a significant though minor factor in genitive choice, which is often cancelled by strong animacy effects (Grafmiller forthcoming; Shih et al. forthcoming). Shih et al. (forthcoming) report a weak effect of rhythm in their spoken data, while Grafmiller obtains similarly weak effects in both a written and a mixed-modality corpus. Both papers report significant interactions between rhythm and animacy, such that rhythm is a reliable predictor only when the possessor is inanimate (Grafmiller forthcoming; Shih et al. forthcoming: 16–17).
In this article, rhythm is defined as the evenly distributed alternation of stressed and unstressed syllables; thus Obáma's spéech is rhythmically better-behaved than the spéech of Obáma. In the spirit of Shih et al. (forthcoming) and Grafmiller (forthcoming), rhythm is operationalised as comparative eurhythmy distance, a measure which quantifies the rhythmic optimality of a given genitive construction (s- or of) compared to its (constructed) competitor construction. Previous research on rhythm raises the question as to whether rhythm is, after all, a factor to be reckoned with regardless of the nature of the data set studied, or whether its effect is actually restricted to speech and/or to modern data. Thus, we set out to assess the relative importance of rhythm and its applicability as a prosodic factor to written data from the Late Modern English period. We find that rhythm, unlike other phonological factors such as the final sibilancy constraint, is only a minor player in our data set: statistically speaking, rhythm has only a weak effect on genitive choice, and it exhibits quadratic and theoretically unexpected patterns in that rhythmically more optimal constructions are overall not always preferred. We thus conclude by questioning the adequacy of current operationalisations of rhythm and their applicability to data of the type we analyse here.
Weight is a factor that has a long and empirically successful history in grammatical analysis. Since its first formulation as Behaghel's law of increasing terms (Gesetz der wachsenden Glieder, Reference Behaghel1909), the general pattern of ‘short before long’ has been observed in a variety of phenomena, including heavy noun phrase shift, particle placement and the dative alternation (Wasow Reference Wasow1997; Bresnan et al. Reference Bresnan, Cueni, Nikitina, Baayen, Boume, Kraemer and Zwarts2007). With regard to the genitive alternation, the influence of length has been observed both in corpus-based (Szmrecsanyi & Hinrichs Reference Szmrecsanyi, Hinrichs, Nevalainen, Taavitsainen, Pahta and Korhonen2008; Börjars et al. Reference Börjars, Denison and Scott2013; O’Connor et al. Reference O’Connor, Maling, Skarabela, Bӧrjars, Denison and Scott2013; Shih et al. forthcoming) and experimental studies (Rosenbach Reference Rosenbach2005). Hawkins’ Early Immediate Constituent principle (Reference Hawkins1994) provides a psycholinguistic explanation for such effects that is rooted in the properties of the human sentence-processing mechanism. For a language with a head-first tendency such as English, it is most efficient for the parser to be presented with the head (i.e. the possessum) early. A similar account can be found in Gibson's Dependency Locality Theory (Reference Gibson1998), which argues that it is the total dependency length that increases processing difficulty due to working memory constraints. A relatively fixed branching order decreases overall length, as do violations that are short (Temperley Reference Temperley2007: 305ff.). Wasow (Reference Wasow1997) argues that production complexity is important, as speakers are unlikely to have both constituents fully planned when the choice between realisations is made. Instead, speakers choose alternations in order to facilitate online production. Placing the lighter element first permits ‘postponing difficult constituents and keeping options open’ (Wasow Reference Wasow1997: 101). In terms of the genitive alternation, this means that genitives with heavier possessors and lighter possessums, as in (1), are predicted to be realised as of-constructions (which place the longer constituent last), while genitives with lighter possessors and heavier possessums should be realised as s-constructions, as in (2).
(1) Accounts from Rio de Janeiro to the 19th of March, published in the American papers, report [the amicable settlement]short possessumof [the difficulties between the Brazilian and the United States governments]long possessor. <ARCHER 1845man2.n5b>
(2) The communications program fits in with [Iran]short possessor’s [drive to build a modern and powerful military force]long possessum. <ARCHER 1975atl2.n8a>
Although weight is an empirically reliable and theoretically well-founded factor, many questions remain. First, how should weight be determined? Most studies use the number of words as an approximation of syntactic complexity. Yet, other aspects of the constituents, such as the number of stresses or the length of the individual words, may have a considerable influence (Rosenbach Reference Rosenbach2002, Reference Rosenbach2005; Anttila et al. Reference Anttila, Adams and Speriosu2010; see also Ingason & MacKenzie Reference Ingason and MacKenzie2011). In the present analysis, we focus on the number of words in each constituent, which we shall refer to as the length in words, or ‘length’ for short. We furthermore approximate sublexical characteristics of the individual words using their length in characters as a proxy, and find that this factor has a small, but reliable effect. Second, precisely how does weight affect the choice in the genitive alternation? Previous studies have either included individual effects for constituents or an aggregate of both, such as their difference or their ratio. We show that, in our data set, short genitives behave differently from longer genitives. For individual constituents this manifests itself in the form of non-linearities.
This article is structured as follows: in section 2 the data source is presented. Section 3 describes the variable context and introduces the explanatory variables. In section 4 we present the regression analysis. Sections 5 and 6 focus on the factors rhythm and weight. In section 7, we offer a summary and some concluding remarks.
2 Data
The present study draws on data from the British and American news and letters sections of ARCHER (A Representative Corpus of Historical English Registers) (Biber et al. Reference Biber, Finegan, Atkinson, Fries, Tottie and Schneider1994), Version 3.1. ARCHER is a multi-genre corpus of historical British and American English registers and samples 1.7 million words of running text from eight genres, among them news and letters – the registers subject to analysis in the present study. The news section samples texts from newspapers such as, for instance, the Boston Gazette or The Post Man and Historical Account in the earlier periods and The New York Times or the Observer in the more recent periods. In the letters section, we find correspondence from well-known writers such as John Locke, Lord Tennyson or William Faulkner. The corpus is organised into seven fifty-year periods covering the time span from 1650 to 1999, and typically we also know about the exact year of creation of each text. The American component only covers three of the seven periods, namely the periods from 1750 to 1799, 1850 to 1899 and 1950 to 1999. The news genre comprises roughly 160,000 words of British English and 67,000 words of American English. ARCHER's letters section is composed of 84,000 words of British English and 34,000 words of American English.
3 Variable context and constraints
3.1. Selecting genitives
This article is concerned with alternating genitive constructions, i.e. genitives which can in principle be realised both as an s-construction (3b) and an of-construction (3a). In other words, we analyse genitives which are grammatical variants in the Labovian sense of expressing roughly the same meaning (Labov Reference Labov1972; Rosenbach Reference Rosenbach2002: 25).
- (3)
(a) From Paris we are informed That the Duke of Norfolk, having lately received another Challenge from the Brother of the Seneschal, went to the place appointed [. . .]. (ARCHER <1682pro1.n2b>)
(b) [. . .] but before the Seneschals Brother could arrive, he was secured by the Governor of Newport, whereupon the Duke returned again to Paris. (ARCHER <1682pro1.n2b>)
We are aware of the fact that, particularly with historical data, the concept of interchangeability is problematic. Present-day speakers of English have no way of knowing whether or not a construction alternated several centuries ago. Thus, for identifying alternating genitives we follow a set of guidelines (for a detailed discussion see Wolk et al. Reference Wolk, Bresnan, Rosenbach and Szmrecsanyi2013). Genitive constructions with a pronominal possessor and/or possessum, of-constructions as occurring in titles (e.g. the earl of Harcourt, ARCHER <1654mer2.n2b>) and the phrase by the name of X were excluded. Also excluded were constructions with an indefinite possessum (4a) as well as measure (4b) and classifying genitives (4c). All these constructions are known to be categorically or near-categorically realised as either an s- or of-genitive, i.e. they do not alternate (Rosenbach Reference Rosenbach2002: 29–32).
- (4)
(a) [ESCAPE]indefiniteOF THREE MURDERERS. <ARCHER 1872gla1.n6b>
(b) I perceive you have given order for oranges and lemmons, if they be not already sent, I could wish [half a dozen bottles of good canary]measure were sent with them [. . .]. <ARCHER 1664acon.x2b>
(c) There lives at this time in Bartholomew-street, Southwark, one Mrs. Gray, a widow, who keeps [a Haberdasher's shop]classifying. <ARCHER 1774lon2.n4b>
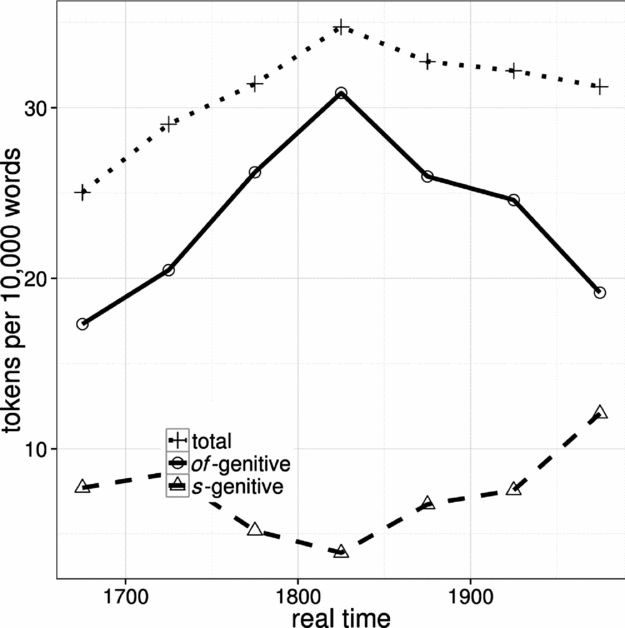
These criteria yield a set of 5,576 interchangeable genitives in the corpus material. Figure 1 shows the text frequencies of interchangeable genitives over time as sampled in ARCHER's news and letters sections. In the late sixteenth century, 70 per cent of the genitives were realised as an of-construction and only about 30 per cent as an s-construction. The proportion of s-genitives further drops and reaches its lowest point in ARCHER period 4, around 1850. During the later periods s-genitives recover (Rosenbach Reference Rosenbach2002: 184) and hold a share of roughly 40 per cent in 1999. Still, of-genitive constructions continue to dominate. Szmrecsanyi (Reference Szmrecsanyi, Bӧrjars, Denison and Scott2013) and Wolk et al. (Reference Wolk, Bresnan, Rosenbach and Szmrecsanyi2013) discuss this frequency trajectory in more detail.
Genitive frequencies in ARCHER's news and letters sections over time. The frequencies for British and American English are merged.

3.2 Constraints
Although there is no substantial difference in meaning between the two genitive variants in many cases, genitive variation is not free but conditioned by a variety of factors. While this article is focusing on rhythm and weight, these factors will not be analysed in isolation. Instead, we will consider a whole range of factors known to affect genitive choice using multivariate modelling techniques. The reason for this is simple: while multiple factors influence the choice of realisation, these factors are often patterned together (see e.g. Bresnan et al. Reference Bresnan, Cueni, Nikitina, Baayen, Boume, Kraemer and Zwarts2007 for harmonic alignment of factors in the dative alternation, Rosenbach Reference Rosenbach2005 for animacy and weight, and Arnold et al. Reference Arnold, Losongco, Wasow and Ginstrom2000 for newness and weight). Should there be a relation between, say, animacy and length of the possessor, such that inanimate possessors tend to be longer, considering only length would lead to a confounding of variables. The observed effect of length would most likely be too large, as it conflates two independently acting factors. Similarly, not controlling for other factors may mask weak effects if they point in a different direction than a stronger effect with which they are correlated. In a multivariate model, the effect of each factor is determined separately. Therefore, the effect of all explanatory factors can be kept apart and a given effect cannot be the hidden version of a predictor already in the model (unless there are collinearity issues). Thus, using multivariate modelling we will be able to assess the relative importance of rhythm and weight as well as the extent to which they influence genitive choice in relation to other factors. We annotated our genitives largely following Wolk et al. (Reference Wolk, Bresnan, Rosenbach and Szmrecsanyi2013) and will briefly summarise the annotation procedure for the various predictors as well as their expected effect on the genitive alternation, according to the literature.
3.2.1 Animacy
Animacy is known to have a very strong effect on the genitive alternation. Previous research has established that animate possessors are more likely to occur in s-genitive constructions whereas non-animate possessors tend to prefer the of-variant (Rosenbach Reference Rosenbach, Rohdenburg and Mondorf2003, Reference Rosenbach2005; Hinrichs & Szmrecsanyi Reference Hinrichs and Szmrecsanyi2007). We adapt the Zaenen et al. (Reference Zaenen, Carlette, Garretson, Bresnan and Koontz-Garboden2004) coding scheme to annotate possessor animacy and distinguish between five categories: animate, collective, inanimate, locative and temporal nouns (see examples (5a–e) for illustration). Humans (e.g. Tom, father) and humanoid beings such as gods, as well as higher animals were considered animate. The category ‘collectives’ refers to organisations such as government or army as well as to groups of humans that are temporally stable, with potentially variable concord, such as committee, delegation but also family. The category ‘locatives’ includes locations but also geographical nation states, e.g. the countryside, France. Temporal nouns include both points in time and periods of time, for instance last Friday or summer. All other concrete or non-concrete nouns fall into the category ‘inanimate’.
- (5)
(a) Animate The Rumours of This Town have been so wild and various concerning the particulars of the late Battle, betwixt [His Majesties]animateFleet, and the Hollanders [. . .]. <ARCHER 1665int2.n2b>
(b) Collective First, was delivered the Claims from the Merchants of [the East India Company]collective, amounting to a great Bulk. <ARCHER 1654mer2.n2b>
(c) Locative [. . .] bearing to be an Appeal of the Inhabitants of [the Palatinate]locative to the Sovereigns at Aix-la-Chapelle, which our readers will find in another column. <ARCHER 1819mor1.n5b>
(d) Temporal Firms normally have between [one and four weeks’]temporalsupply of fuel and one week's stock of raw materials, but they have already been cut by the weather and earlier haphazard industrial action by tanker drivers. <ARCHER 1979stm1.n8b>
(e) Inanimate [. . .] and to cleanse his body from all diseases by the vertue of [those Waters]inanimate, in order to his Voyage for Scotland, that so he may not want bodily health to march with his Troops [. . .]. <ARCHER 1654mer2.n2b>
3.2.2 Definiteness
In discourse, the information status or topicality of constituents is known to constrain word order (Behaghel Reference Behaghel1930; Clark & Clark Reference Clark and Clark1977; Arnold et al. Reference Arnold, Losongco, Wasow and Ginstrom2000; Börjars et al. Reference Börjars, Denison, Krajewski, Scott, Börjars, Denison and Scott2013); information which is already given is easily accessible to the speaker/writer and is therefore positioned before new information. Definiteness can be used as a proxy for information status (Börjars et al. Reference Börjars, Denison and Scott2013), i.e. definite possessors can be assumed to be given information. Therefore, definite possessors should favour the s-genitive, which places the possessor before the possessum, and present the ‘old’ information first. Indefinite possessors, on the contrary, should favour the of-genitive (Biber et al. Reference Biber, Johansson, Leech, Conrad and Finegan1999: 305–6; see also Quirk et al. Reference Quirk, Greenbaum, Leech and Svartvik1985). All possessors which were headed by a definite determiner, that/this, a (definite) pronoun or an s-genitive were coded as definite (see example (6a)). Proper names, i.e. proper nouns, titles and names of institutions were coded as a separate category (6b). All other cases, especially those headed by an indefinite determiner (6c), were coded as indefinite. Possessums were not coded for definiteness as the selection criteria for genitives excluded constructions with indefinite possessums and pronominal phrases.
- (6)
(a) This Sunday a middle-west publisher (middle west is the agricultural part of USA) who was flabbergasted at the proximity of [Laura's little farm]definite. <ARCHER 1949waug.x7b>
(b) [Your Lordshippes]proper nameletter I sent open to your Brother Sir John Finch, and it is well I did, for Hee hath corrected a mistake [. . .]. <ARCHER 1668bain.x2b>
(c) James Ker [a minester]indefinite's son who formerly went by the name of Harrisen; <ARCHER 1653merc.n2b>
3.2.3 Semantic relation
Furthermore, the data are annotated for the semantic relation a given possessor and possessum pair encodes. Following Rosenbach (Reference Rosenbach2002), we distinguish two genitive relation types: prototypical and non-prototypical relations. This binary categorisation is both theoretically motivated by typological research on possession (Koptjevskaja-Tamm Reference Koptjevskaja-Tamm, Haspelmath, König, Oesterreicher and Raible2001, Reference Koptjevskaja-Tamm2002) as well as practically feasible (Wolk et al. Reference Wolk, Bresnan, Rosenbach and Szmrecsanyi2013: 397–8). Prototypical relations are known to favour the s-genitive and include legal ownership (7a) and kinship relations (7b), body parts (7c) as well as concrete inanimate part–whole relations (7d).
- (7)
(a) Legal ownership
Some soldiers of Captain Weddall's troope Quartering at Houston [a Gentlemens house]prototypical neare Peasly, found therin behind the hangings sixty sixed muskets [. . .]. < ARCHER 1653merc.n2b>
(b) Kinship
The same day died, at Windlestone, Miss Caroline Eden, [daughter of Sir John Eden Bart]prototypical. <ARCHER 1785gen1.n4b>
(c) Body parts
[. . .] nor was he satisfied till he broke [another Man's Arm]prototypical. <ARCHER 1752lon1.n4b>
(d) Part–whole
And put the plate somewhere cool, e.g., on a window-sill, not on [top of a radiator]part-whole. <ARCHER 1950sack.x8b>
Non-prototypical relations, on the other hand, are expected to prefer the of-genitive. They comprise non-prototypical ownership/possessive relations (8a) and all other types of relations (8b). While, strictly speaking, valence relations such as objective (8c) and subjective (8d) genitives are beyond this classification scheme, they were subsumed under the category ‘non-prototypical’ (Rosenbach & Vezzosi Reference Rosenbach, Vezzosi, Sornicola, Poppe and Shisha-Halevy2000; Wolk et al. Reference Wolk, Bresnan, Rosenbach and Szmrecsanyi2013).
- (8)
(a) Non-prototypical possession
Thus you see the footsteps of [Gods Justice]non-prototypical. <ARCHER 1653merc.n2b>
(b) Other
His message came in a long address to mark World Peace Day which this year (for all churches outside England and Wales) fell on [New Year's Day]non-prototypical. <ARCHER 1989tim2.n8b>
(c) Objective
It was believed that [the expulsion of the Jesuits]non-prototypical must take place ere order be permanently restored. <ARCHER 1845man2.n5b>
(d) Subjective
[. . .] and we are not a little startled at [the coming of Monsieur De Stalon]non-prototypical on behalf of the French Crown; <ARCHER 1682pro2.n2b>
3.2.4 Final sibilancy
The occurrence of a final sibilant in the possessor has been shown to influence genitive choice: possessors ending in a sibilant favour the of-genitive (Altenberg Reference Altenberg1982; Zwicky Reference Zwicky1987; Hinrichs & Szmrecsanyi Reference Hinrichs and Szmrecsanyi2007; Grafmiller forthcoming). Drawing on the Carnegie Mellon University Pronouncing Dictionary 0.7a,Footnote 2 we coded all possessors ending in [s], [z], [ʃ], [ʒ] [tʃ], [dʒ] as having a final sibilant. Manual coding was applied to tokens which were not in the dictionary. Example (9) shows one of the rare occurrences of an s-genitive with a possessor ending in a final sibilant.
(9) Sunday last being [the Empress]+ final sibilant’s Birth-Day, her Imperial Majesty went in State to the Cathedral Church; <ARCHER 1743lon1.n3b>
3.2.5 Rhythm
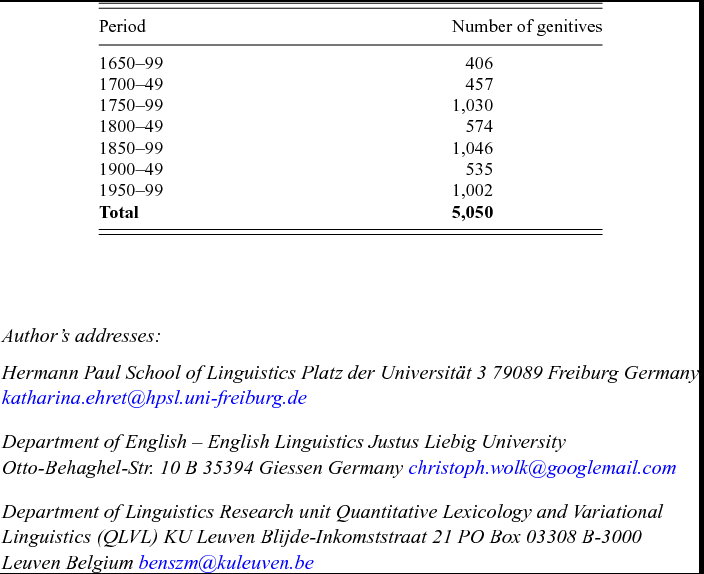
We expand the portfolio of constraints investigated in Wolk et al. (Reference Wolk, Bresnan, Rosenbach and Szmrecsanyi2013) by adding the phonological factor rhythm. Methodologically, rhythm (that is, lexical stress) is automatically annotated using the UNISYN Lexicon 1.3 in combination with the online Oxford English Dictionary (OED). The UNISYN Lexicon is an electronic dictionary which was developed at the University of Edinburgh. The lexicon entries are transcribed in key symbols and encode multiple accents of English (e.g. British, American and Australian). The OED is a comprehensive dictionary of English and samples over 600,000 words of English starting from AD 1150 up to the present day. Basing the lexical stress annotation on dictionaries of modern English is, of course, not unproblematic. However, stress changes in the Late Modern English period were rare and mostly restricted to metrical prose – texts written in metre/rhyme (Julia Schlüter, personal communication, 24 April 2013).Footnote 3 For want of genuine historical pronunciation recordings, we consider the combined UNISYN–OED the best available reference guide for annotating our data set. For the purpose of this analysis, we use the British and American English version of the UNISYN dictionary adding missing plural or genitive entries (for example, if brandenburg is a dictionary entry brandenburg’s was added). This adds an extra syllable to possessors ending in a final sibilant – unless the sibilant is a plural marker (Zwicky Reference Zwicky1987; Börjars et al. Reference Börjars, Denison and Scott2013). In other words, in the genitive the prince's army speakers would add an extra unstressed syllable to the possessor prince’s [prɪns-iz], but in the princes's army no syllable would be added to the plural possessor princes’s [*prɪnsiz-iz]. Minor orthographic mistakes and/or outdated spelling variants in the data were manually adjusted and numbers were converted to words prior to rhythm annotation. For example, spelling anomalies such as minester, majestie or aprill were replaced by minister, majesty and april in order to facilitate automatic stress annotation, and 500 was changed to five hundred. Syllable counts and stress patterns of the ‘corrected’ tokens thus remain unaffected. Words not listed in the UNISYN dictionary were manually stress coded according to the OED and then added to the UNISYN Lexicon.Footnote 4 However, constructions containing words that were listed in neither of the dictionaries had to be excluded from the analysis. In total, 523 constructions were excluded. This yields a data set of 5,050 rhythm-annotated genitives consisting of 3,888 of-genitives and 1,162 s-genitives. Table 1 lists the number of genitives per ARCHER time period.
Rhythm-annotated genitives by ARCHER time period. In the periods 1750–99, 1850–99 and 1950–99 the number of tokens roughly doubles as the corpus also samples American English data for these periods.
Our working hypothesis was that rhythm would influence genitive choice as follows: in choosing between the of-genitive and the s-genitive for a given possessor and possessum pair, writers should prefer the construction which is closer to a perfect alternation of stressed and unstressed syllables, all other things being equal. According to the Principle of Rhythmic Alternation, stress clashes (two adjacent stressed syllables) and stress lapses should be avoided, i.e. ideally one unstressed syllable should always be located between two stressed ones. The examples below illustrate a perfectly alternating rhythm (10a), a stress lapse (10b) in which three unstressed syllables are located between the stressed ones, and a stress clash (10c) with two adjacent stressed syllables. Unstressed syllables are marked as ‘w’ (weak) whereas stressed syllables are marked as ‘s’ (strong). As our interest lies with the simple alternation of stressed and unstressed syllables, we adopt a binary distinction between stressed and unstressed syllables which has already been successfully implemented in other work on rhythm in the genitive alternation (Grafmiller forthcoming; Shih et al. forthcoming). Thus, we do not distinguish between primary and secondary stress but treat all syllables with either stress type as ‘stressed’.
(10)

How can these differences be operationalised? Following Shih et al. (forthcoming) and Grafmiller (forthcoming), we calculate comparative eurhythmy distance (cED), a measure which quantifies the rhythmic optimality of a given genitive construction in relation to its variant form. The comparative eurhythmy distance is based on two separate measurements: s-eurhythmy distance and of-eurhythmy distance. In a first step, the intervening unstressed syllables between the stressed syllables of a given possessor and possessum pair are counted (a) in its actual realisation, and (b) in the corresponding hypothetical realisation. In other words, we count the intervening unstressed syllables for both its s-construction (s-ED) and of-construction (of-ED). Note that we remove the determiner in the possessum, if there is one, as the s-genitive does not allow a determiner in that position. One is subtracted from the number of unstressed intervening syllables and the absolute value is taken to yield the eurhythmy distance of the respective construction type for each genitive occurrence (see examples (11a, b) below). For operational reasons, we regard the of in of-constructions always as an unstressed syllable.Footnote 5 Consequently, of-genitives cannot contain clashes and have a minimum eurhythmy distance of zero. For the s-genitive, however, it is possible that two stressed syllables are located next to each other (10c), and not taking the absolute value would lead to a nonsensical value of –1. After taking the absolute, we arrive at an interpretable value: the distance, measured in unstressed syllables, from a perfect rhythmic alternation. A distance of 0 means that the construction exhibits a perfect, eurhythmic alternation of stressed and unstressed syllables according to the Principle of Rhythmic Alternation (Shih et al. forthcoming). Example (11) demonstrates more concretely how eurhythmy distance is calculated. For the possessor and possessum pair Seneschal – brother the eurhythmy distance of both the s-construction (11a) and of-construction (11b) are calculated in order to determine which construction is rhythmically more optimal. The s-eurhythmy distance equals 1, while the of-eurhythmy distance equals 2.
(11)
In a second step, we combine the two measurements and calculate relative rhythmic optimality by subtracting the s-eurhythmy distance from the of-eurhythmy distance (12).
(12) cED = of-eurhythmy distance – s-eurhythmic distance
When of-ED is greater than s-ED, the comparative eurhythmy distance is positive indicating that the s-construction is rhythmically more optimal than the of-construction. In example (11), the cED is therefore 2 – 1 = 1. Conversely, when the of-ED is smaller than the s-ED, the comparative measure is negative and the of-construction is rhythmically more optimal than the s-construction. In other words, comparatively larger cED values should favour the s-genitive while comparatively smaller cED values should favour the of-genitive. A value of zero indicates that neither construction is rhythmically more optimal than its competitor. The examples below each show an s-genitive and an of-genitive for comparative eurhythmy distances greater than zero (13), smaller than zero (14) and equal to zero (15).
- (13)
(a) Monsieur Caillere writes that [The Ministers of the Emperor]cED = 2 are not satisfied with our offers in relations to Lorrain [. . .]. <ARCHER 1697pos1.n2b>
(b) M. Louis Siries, Director of the Works in [the Emperor's Gallery]cED = 2, died here the 6th in an advanced Age. <ARCHER 1762publ.n4b>
- (14)
(a) [. . .] [the paternal care of his majesty]cED = -2 towards the island of Jersey, his constant solicitude for the happiness of his subjects there [. . .] were placed by that eloquent Speaker in the strongest point of view. <ARCHER 1793sta1.n4b >
(b) [. . .] and arrived at Utrecht after Midnight, and rested at M. Pouchoud’s, his [his majesty's electoral commissary at that place]cED = -2. <ARCHER 1735rea2.n3b>
- (15)
(a) Thus you see [the footsteps of god's justice]cED=0.<ARCHER 1653merc.n2b>
(b) Therefore committing the whole buisiness to your Ladiships consideration and committing you to [God's gracious keeping]cED=0, I am, Dear Madam, Your Ladiships most humble and affectionat servant, HEN. MORE. <ARCHER 1678more.x2b>
It is important to note that the eurhythmy distance measure neglects the difference between stress clashes and lapses: both deviations are considered equidistant from a perfectly alternating rhythmic pattern (Shih et al. forthcoming). Although previous research claims that stress clashes should generally violate the Principle of Rhythmic Alternation more severely than stress lapses (Nespor & Vogel Reference Nespor and Vogel1989), Shih et al. (forthcoming) found that this did not hold for their genitive data. In fact, their results show that stress clash is an unreliable predictor in genitive choice (Shih et al. forthcoming). We will discuss this issue in a little more detail in section 5.2.
3.2.6 Weight
According to the principle of end-weight, in languages like English longer and more complex constituents are usually positioned after shorter and less complex constituents (Behaghel Reference Behaghel1909; Wasow Reference Wasow2002). Hence, genitive constructions with heavy possessors should favour the of-genitive while constructions with heavy possessums should favour the s-genitive (Altenberg Reference Altenberg1982: 76–9; Quirk et al. Reference Quirk, Greenbaum, Leech and Svartvik1985: 1282; Biber Reference Biber, Aitchison and Lewis2003: 304–5; Hinrichs & Szmrecsanyi Reference Hinrichs and Szmrecsanyi2007: 453).
There are two major questions when choosing an operationalisation of weight. First, how is weight to be determined from the data, and second, how should this measure be represented in the statistical analysis? Perhaps the simplest representation is based directly on the number of graphemic words in the possessor and possessum. A crucial advantage of this measure is that it can be easily determined automatically and without additional annotation. It is therefore commonly used in the analysis of the genitive alternation, for example in Hinrichs & Szmrecsanyi (Reference Hinrichs and Szmrecsanyi2007), or as one operationalisation in Shih & Grafmiller (Reference Shih and Grafmiller2011), and also in other alternations such as heavy noun phrase shift (Wasow Reference Wasow1997). It is, however, by no means the only option. Weight could instead be based on a more phonological representation (Zec & Inkelas Reference Zec, Inkelas, Inkelas and Zec1990), such as the number of syllables, (primary) stresses (Anttila et al. Reference Anttila, Adams and Speriosu2010; Shih & Grafmiller Reference Shih and Grafmiller2011), or phonemes (e.g. Ryan Reference Ryan2013). Alternatively, syntactic complexity could be measured based on the structure of a formal syntactic representation, such as the number of (total or phrasal) syntactic nodes in a tree-based representation (Wasow Reference Wasow1997; Shih & Grafmiller Reference Shih and Grafmiller2011). Psycholinguistically motivated operationalisations are also possible: Gibson (Reference Gibson1998: 12) argues that it is primarily the integration of new spatio-temporal discourse referents that causes processing costs, which leads to the number of discourse-new nouns and verbs as the appropriate choice (Shih & Grafmiller Reference Shih and Grafmiller2011). Finally, Wolk et al. (Reference Wolk, Bresnan, Rosenbach and Szmrecsanyi2013) use the number of orthographic characters.
All operationalisations of weight tend to be very similar to each other. Wasow (Reference Wasow1997) reports correlation coefficients of 0.94 to 0.99 for words, nodes and phrasal nodes in data sets for three different constructions. Szmrecsanyi (Reference Szmrecsanyi, Purnelle, Fairon and Dister2004) finds a rank correlation coefficient of over 0.97 between words and syntactic nodes for complete sentences in both written and spoken English. Similarly, Börjars et al. (Reference Börjars, Denison, Krajewski, Scott, Börjars, Denison and Scott2013: 134) note that word and syllable length are ‘closely correlated’ for genitive constituents. Wolk et al. (Reference Wolk, Bresnan, Rosenbach and Szmrecsanyi2013) compare words, characters and (for a random subset of their data) syllables, and find correlation coefficients of over 0.97 for all measures, with syllable and character counts being the most similar at r = 0.99. So the upshot is that most measures tend to be adequate at representing weight, and simpler methods can be used as very good approximations of more complex ones. This, however, does raise the question of whether all weight counts have exactly the same effect and only differ in noise, or whether the characteristics of individual operationalisations add meaningful information.
In the analysis below, given that our data set covers written English we explicitly investigate the precise nature of what character-based counts add to word-based weight measures. Let us begin by discussing how we determined the individual counts. First, the precise constituent boundaries of all genitive constructions were determined manually. These boundaries include all postmodifications that were not interrupted by an intervening element. For example, the possessor in sentence (16), the Surgeon, consists of two words, and the possessum in sentence (17), visit to Egypt, Syria and Iraq, consists of six words.
(16) This morning's letter states [the apprehensions]possessum of [the Surgeon]possessor that the violent catchings of his Patient have done material injury to the bone [. . .]. <ARCHER 1800aust.x5b>
(17) The report was one of several that recently appeared in Egyptian newspapers ascribing the postponement of [Brezhnev]possessor ’s [visit to Egypt, Syria and Iraq]possessum to health reasons. <ARCHER 1975atl1.n8a>
There is a complication involving possessums, namely that they often require a determiner in the of-genitive that would be ungrammatical in the s-genitive: the apprehensions of the surgeon but *the surgeon's the apprehensions. Therefore, determiners at the start of the possessum phrase were removed for calculating length. This means that, in sentence (16), possessum length is one word. Finally, the counts were logarithmically transformed, using the natural logarithm, to remove the emphasis on the few particularly long constituents where little alternation is to be expected: the maximal length of the possessor is 35 words and 29 for possessums, yet 98 per cent of possessors and 87 per cent of possessums are less than six words long. We thus end up with length values of ln(1) = 0 for the possessum in (16) and the possessor in (17), ln(2) = 0.63 for the possessor in (16), and ln(6) = 1.79 for the possessum in (17).
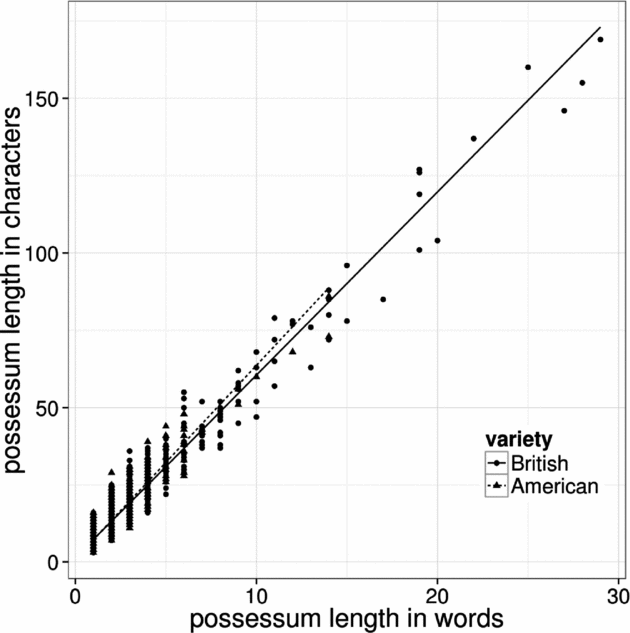
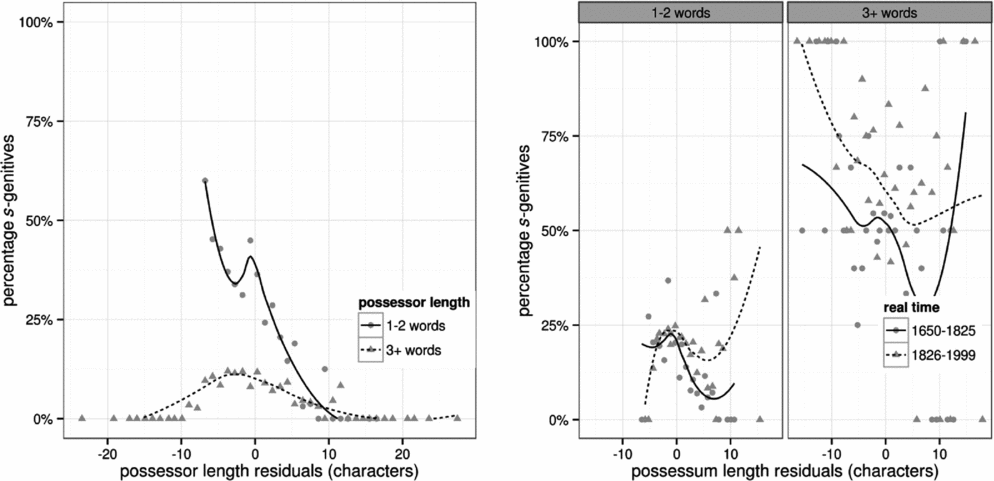
Character lengths were determined in a similar way. Based on the same constituent boundary definitions, initial determiners in possessums were removed, as was hyphenation to reduce the influence of changes in orthographic style.Footnote 6 This leads to values of 11 for the possessor in (16) and 8 in (17). In general, character and word counts are very highly correlated (Pearson's r = 0.97). This poses a problem for the statistical analysis, as both variables tell very similar stories. Furthermore, spelling differences between American and British English as well as diachronic changes in orthography may influence the character counts. To solve both problems, we performed a linear regression predicting the length in characters from the number of words, allowing this relation to vary by variety and real time. For possessors, we find an average number of 5.9 characters per word in the year 1800 in American English, with each century adding a length of 0.2 characters and British words being 0.1 characters shorter. For possessums, we obtain an average length of 6.3 characters per word (including whitespace), with a small, marginally significant change per century of 0.04 characters per word, and a larger difference between varieties – British words being 0.37 characters shorter. Figure 2 displays this relation for possessums, with separate lines for the two varieties. Clearly, the individual observations fit the line very well. The complete model explains about 90.2 per cent of the variance in character counts; for possessors, the fit is even better at 95.7 per cent. We can now use the distance from the line to measure how short or long a constituent is relative to the number of words, a process known as residualisation. The possessum in sentence (16), apprehensions, is about 5.8 characters longer than the average one-word possessum given its length, variety and year, while the possessum in sentence (17), visit to Egypt, Syria and Iraq, is 9.8 characters shorter than average.
Relation between possessum length in words (x-axis) and possessum length in characters (y-axis). Solid line indicates relationship for American English, dashed line for British English.
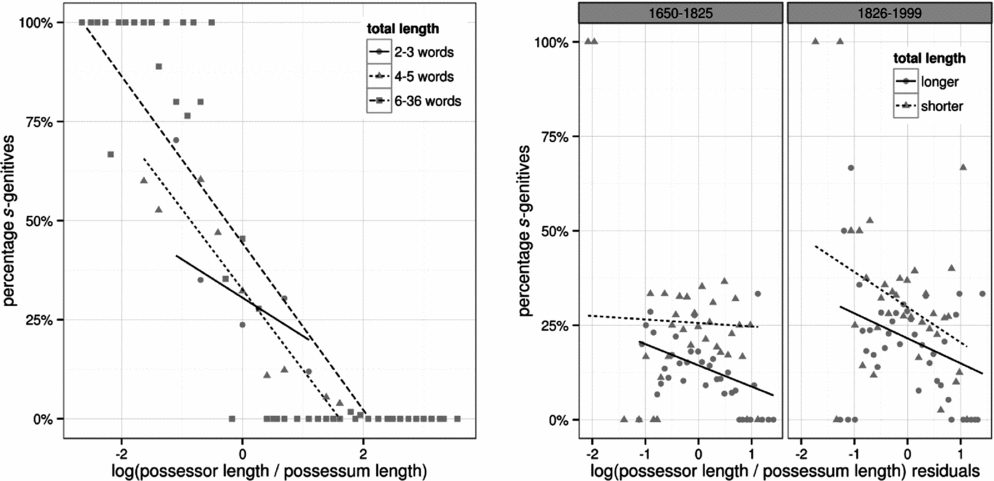
Finally, the precise way in which one should model weight in statistical analysis merits discussion. In genitive models, often both individual possessor and possessum lengths are included; examples of this approach are Hinrichs & Szmrecsanyi (Reference Hinrichs and Szmrecsanyi2007), Shih et al. (forthcoming), Wolk et al. (Reference Wolk, Bresnan, Rosenbach and Szmrecsanyi2013) and Grafmiller (forthcoming). In these studies, possessum length often has little effect on genitive choice and is therefore sometimes removed from the final model. Szmrecsanyi (Reference Szmrecsanyi, Geeraerts, Kristiansen and Peirsman2010), for example, finds in a multi-corpus comparison that possessum length (in words) has an effect in only six out of ten corpora. Wolk et al. (Reference Wolk, Bresnan, Rosenbach and Szmrecsanyi2013) find an effect of both constituent lengths that is not linear; for very short constituents, greater length does not increase the probability of being placed last. Other researchers have opted to combine both lengths into a single value – following Bresnan & Ford (Reference Bresnan and Ford2010), who developed a ratio measure for length in the English dative alternation. Specifically, Shih & Grafmiller (Reference Shih and Grafmiller2011) use the logarithm of possessor length minus the logarithm of possessum length, which is equivalent to the logarithm of the ratio between possessor length and possessum length. Such a metric has some advantageous properties: it makes the analysis simpler, as there is only one value instead of two or more, and it clearly indicates which constituent is longer. The question, then, is whether this measure is adequate or whether individual values improve the accuracy of the models.
We therefore calculated the relative lengths according to the formula used by Shih & Grafmiller (Reference Shih and Grafmiller2011), and compared the resulting values to the individual constituent lengths. In example (16) the possessor contains twice as many words as the possessum, and therefore the resulting value is ln(2) = 0.69; in example (17) the possessor is only 1/6 as long as the possessum, and the log ratio is ln(1/6) = −1.79. We also determined the logarithm of the total length of both constituents, ln(3) = 1.1 in (10) and ln(7) = 1.9 in (11). Finally as with single counts, we investigate the effect of length in characters through residualisation: we find that for log ratios, the character-based measure increases slightly slower than the word-based measure (0.97), and the same is true for the total length at (0.99). Example (16) is more possessum-heavy in characters than one would expect (given the difference in words) and slightly longer than one would expect (residuals of –0.71 and 0.27), while example (17) is relatively more possessor-heavy and shorter (residuals of 0.55 and −0.19).
4 Regression analysis
We analyse our data using logistic regression analysis, which calculates the effect of individual predictors on a binary dependent variable under multivariate control. Applied to the genitive alternation this means that regression modelling estimates the probability with which a genitive is realised as either an of-construction or an s-construction given the constraints (in variationist sociolinguistics parlance: conditioning factors) discussed in the previous section. More specifically, we will calculate a mixed-effects regression model which incorporates both fixed and random effects. Fixed-effects models are used for assessing fixed factors with repeatable levels, whereas random effects are used when dealing with heterogeneous samples taken from much larger groups (Baayen Reference Baayen2008). Random variation in the data is operationalised by corpus file and possessor head noun lemma. This captures idiolectal preferences by individual authors and lemma specific behaviour. Logistic regression and all other statistical tests were implemented using the statistics package R version 3.0.1 (R Core Team 2013) and lme4 version 0.999999–2 (Bates et al. Reference Bates Douglas, Bolker and Walker2013).
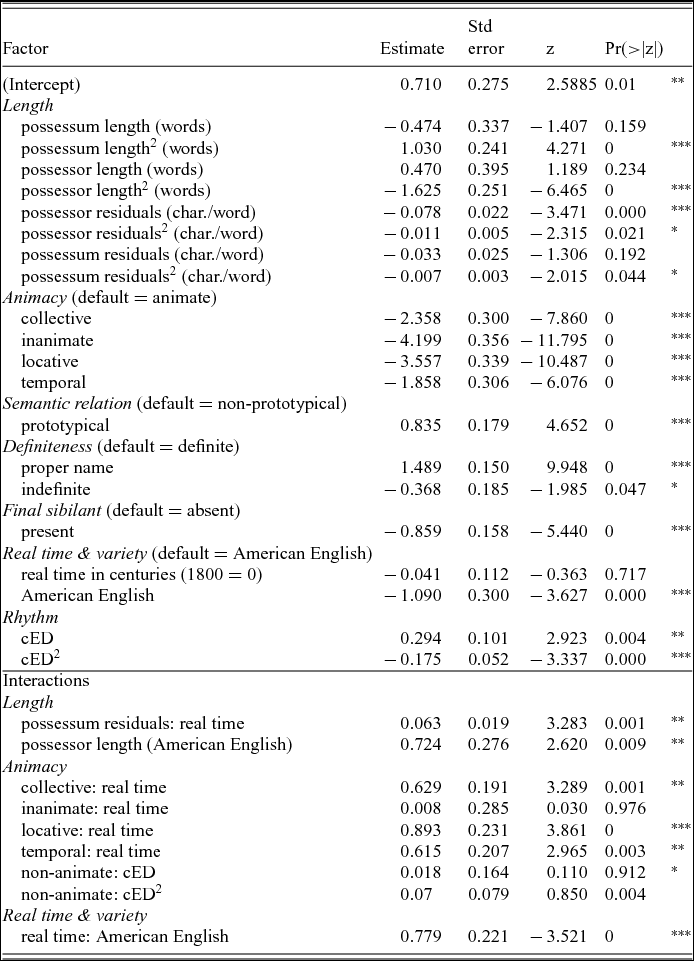
The model presented here builds on the models reported in Wolk et al. (Reference Wolk, Bresnan, Rosenbach and Szmrecsanyi2013) and Szmrecsanyi et al. (forthcoming), but is restricted to the set of rhythm-annotated genitives described in section 2.5. The new length-based predictors (section 3.2.6) were included in the model, as were quadratic terms to represent potential non-linear relationships and all interactions between length, real time and variety.Footnote 7 Predictors that were not significant and did not contribute to the model accuracy according to the customary Akaike Information CriterionFootnote 8 (AIC; Sakamoto & Akaike Reference Sakamoto and Akaike1978) were then removed unless there was strong prior evidence that the factor should be relevant. Table 2 displays the best model in which possessor and possessum length are included separately. The model is rather accurate, correctly predicting 91.3 per cent of all genitive constructions. This is a notable increase over the baseline model that always predicts the most frequent realisation, which is only accurate in 77.0 per cent of cases. The model reaches a Somers’ Dxy value of 0.92, indicating a good fit. The model data exhibit a kappa value of 18.4, above the threshold indicating medium collinearity according to Baayen (Reference Baayen2008: 182). This results from the correlation between the numeric predictors (length and rhythm), their squared versions and their interaction terms. This correlation can be considerably reduced by centring the predictors around their mean, at the cost of making the interpretation of the model somewhat less straightforward. The equivalent model with centred predictors is essentially unchanged, but yields a considerably smaller kappa value of 11.8. All predictors that significantly influence realisation choice remain significant; furthermore, even the kappa value for the model with uncentred values is far below the threshold of 30 that indicates potentially harmful collinearity (Baayen Reference Baayen2008: 182). We thus proceed using the uncentred values.
Fixed effects in the mixed-effects logistic regression model for genitive variation in ARCHER. ‘:’ between predictors indicates interactions. Predicted odds are for the s-genitive. Significance codes: *significant at p < .05, **p < .01, ***p < .001.
Let us now walk through the model reported in table 2. The predicted odds are for the s-genitive: positive coefficients indicate that a condition attracts the s-genitive, negative coefficients indicate that a condition attracts the of-genitive. The coefficients themselves are on the log odds scale and can be used to calculate the s-genitive probability for each case. The line marked ‘(Intercept)’ gives the log odds in the default case, i.e. a non-prototypical genitive by a British writer in 1800, where the possessor is animate, definite and does not end in a sibilant, where the rhythm distribution is optimal, and where both possessor and possessum are exactly one word long and of average length in characters. There is no example in the corpus that matches the default case perfectly, but some come very close. Example (18), for instance, has a proper name as the possessor, is from a text written down fifteen years after 1800 and the possessum is about two characters short, but the example may serve as an illustration nonetheless. For the perfect default case, the model gives log odds of 0.71. Reversing the natural logarithm leads to values that can be interpreted as odds. In this case the model predicts odds of e0.710 ≈ 2.03. Using the formula p(x) = odds(x)/(odds(x) +1), we can transform this value into the associated probability: 2.03/3.03 = 0.67, or 67 per cent s-genitives. By summing up the effects of other conditions, values for different predictor values can be computed. As an example, consider the case where the possessor is three words longer than before. Example (19) comes close: it is again a proper name, written down twenty-five years before 1800, and possessor and possessum are within about three characters of the optimal length. We sum up the intercept and all coefficients whose predictor is not zero (the coefficients for possessor length and possessor length squared) to determine the log odds as follows: 0.712 + 0.47 * ln(4) - 1.625 * ln(4)2 = −1.76, odds of e−1.76 ≈ 0.17, and a probability of 0.15. In other words, increasing the possessor length by three words reduces the expected percentage of s-genitives from 67 to only 15.
(18) I long to know how Martha's plans go on. <ARCHER 1815aust.x5b>
(19) I will therefore beg of you to direct to me to the care of Mr John Balfour, Bookseller. <ARCHER 1776smit.x4b>
As can be seen in table 2, both word-based measures and the character residuals significantly affect genitive choice, and in all cases this relationship is not linear. For lengths in words, we find that, as expected, longer possessums lead to more s-genitives and longer possessors to more of-genitives on the whole. Two interactions exist: one indicating a larger effect of possessor length (in words) in American English, and a diachronic effect of possessum residuals, stating that through time, relatively longer possessums (in characters) increasingly lead to more s-genitives. Note that the linear component of possessum length in words is not significant and does not appear in interactions, yet should remain in the model due to the significance of the quadratic term (Baayen Reference Baayen2008: 166). We will visualise these effects in section 5.
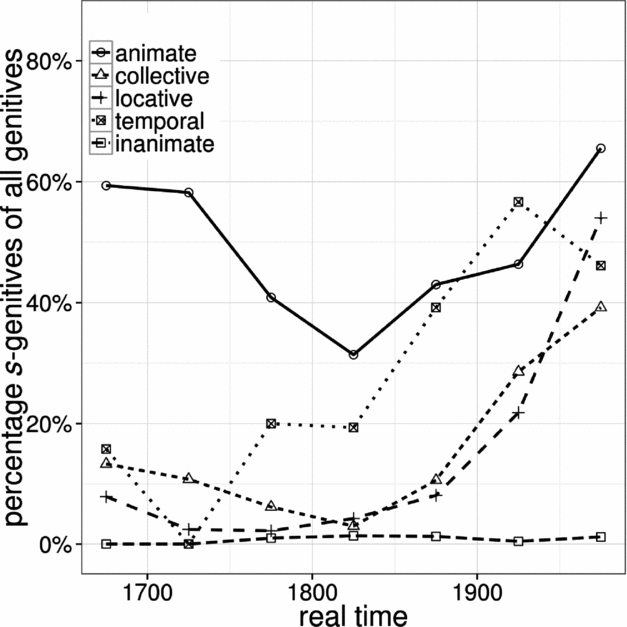
For the other predictors, the animacy categories have the expected distribution. Vis-à-vis the default condition (animate possessors) all other animacy categories reduce the odds for an s-genitive; locative and inanimate possessors most strongly repel the s-genitive. There is a significant interaction for all categories except inanimate possessors such that through real time, the negative association between non-animate possessors and the s-genitive weakens. Figure 3 displays the observed s-genitive proportions by ARCHER period. Animate possessors exhibit a v-shaped pattern, dropping continuously between 1650 and 1850, then increasing again. This increase coincides with increases for collective, locative and temporal possessors. Inanimate possessors remain virtually unchanged. Discussion of this change can be found in Wolk et al. (Reference Wolk, Bresnan, Rosenbach and Szmrecsanyi2013) and Szmrecsanyi et al. (forthcoming). Here, it will suffice to say that this change is consistent with previous findings pointing to an extension of the s-genitive to non-animate possessors especially during the twentieth century (Raab-Fischer Reference Raab-Fischer1995; Rosenbach Reference Rosenbach, Rohdenburg and Mondorf2003; Jankowski Reference Jankowski2009, Reference Jankowski2013), and that other constructions exhibit a similar extension across animacy categories – consider the progressive construction (Hundt Reference Hundt2004), where this change begins earlier, and the dative alternation (Wolk et al. Reference Wolk, Bresnan, Rosenbach and Szmrecsanyi2013).
S-genitive percentages (y-axis) by ARCHER time slice (x-axis) for the five animacy categories
Moving on, we find that genitives expressing a prototypical semantic relation – i.e. legal ownership, body parts, part–whole and kinship – are associated with s-genitives, as expected. Examples can be found in (20) and (4a–c). The difference between definite possessors and indefinite possessors is barely significant and small, but proper names strongly and reliably prefer the s-genitive, compared to other definite possessors. Final sibilants, on the other hand, reduce the probability of an s-genitive. Finally, for real time and variety, we find that American English has a lower probability of s-genitives in the year 1800, but that this difference is rapidly closing diachronically. In British English there is no main effect of real time.
(20) The next day, to amuse themselves, the children imitated the last scene; the eldest boy, taking a kitchen knife as a poignard, plunged it into [his sister's throat]prototypical, and inflicted so serious a wound that she died in a few minutes. <ARCHER 1858peo2.n6b>
Let us now turn to the effect of rhythm. As previous investigations (Grafmiller forthcoming; Shih et al. forthcoming) suggest that the effect of this factor crucially depends on the animacy of the possessor, we enforce an interaction term in the regression model to account for this. Rhythm, as measured by comparative eurhythmy distance, turns out to be a significant predictor of genitive choice even in the unconventional (written, historical) data set under analysis here. However, contrary to our working hypothesis, the effect of comparative eurhythmy distance is not linear, but quadratic. In other words, it is large absolute cED values that decrease the probability of the s-genitive, and not small real values as was hypothesised in section 3.5. Furthermore, the interaction with animacy is not necessary and does not improve model quality, although there is a numeric trend that non-animate possessors exhibit a stronger linear relationship and a reduced quadratic one. We shall investigate this issue more carefully in section 5.
Regarding the random effects ‘corpus file’ and ‘possessor head noun’, we find that both capture notable amounts of variability. There are 345 different corpus files in our data set, and the variance of this factor is 0.77. Two files containing material from the 1819 Morning Observer show the fewest s-genitives, with an intercept adjustment of about –1.45, while a text from the 1928 Times and two from the 1979 Observer strongly prefer s-genitives (log odds of 1.31, 1.21 and 2.0). The possessor head nouns (211 stems and an elsewhere category) exhibit an even greater variance of 1.25. We find that god, people, men and navy appear more often than expected with the of-genitive, while day, yesterday, company and enemy prefer the s-genitive.
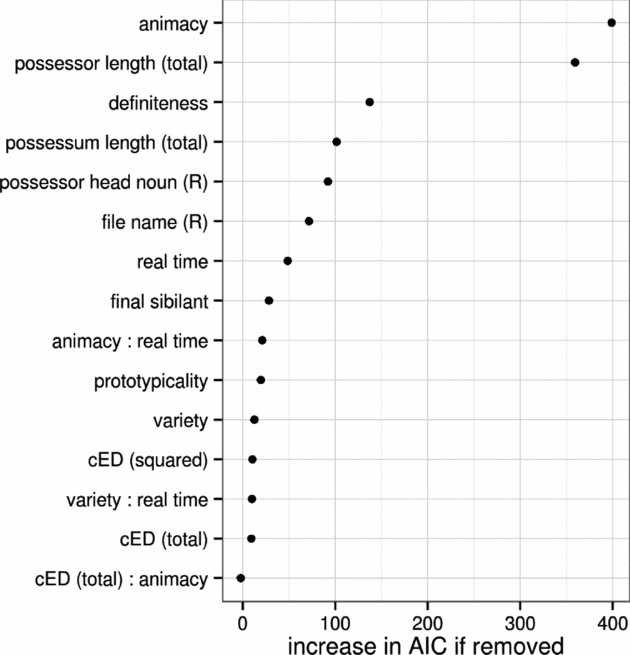
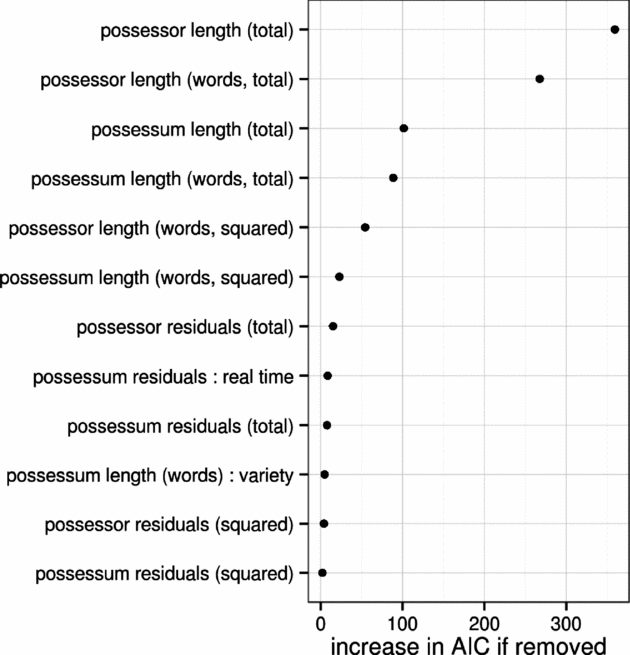
How important are the predictors modelled in the regression analysis explanatorily? To test this, we can remove individual predictors from the model and compare the model fit to the full model. An adequate measure is the increase in the model's AIC value. There are two complications. First, main effects involved in interactions and linear components of quadratic relationships should generally be included in the model (Baayen Reference Baayen2008: 166). Therefore, we can only directly evaluate the quadratic components and the interactions, not the linear components or main effects. In other words, the AIC increase reported below for terms that are involved in an interaction includes the AIC increase resulting from the removal of that interaction. Second, the model in table 2 is rather complex, and contains many terms that need to be investigated. We therefore split the analysis into two parts, and consolidate length by possessor and possessum, so that the total importance of either length is considered at once, i.e. including linear and quadratic components of word-based lengths and character/word residuals as well as any interactions. A more detailed description of the influence of word counts can be found in section 6.
Figure 4 displays the results. It turns out – not entirely unexpectedly – that the most important factor is animacy, closely followed by possessor length. The removal of either leads to an AIC increase of over 350, more than twice that of the third most important factor, definiteness. Possessum length comes in fourth; it is clearly an important predictor, yet pales in comparison to possessor length. The two random effects, filename and possessor head noun, are the fifth and sixth most important predictors. Real time, final sibilancy, the interaction of real time and animacy, and prototypicality are less important predictors. cED-based predictors are very close to zero at about 10 points. The interaction between rhythm and animacy is actually slightly negative, again indicating that this interaction is not warranted statistically in the data set at hand. In short, while rhythm does have an influence on genitive choice, it is a quite weak effect; by contrast, weight is a much more powerful predictor.
Increase in AIC as predictors are removed from the full model. Larger values indicate greater importance. R indicates that a predictor is a random effect; all other predictors are fixed effects.
5 About rhythm
5.1 Genitive frequencies by eurhythmy distance
Recall that according to the Principle of Rhythmic Alternation, speakers or writers presented with two possible genitive constructions should choose the more rhythmic construction over the less rhythmic construction: they should choose the construction which is closest to a perfect alternation of stressed and unstressed syllables. In terms of eurhythmy distance, both constructions are equally rhythmic when cED = 0. The more the comparative eurhythmy distance deviates from zero the more strongly the alternative construction should be preferred. As visualised in (21), the bigger the cED, the more likely the occurrence of an s-genitive; the smaller the cED, the more likely the occurrence of an of-genitive should be.
(21)

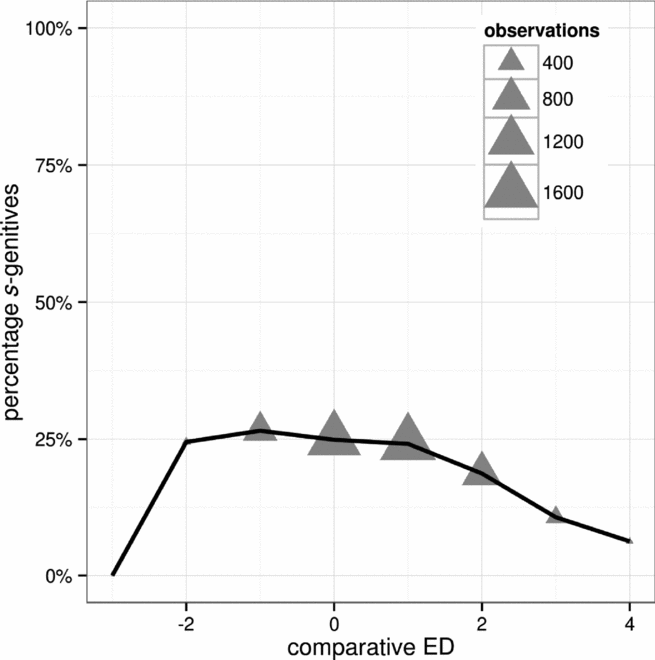
Interestingly, the genitives in our data set do not quite fulfil this expectation: we observe a quadratic effect of rhythm as can be seen from the parabola-shaped curve in figure 5, which plots the proportion of s-genitives compared to of-genitives by comparative eurhythmy distance.
Proportion of s-genitives by comparative eurhythmy distance
We would have expected to see an upward slope, that is, a diagonal line from the bottom left to the top right. But actually, the proportion of s-genitives is largest with cED values ranging from –1 to 0. The curve slopes downwards in the left half of the plot and indicates that cED < –1 disfavours the s-genitive, i.e. smaller cED values favour the of-genitive as expected. However, instead of increasing s-genitive frequencies with large cEDs, we observe that the proportion of s-genitives decreases with increasing cED values, as indicated by the downward slope in the right half of the plot. Note that for cED = 4 we have only 24 observations; for cED = –3 there are only two observations in total in our data set. Contrary to what the Principle of Rhythmic Alternation leads one to expect, large comparative eurhythmy distances do not favour the s-genitive in our data set. In fact, the greater the deviation from cED = 0 in either direction, the more frequently of-genitive constructions occur. In short, constructions with an ideal, alternating rhythm are overall not preferred to less rhythmic constructions.
But then again, the genitive alternation is determined by a variety of factors among which rhythm seems to be only a minor player (see Grafmiller forthcoming; Shih et al. forthcoming, and figure 4). Thus, in the following section the effect of rhythm is discussed in relation to other factors impacting on genitive choice. The discussion will seek to shed light on possible reasons for the theoretically unexpected effect of rhythm.
5.2 The role of rhythm in relation to other factors
Discussing the role of rhythm in genitive choice relative to other factors analysed in the logistic regression model (see table 2 in section 3 for the full model), this section seeks to unravel the causes for the quadratic effect of rhythm. In the regression model, rhythm is represented by comparative eurhythmy distance, and we observe a statistically significant effect of rhythm. Both the linear and quadratic effect of cED are statistically significant (p = 0.004 and p = 0.000), albeit weak in comparison to the other factors (see figure 4 in section 3 for the strength of individual predictors). Furthermore, the observed patterns with regard to rhythm seem to violate the Principle of Rhythmic Alternation. The interactions between cED and possessor animacy – included in the model because previous research found a decisive influence of animacy on rhythm (Grafmiller forthcoming; Shih et al. forthcoming) – are not significant and do not improve the model. Still, we observe an interesting tendency with regard to non-animate possessors. In the following discussion, we make a binary distinction between animate and non-animate possessors, subsuming collective, locative, temporal and inanimate under the latter category.
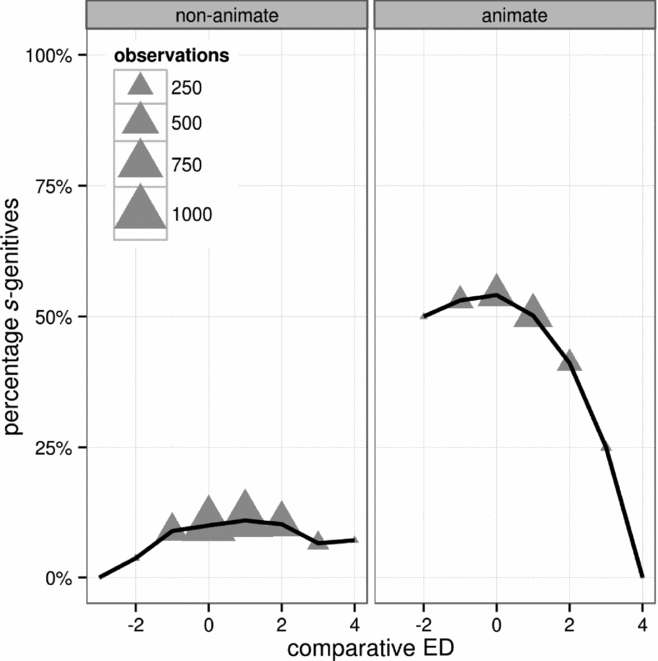
Figure 6 illustrates the relationship between comparative eurhythmy distance and s-genitive rates with animate and non-animate possessors. Let us rehearse how genitives should behave according to the Principle of Rhythmic Alternation: big comparative eurhythmy distances should favour the s-genitive while small comparative eurhythmy distances should favour the of-genitive. This hypothesis is true for genitives with non-animate possessors. We observe a stronger linear relationship and a reduced quadratic one for non-animate possessors (left plot, figure 6) which, with decreasing cED values, favour the rhythmically more optimal of-construction, as in example (22).
Proportion of s-genitives with animate and non-animate possessors by comparative eurhythmy distance
- (22)
(a) A presidential move to investigate [the spread of paperwork]cED = -1in government has been stalled for five months by voluminous White House paperwork. <ARCHER 1975atl2.n8a>
(b) The proximity of the Antilles would facilitate [the success of such an enterprise]cED = -2. <ARCHER 1785gen1.n4b>
They also exhibit a slight trend favouring s-constructions with increasing cED values as indicated by the upwards slope. However, for extreme cED values (cED > 2), the amount of s-genitives decreases to some extent. Example (23) shows s-genitive constructions with non-animate possessors for cED > 0.
- (23)
(a) At the same time, the FAA chief said he is not trying to toally [sic!] emulate the stringent security procedures used by El Al, [Israel's airline]cED=1. <ARCHER 1989lat1.n8a>
(b) [. . .] while £190,000 is devoted to expenses which under ordinary circumstances, would have been paid out of [the current year's revenue]cED=2. <ARCHER 1883tim1.n6b>
(c) [The administration's draft proposal]cED=3 would continue the current division of one-third to the states and two-thirds to cities, counties and other units of local government. <ARCHER 1975atl1.n8a>
(d) The committee, under the chairmanship of the senior Civil Servant in [the Department of Transport's Civil Aviation Policy Directorate]cED=4, will report urgently to Mr Paul Channon [. . .]. <ARCHER 1989tim2.n8b>
Genitives with animate possessors show a very strong quadratic effect (right plot, figure 6): while the s-genitive tends to be favoured for increasing cED values, the effect direction is reversed for cED > 1. Extreme cED values favour of-constructions regardless of rhythmic optimality. This is another way of saying that rhythm only behaves as expected for genitives with animate possessors whose cED is smaller than 1. The examples listed in (24) illustrate how smaller cED values yield s-genitives while large cED values yield of-genitives.
- (24)
(a) That he loved mony better then he did him; yet this will not hinder him from pursuing his Journey to Heydelburg, and from thence to [the Emperors court]cED=0[. . .]. <1654mer2.n2b>
(b) Have I contributed unwittingly to this manic idea of feeding on [other people's reputations]cED=1? <ARCHER 1989lat2.n8a>
(c) My Lord Deputy is made Lord Lieutenant, and I am told we shall have a Parliament called before [the funeral of my Lord Protector]cED=2. <ARCHER 1658econ.x2b>
(d) I send [the shadow of the departed angel]cED=3: hope the likeness is improved. <ARCHER 1800blak.x5b>
(e) and [the destructive consequences of the present war]cED=4 to the Germanic Body, may suddenly furnish him with such Allies; <ARCHER 1762pub1.n4b>
In general, we note that for small absolute cED values the s-genitive is preferred while relatively large absolute cED values are invariably realised as of-constructions; this tendency is largely independent of possessor animacy.
Shih et al. (forthcoming) argue that comparative eurhythmy distance, which combines the two separate measures s-ED and of-ED into a single value, fails to model the divergent interactions of s-ED and of-ED with animacy. We tested this by calculating a model with s-ED and of-ED, and find that Shih et al.'s claim does not hold for our data. While rhythm still exhibits quadratic quirks, there is no effect for s-ED at all. Nevertheless, we observe a partial effect for of-ED with animate possessors which is, however, the very opposite of what previous research established: animate possessors should be less affected by the Principle of Rhythmic Alternation than inanimate possessors (cf. Shih et al. forthcoming). In short, separate measures pose more riddles than they provide answers and are not able to predict rhythm better than cED.
Thus, in the quest for explanations for the quirky quadrature, let us explore interactions with the next most important factors in the model: possessor and possessum weight. Does the observed quadratic pattern of rhythm stem from an interaction with constituent weight?
The first question is how large absolute cED values come about in the first place. In general, large absolute cED values can only occur if one realisation leads to a long string of consecutive unstressed syllables intervening between the stress peaks of the possessor and possessum. This can only happen if the words at the edges of the constituents begin or end with multiple unstressed syllables. For example, the final word of the possessum in (25), cóm.mis.sa.ry ends in three unstressed syllables, which contribute most to the construction's cED value of 4. This is only possible because this word is four syllables long. In this sense, there is a necessary relation between extreme cED values and the length of the words at the constituent edges.
(25) In the Paris Papers, however, which were received yesterday, we found an official letter from [the principal commissary of the marines at bourdeaux]cED=4 [. . .]. <ARCHER 1802joh2.n5b>
The second question, then, is how we can relate this to weight and its effect on genitive choice. Crucially, what matters for eurhythmic distance is the length and stress of the words at the constituent edges. In contrast, weight is usually conceptualised as a characteristic that applies to the whole constituent. Thus, if we find a strong correlation between total constituent length and large cED values, we may suspect a hidden relationship between weight and rhythm (at least in our data set). In other words, if the constituents of genitives with large cED values are overall long, and therefore invariably realised as of-constructions, the strong effect of constituent weight may override the expected pattern based on rhythm. Quantitatively, the correlation between length measured in words and cED is overall rather small. For log possessum length, there is no correlation at all (r = 0.0), and for log possessor length the correlation is very moderate at r = 0.17. This means that the mere fact that a constituent is long does not automatically mean that it constitutes a context where highly unbalanced stress distributions flourish. We do find, however, a stronger relationship for possessum lengths based on the character/word residuals. And intuitively, this makes sense: if a word has many syllables, it should usually be relatively long in characters, and if one word is particularly long, such as the bolded ones in (26), it is somewhat more likely that the whole constituent contains more characters than usual. Still, the correlation is not particularly strong at r = 0.3, and for possessors there is virtually no correlation (r = −0.01).
- (26)
(a) But what was most pleasant was the use Jupiter made of his metamorphosis, for you no sooner saw him under the figure of [Am-phi-trion]multisyllabic possessor [. . .]. <ARCHER 1716lady.x3b>
(b) [. . .] and yesterday in the Morning had his Audience of the most Christian King in the Camp, and is now joyned with the rest of the Lord's Ambassadors and [Ple-ni-po-ten-tia-ries]multisyllabic possessum [. . .]. <ARCHER 1672lon2.n2b>
Therefore, weight cannot really explain the quadratic shape of cED. And if there is no clear correlation, there is no clear reason why the logical connection between rhythm and length should matter. After all, regardless of whether a particularly heavy word is located at the beginning, in the middle, or at the end of a constituent, the total weight of the constituent does not change. We therefore conclude that the observed pattern is not a trivial epiphenomenon of weight.
We move on to consider another possible reason for the quadratic effect of rhythm, namely the nature of its operationalisation. First, eurhythmy distance neglects the difference between stress clashes and lapses. Clashes are allegedly a graver violation of the Principle of Rhythmic Alternation than lapses (Nespor & Vogel Reference Nespor and Vogel1989). This is another way of saying that clashes should behave significantly differently from lapses and should always trigger the rhythmically optimal of-construction. However, this is not the case. Shih et al. (forthcoming) have established that clashes are an unreliable predictor for the genitive alternation. We test this by analysing clashes and lapses separately and find that clashes do not behave differently from lapses – or rhythmically optimal constructions for this matter. In fact, 23.4 per cent of all clashes are realised as s-genitives. In comparison, the percentage of s-genitives in constructions with lapses is 24.3 per cent for lapses with one additional unstressed syllable, and 24.0 per cent for lapses with two additional unstressed syllables. Thus, in our data set clashes hurt the Principle of Rhythmic Alternation no more than lapses, and there is no reason for operationalising them differently. They can also not explain the quadratic effect of rhythm.
Second, eurhythmy distance is based on a binary distinction between stressed and unstressed syllables. While such a distinction has benefits with regard to applicability in corpus analysis and has proven reliable for measuring the influence of rhythm on Present-day English genitive syntax (Grafmiller forthcoming; Shih et al. forthcoming), it is a simplification of the rhythmic reality in English. This is because it neglects ternary patterns of rhythm – patterns of two consecutive unstressed syllables between stress peaks – which are an accepted variant of the binary rhythmic alternation (Selkirk Reference Selkirk1984: 12, see also 19). Thus, a reformulation of the Principle of Rhythmic Alternation (according to Schlüter Reference Schlüter2005) and a measure which allows for ternary patterns might be better suited to model the effect of rhythm in historical genitive data.
Thirdly, our way of establishing eurhythmy distance is a local measure of rhythm which only takes the stress peaks within the possessor and possessum boundaries into account. Rhythm, however, is essentially a factor that stems from the language user's expectation of regularity (Abercrombie Reference Abercrombie1967: 96). This is another way of saying that the rhythmic alternation of stressed and unstressed syllables is to a great extent driven by the expectation that this distribution should continue. For this reason, a global measure of rhythm which extends beyond the boundaries of possessor and possessum might yield more insightful results than the local measure used here.
In summary, the s-genitive is preferred for small comparative eurhythmy distances between –1 and 2 for non-animate possessors, and –1 and 1 for animate possessors. For reasons that await exploration in future research, the of-genitive is invariably preferred for larger absolute cED values, regardless of their sign. We conclude that our way of operationalising the Principle of Rhythmic Alternation does not seem to fit the unconventional data set we study here, because its effect – even though significant – is very weak in comparison to other factors (see figure 4). Although this is not entirely surprising, as rhythm has previously been categorised as a minor player in genitive choice both in spoken, Present-day English (Shih et al. forthcoming) and in written data (Grafmiller forthcoming), many questions remain unanswered. In short, much work is still needed to find an adequate operationalisation of rhythm which sheds light on the puzzling quadratic quirks of this factor.
6 About weight
Let us now turn to weight. We will discuss three topics that were raised earlier: (i) the nature of the effect of length in words on genitive choice; (ii) the degree to which character-based measurements can improve the analysis; and (iii) whether relative measures (such as the log constituent length ratio) are superior to single-constituent measures. These will be covered in turn.
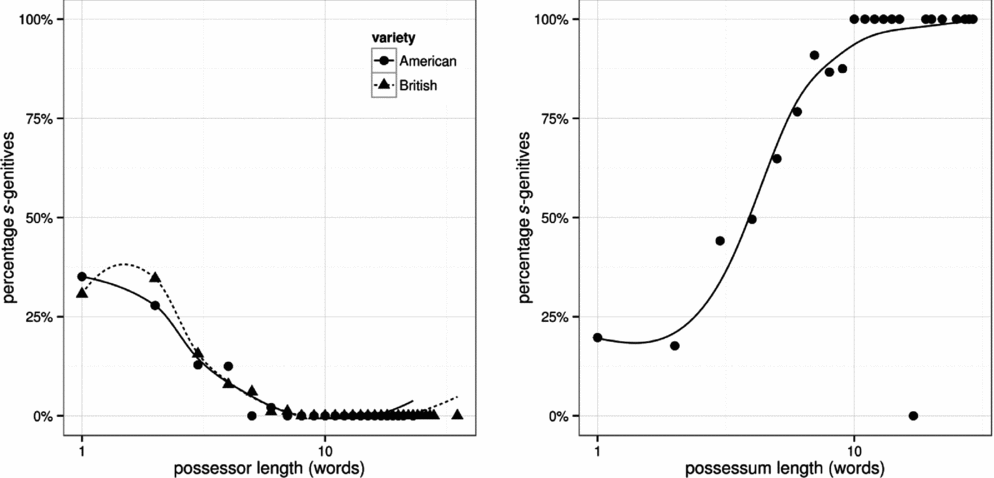
The models in section 3 showed that the effect of both possessum and possessor length were not simply linear, but exhibited a quadratic nature. Furthermore, for possessor length, a marginally significant interaction between variety and length was found, indicating that for British English, the linear component is such that an increase in length is associated with fewer s-genitives than in American English, combined with a higher base frequency for s-genitives. This result is very similar to that reported in Szmrecsanyi et al. (forthcoming) for length in characters, where it was interpreted as a stronger effect of length in British English. In contrast to that study and Wolk et al. (Reference Wolk, Bresnan, Rosenbach and Szmrecsanyi2013), no interaction with real time was found for possessum or possessor length in our analysis. Figure 7 visualises the distributions in our data set. The left plot shows the effect of possessor length; for each length, the absolute proportion of s-genitives in the data is given, and a smoother line highlights the overall trend. The non-linearity is visible in both curves: for short genitives of one to two words in the possessor (about 60 per cent of all observations in the data set), the slope of the trend line is comparably flat, then decreases rapidly until it reaches the lower boundary of zero s-genitives. For short lengths, and especially for lengths of two words, the British line is higher, then decreases more quickly.
S-genitive rates (y-axis) by constituent lengths in words, log scale. Left plot: possessor length (x-axis); data points display average rates per number of words by variety; lines show loess smoother indicating the overall trend. Right plot: possessum length (x-axis); data points display average rates per number of words; lines show GAM smoother indicating the overall trend.
The right-hand plot in figure 7 shows the effect of possessum length. Again, the non-linearity is clearly visible and primarily affects short constituents of one to two words, which constitute 89 per cent of all observations in the data set. The trend line here is perfectly flat, but increases dramatically as possessum length grows. Beginning at possessum lengths of ten words, the of-genitive is virtually absent, with the single exception in (27).
(27) A second Barge also covered with Cloth, in which were six Officers of Arms in their Coats, bearing the Coat of arms in their Coats, bearing the Coat of Arms, Helm and Crest, and Arms, Helm and Crest, and Sword, Target, Gauntlet & Spurs of the Defunct, the Great Benney being placed at the head of the Barge. <ARCHER 1672lon2.n2b>
This distribution is quite similar to figure 1b in Börjars et al. (Reference Börjars, Denison and Scott2013), where the s-genitive rate notably decreases from possessum lengths of one word to possessum lengths of two words, and only begins to rise rapidly for possessums longer than three words. Börjars et al. also do not remove articles from the possessor, which may account for the fact that in our data set the quadrature starts one word earlier. In short, then, both non-linearities tell a similar story: the effect of length is less pronounced for short constituents. It is, however, curious that the previously reported diachronic change of the effect of possessum length fails to replicate. Can constituent length residuals account for this?
Let us begin by stating our working hypothesis about constituent length residuals: constituents that are particularly short in characters given their length in words should be more likely to be placed first. For example, in genitive constructions such as (28) where the possessor phrase is especially short (about three characters shorter than expected given their length in words), the s-genitive should be more likely than in (29), where the possessor is almost six characters longer than expected.
(28) I really gave in because it is true that it rains a lot in the winter and [Max]-3.2 characters's chest isn't too good and a caravan could be tough. <ARCHER 1952rhys.x8b>
(29) The Atlanta (Ga.) Commonwealth of the 28th notices the arrival of [Breckinridge]+6 characters in that city. <ARCHER 1863chi2.n6a>
In a possessor length plot, we would therefore expect to see a diagonal line with a downward slope, and for possessum length a line with an upward slope. There is one complication: extreme residuals can only appear for very long constituents; it is impossible for a single-word possessor to be twenty characters shorter than the average, and very unlikely to be twenty characters longer. With more words, such values can arise if many of these words are particularly short, as in (30), or long, as in (31). In those cases, however, the choice of variant is likely to be determined more strongly by the number of words than by their relative length. Therefore, we split the data into two groups prior to visualisation: constituents of one or two words compared to longer ones.
(30) There were particularly violent clashes at a village near Tulkarm during the funeral of [a boy, aged 14, who died on Saturday in an east Jerusalem hospital from head wounds received in a riot last month]-23.1 characters. <ARCHER 1989tim2.n8b>
(31) In addition to the five exiles authorised on Wednesday to return, his MAJESTY also at the same Council gave his permission for the return of [MM. FOUCHER D’AUBIGNY, ESCHASSERLAUX, THABAUD and LEMAILLAND, Ex-Conventionalists]+29.9 characters. <ARCHER 1819mor2.n5b>
Figure 8 displays the effects of constituent length residuals. The left plot shows possessor length. For short constituents (solid line), the predicted relationship holds: as the possessor phrase, measured in characters, grows longer for a given number of words, the probability of the s-genitive decreases. For longer phrases, the s-genitive rate decreases as one moves away from the average length. This is in line with the working hypothesis: the greater the absolute deviation from the expectation, the more words on average (r = 0.45). This also explains the small, yet reliable quadratic effect of the factor in regression analysis.
S-genitive rates (y-axis) by character residuals; negative values indicate that the constituent is shorter than expected. Data points indicate average by residuals rounded to the nearest character. Left plot shows residuals of possessor length, split into short (1–2 words, solid line) and long (3 or more words, dashed line) possessors. Right plot shows residuals of possessum length, split by length in words (1–2 words vs rest) and by real time (1650–1825 vs 1826–2000). Solid and dashed lines are loess smoothers indicating the overall trend.
For possessum length, regression analysis points to a real-time effect, such that genitive constructions in later periods are better-behaved than earlier ones. The right-hand plot in figure 8 is therefore split into two parts of about equal size, one covering the period between 1650 and 1825, and the other covering the period after that. In the left-hand panel, which depicts the short phrases, we observe that the earlier periods behave contrary to our expectations: relatively short possessums tend to have more s-genitives. In the later period, this trend reverses and the pattern matches our expectations. Long phrases, similar to what we have observed for the possessum, exhibit the fewest s-genitives with residuals around zero. Again, the reason is that absolute residuals are correlated with possessum length in words (r = 0.38).
In summary, for short constituents, longer phrases (in characters) tend to be placed last if the constituent happens to be the possessor, and in the later periods also if it is the possessum. The diachronic change involving character length that was observed in Wolk et al. (Reference Wolk, Bresnan, Rosenbach and Szmrecsanyi2013) therefore seems to stem from the length of individual words, not the number of words.
Does inclusion of the residuals increase model quality? The answer is yes, but only moderately so. Figure 9 shows what happens to weight-related predictors from the full model. As was noted in section 3, possessor length measures in general are very important to model quality, with possessum length being relevant, but less so than possessor length. The same pattern holds for the individual measures, and the hierarchy is as displayed in (32).
Increase in AIC as predictors are removed from the full model, weight-related predictors only. Larger values indicate greater importance.
(32) word lengths (total) >> word lengths2 > residuals (total) and interactions > residuals2
Possessor residuals, the most important factor involving characters, lead to an AIC decrease of about 15.0, squarely in between the effects of prototypicality (19.6) and variety (12.5). How can this be interpreted? As Wolk et al. (Reference Wolk, Bresnan, Rosenbach and Szmrecsanyi2013) report, length in characters is particularly strongly correlated with the number of syllables. If length in characters can be seen as a proxy for the number of syllables, our results suggest that the number of syllables adds information about the realisation choice beyond that of the number of words, and diachronically the influence of the factor seems to increase. The advantage of this measure is that it is easily calculated, whereas the number of syllables can be more difficult to determine, especially for historical texts that contain many rare names. We do not rule out other interpretations – the underlying cause could be any sublexical property, such as segment complexity. Given the rather small influence of character length and the good model fit overall, a principled investigation disentangling such factors is likely to require significantly more than the approximately 5,000 genitive tokens included in this study.
So far, we have restricted our attention to the length of the individual constituents. Let us now turn to a measure that combines possessor and possessum length, the natural logarithm of their ratio. As a single predictor, this is an acceptable measure: it is statistically very reliable and leads to a model that is still quite good. It is, however, much worse than the full model: its AIC is much higher at 2,789, compared to 2,634 for the full model presented before, and the model fit is considerably worse (Dxy = 0.91, accuracy = 90.1 per cent). As we have already seen above, short genitive phrases behave differently from long ones. In the log ratio measure, the genitive constructions in (33) and (34) are treated the same: in both, the possessor is twice as long as the possessum. In the data, however, the two conditions are very different: for possessor lengths of six words or more, only three out of 696 tokens are s-genitives.
(33) [General Brownlow's division]ratio 2 was fortunately enabled to recover the little girl Mary Winchester, who had been stolen by the Looshais from Mr. Sellar's tea plantation, in Cachar, within the British frontier. <ARCHER 1872gla2.n6b>
(34) The official programme for the [stay in Rome of Mr. Neville Chamberlain and Lord Halifax]ratio 2 was issued to-night. <ARCHER 1939man1.n7b>
We can remedy this problem, keeping the log ratio as our base, by including the total length of both constituents combined in the model and allowing the relative length and the total length to interact.Footnote 9 Both the log ratio and the log total length along with their interaction are significant, and yield a marked improvement over the model without these factors (AIC = 2,665, Somer's Dxy = 0.92, accuracy = 91 per cent).
The left-hand plot in figure 10 visualises this interaction. The x-axis shows the log ratio; negative values indicate that the possessor is shorter than the possessum, and positive values that the possessum is shorter than the possessor. The lines show linear regression smoothers indicating the trend of three length classes: 2–3 words, 4–5 words and longer genitives. The solid line indicates the shortest group; here, relative length in words has almost no influence. For medium-length genitives, we find a steep slope, and for long genitives an even steeper one.
S-genitive rates (y-axis) by relative lengths (x-axis). Left plot shows the log ratio of possessor and possessum length in words, split by short (2–3 words), medium (4–5 words) and long genitive constructions. Right plot shows the residuals of regressing the log ratio in characters against the log ratio in words, split by real time and whether the total length in characters is longer or shorter than expected. Solid and dashed lines are linear smoothers indicating the overall trend.
We have left character length out of the discussion of ratios. Similarly to the character length residuals, we can calculate character ratio and total length residuals from the word-based values. In (35), the possessor is one word long and the possessum two, a log ratio of −0.69. In characters, however, the ratio is much more extreme: 3 characters compared to 19, and a log ratio of –1.85. The relationship between both log ratios is generally much closer, which makes the possessum unusually long in characters. The residual in this case is –1.08. Similarly, the total lengths are 3 in words and 22 in characters. This is slightly longer than average, and therefore the log total length residual is 0.15. More on this can be found in section 2.5. Adding these predictors and warranted interactions – both residuals with each other and log ratio with real time – to the model makes it virtually indistinguishable from the individual constituent length-model: its AIC is minimally better at 2,636, and the Somer's Dxy value is essentially the same with a difference of only 0.002 in favour of the individual model. Only concerning predictive accuracy does the full individual constituent model fare notably better, correctly predicting 13 tokens more than the full log ratio model.
(35) Art is [man]possessor's [highest possibility]possessum but it is nevertheless man's highest possibility and without the man the work of art is a vocable. <ARCHER 1951macl.x8a>
The right-hand part of figure 10 visualises the influence of character ratio and total length residuals. Observations are again split into an earlier and a later half, and the character total length residuals are discretised into a group that is shorter than expected based on word counts, and one that is longer. In the later period, both groups have the expected effect: shorter character ratios are associated with more s-genitives, whose frequency decreases as the residuals increase. For the earlier period, this is only true for longer total character lengths; shorter ones show the reverse pattern. This matches the effect concerning individual possessum lengths discussed above.
In summary, there are three key findings about weight. First, short genitives are different from long genitives. For individual lengths, this difference emerged as a quadratic effect, where longer constituents are more strongly affected than shorter ones, matching the quadratic effects reported in Wolk et al. (Reference Wolk, Bresnan, Rosenbach and Szmrecsanyi2013). For relative lengths, it manifested itself through an interaction between relative and total genitive length. This is similar to (but does not completely correspond to) the findings in Börjars et al. (Reference Börjars, Denison and Scott2013), who found that the effect of the length of one constituent depended on the effect of another constituent, such that ‘as the length of possessor increases, the effect of the length of possessum increases as well’ (Börjars et al. Reference Börjars, Denison and Scott2013: 137). In our data, an interaction such as theirs did not, however, reach statistical significance either in addition to or as a replacement of the nonlinear effect. Second, we were able to show that the number of characters has an independent, yet small effect. Rosenbach (Reference Rosenbach2005) notes that, while she found an effect of word length in a post-analysis of experimental data, ‘a systematic study is still missing’ (2005: 632). Our study is not that study, but its results point in the same direction: length in syllables (as measured by characters) has an effect ‘where there is still room, so to speak, to boost the frequency of the s-genitive’ (Rosenbach Reference Rosenbach2005: 632). Further research in the spirit of Shih & Grafmiller (Reference Shih and Grafmiller2011) that takes the differences between short and long genitives into account may shed more light on this issue. Finally, we were able to show that the ratio of the approximated constituent lengths can substitute for the individual lengths, but only if total length is included as well and the two are allowed to interact. Including only the ratio, as in Shih & Grafmiller (Reference Shih and Grafmiller2011), leads to a considerably worse model in the case of our data set.
7 Summary and concluding remarks
Based on an unconventional data set sampling written English from throughout the Late Modern English period, we have put the spotlight on two factors constraining genitive variation (the defence of the commonwealth versus the commonwealth's defence) which have their origin in spoken language: constituent weight (a well-established factor), and rhythm (a newcomer). Our approach to rhythm centres on the evenly distributed alternation of stressed and unstressed syllables, and we noted that although a large body of literature is dedicated to the English genitive alternation and its constraints, little is known about the influence of rhythm as a phonological factor. We thus examined the applicability of the factor to our data set, with a special interest in how important the factor is vis-à-vis other factors. Weight, on the other hand, is a speech-based constraint which presumably arises from online processing and parsing efficiency issues. Weight effects are comparatively well researched, and different operationalisations – ranging from single-constituent and multi-constituent measures to relative length measures – have been discussed in the literature. Yet, do they all have the same effect, or are some measures better than others? And, more importantly, how should such measures be included in statistical models?
In addressing these questions, this study has made two empirical contributions. First, rhythm – operationalised in the spirit of the Principle of Rhythmic Alternation as comparative eurhythmy distance (cED) – plays only a small role in our data, and seems to be an unreliable predictor. Specifically, even though its effect is significant, rhythm hardly improves the model. What is more, we observe a theoretically unexpected, quadratic pattern: small absolute cED values are preferably realised as s-genitives while larger absolute cED values are invariably realised as of-genitives. This means that overall, rhythmically more optimal constructions are not preferred. Furthermore, possessor animacy seems to interfere with the effect of rhythm. With non-animate possessors, cED has the predicted effect, in that rhythmically more optimal constructions are preferred. Shih et al. (forthcoming) and Grafmiller (forthcoming) report a similar effect. With animate possessors the Principle of Rhythmic Alternation only takes effect for very small absolute cED values. We looked into a number of potential reasons for the observed pattern (e.g. correlations between constituent length and cED scores) but did not find a straightforward explanation. Our investigations raise questions as to the adequacy of both the current formulation of the Principle of Rhythmic Alternation and its operationalisation as comparative eurhythmy distance.
Second, our results underline the importance of weight for predicting genitive choice – in terms of explanatory power we saw that in our data set weight is second only to possessor animacy. That said, weight exhibits quirky quadratic effects. We experimented with character-based and word-based counts, and with simple single-constituent versus more complex multi-constituent measures. We found that possessor length and variety interact such that in the British data fewer s-genitives occur as length increases than in the American data. Comparing character-based and word-based single-constituent measures to a multi-constituent measure – relative logarithmic length of possessor and possessum (Shih & Grafmiller Reference Shih and Grafmiller2011) – we concluded that the log ratio as sole weight measure yields comparatively bad model fits. This is because the log ratio does not distinguish between short and long phrases, which behave differently. However, a combination of log ratio and total length of possessor and possessum as interacting predictors improves the model significantly.
In all, both rhythm and weight show theoretically unexpected quadratic effects in our data set: rhythmically more well-behaved s-genitives are not necessarily preferred over of-genitives, and short constituents exhibit odd weight effects. While rhythm is only a minor player whose quirky quadratures require follow-up research, we have seen that weight is a very crucial factor which, however, poses measurement and modelling issues.