

Introduction
It is essential to understand the complete impact of a disaster in order to provide adequate relief.1 If an event’s size is significant, it is crucial to have such information available, but it is challenging to assess the situation correctly and quickly. Therefore, relief workers usually do not attempt to fully enumerate the affected population and rather seek alternative approaches.Reference Korteweg, Bokhoven and Yzermans2
Researchers have experimented with various methods to measure the overall impact of disasters. Mongin et al. estimated Hurricane Sandy’s (2012) damage in the United States by hospital admission records gathered from a public database, which captured 95% of hospital discharges in the area.Reference Mongin, Baron and Schwarts3 However, such an approach may not be suitable for quick estimation, with a “lag of 1–2 years” and incomplete coverage of databases in the country. Meanwhile, Lee et al. conducted another study in post-tsunami Aceh, Indonesia, employing a cross-sectional survey design.Reference Lee, Doocy and Kirsch4 The study undoubtedly renewed the idea of having a comprehensive assessment in the early phases of the disaster, but it required specialized personnel and training.
Concerning Japan, a disaster-prone country, it has become common to prioritize vulnerable populations in search and rescue in an emergency, based on previous studies that highlighted the specific needs of vulnerable populations.Reference Ochi, Murray and Hodgson5,Reference Arii6 It is also a legal obligation of the local government to list vulnerable populations in their community as part of their contingency plans.7,8 Each local administrative office defines vulnerability in disasters based on the information available in pre-disaster times, such as the level of care for disability, elderly care insurance coverage, and intractable disease patient registration. However, the priority list may not be sufficiently helpful, as the local authorities usually do not share this information with the community until the very last minute of evacuation, for privacy protection.Reference Takahashi and Ogihara9 Additionally, the list may not reflect actual conditions if the authorities do not regularly update the information on conditions because few patients’ conditions are stable, and changes may occur at any time.
Moreover, the approaches mentioned above compromise on covering the entire population to provide more efficient relief. Although such strategies are helpful, they exclude a vast majority of the affected population who do not complain or do not have a significant history of health problems but are certainly in need of assistance.
Further, permanent residents are usually not the only population affected by a disaster. There are visitors or tourists who, by chance, become involved in the accident. If a visitor is missing, injured, or sick, that person may not be immediately sought and rescued because of little information available to authorities aside from pre-disaster information.
The Great East Japan earthquake disaster (GEJED) with GLIDE number EQ-2011-00002810 hit Japan’s pacific coast on March 11, 2011, killing over 19 000 and leaving 2500 persons missing.11 The disaster reconstruction agency reported 3700 disaster-related indirect deaths by the end of March 2020.12 Approximately 30% of the 1632 indirect deaths reported by August 2012 were caused by “physical and mental conditions after spending some time at shelters,” and 13 cases were suicides. Further analysis of 1263 cases in the high mortality area suggested that 10% of the cases had no previous history of illnesses, and 30% had an unknown past health history. The fact that the health history of 40% of indirect death cases was not recognized suggests that either some might have pretended to be in good health or people did not care about or notice their heath condition until they died.
This study identified the challenges of measuring the disaster-affected population’s health conditions by reviewing reports of personal damages published by governmental agencies in the 9 years after the GEJED. The study then further discusses the significance of approaches by which to collect individual data directly from the affected population, not only from a specific group of people, but also from most people considered to be in good health but who potentially need help.
Methods
The study reviewed 159 situation reports, from the second to the 160th (as the first report is no longer available), published by the Fire and Disaster Management Agency (FDMA) of the Ministry of Internal Affairs and Communication (MIC). There are many other official reports published by the government. The National Police Agency (NPA) report statistics on personal damages, consisting of original data, collected through their postmortem duties and their reception of reports of missing persons. Both NPA and FDMA statistics were similar, as they coordinate with each other.13 Likewise, the self-defense force (SDF) deployed its search and rescue units until March 19, 2011, namely for the first 9 days of the emergency phase. They issued their reports, but only a limited number of reports is available.
A series of FDMA situation reports published from March 11, 2011, to March 10, 2020, with the title of “平成23年(2011年)東北地方太平洋沖地震 (東日本大震災)について: Report on 2011 Tohoku-Pacific Ocean Earthquake (GEJED)” or variations of those were selected, as they were considered more appropriate for the study purpose. The FDMA situation reports cover comprehensive information collected by local governments and are available from the early disaster response stages. While many other FDMA reports and papers were published, this specific series was selected to provide the necessary information for this study.
The number of deaths, missing persons, and injured persons (severe, mild) was analyzed based on the time from the disaster, gross mortality (deaths per 100 000 people), and total morbidity (injuries per 100 000 people) calculated from the population census data in 2010 (the year before the disaster). The study reviewed the reports of disaster-related indirect deaths (Saigai Kanren Shi) published by the Japanese disaster recovery agency to support our findings.12 A value of 18 549 was obtained by subtracting non-direct mortality (n = 3739; September 30, 2019) from the sum of the latest number of dead and missing persons (n = 22 288; March 10, 2020), assuming that the value represents the actual direct mortality due to the disaster. Then, an evaluation was made of how soon the true number of casualties could have been estimated using the FDMA statistics.
The data processing and statistical analysis used Microsoft Excel and Stata/IC 10.1 (College Station, TX) to conduct Poisson regressions, tests of 2 proportions, and logistic regressions. The study adopted the following logistic regression models to estimate the odds of reporting injuries.
 $$Log (odds (Y=1)) = \beta_{0}+ \beta_{1}X_{1}\ or Log (odds (Y=1)) = \beta_{0}+ \beta_{1} X_{1}+\beta_{2}X_{2}$$
Where Y = status of reporting injuries; 1 = failed, 0 = reported
X1 = deaths per 100 000 populations reported in the 2010 census14
X2 = evacuation orders; 1 = given, 0 = not given
The variables were selected manually from the available data to provide the best fit.
Results
As of July 1, 2020, the FDMA had published 159 situation reports on its website.15 The earliest available is the second report,16 dated March 11, 2011, at 15:30 Japan Standard Time (JST), 44 minutes after the major earthquake. The latest is the 160th report,17 published on March 10, 2020.
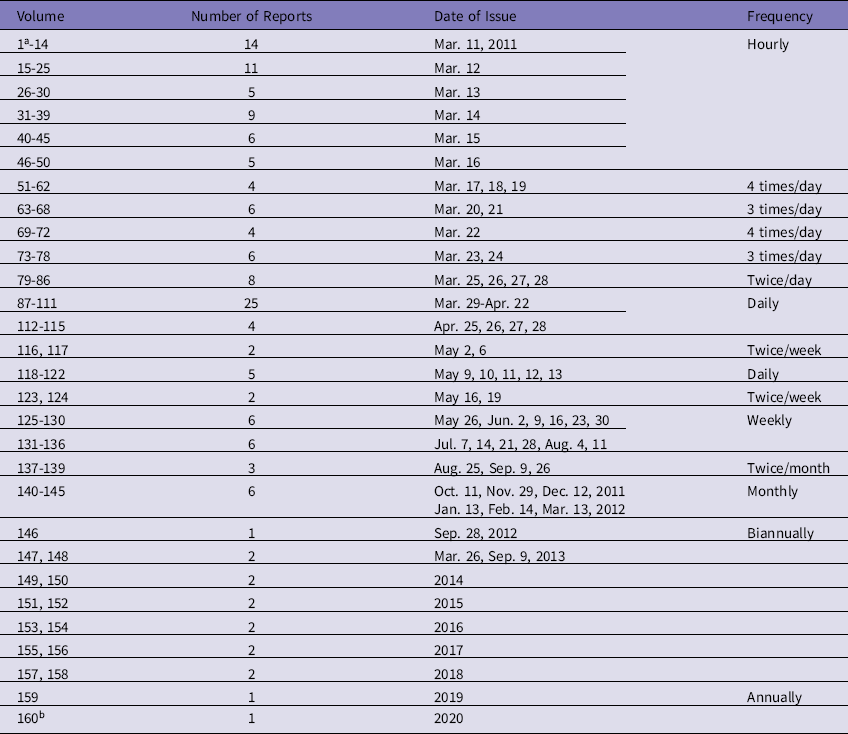
FDMA released an update every half an hour for the first 5 hours and every hour until the end of the day. There were 14 issues of the report on Day 1 (1–14; March 11, 2011), followed by 11 on the following day (15–25; March 12, 2011). The FDMA issued updates daily until the end of April 2011 (Table 1).
List of FDMA situation reports in chronological order (n = 160)

Notes:
a Report 1 is currently not available.
b Report 160 is the most recent.
Overview of Personal Damages in the Study Period (March 2011 to March 2020)
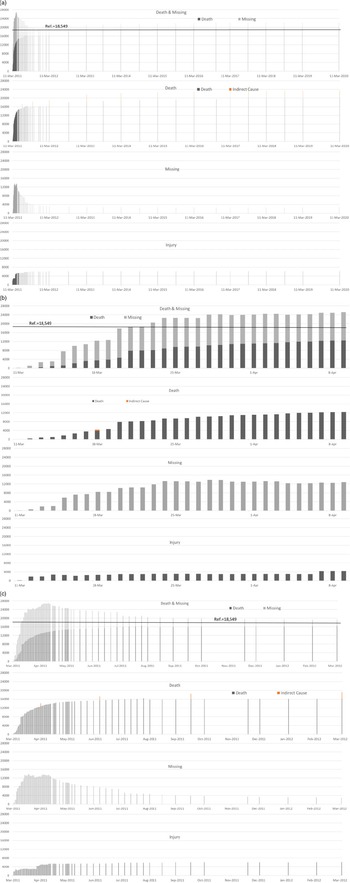
There were 14 240 aftershocks with a Japanese scale of 1 or greater for 9 years,18 and the reported personal losses included the victims of those aftershocks. Some fluctuations were observed, particularly in the number of missing persons within 1 year of the disaster. The statistics became stable in and after 2012 (1 year after the first earthquake and series of tsunamis). There has been no significant error reported in the past 9 years (Figure 1a).
Number of deaths, missing persons, and injuries by time. (a) Number of personal damages for entire period (March 2011–March 2020). (b) Number of personal damages for the first 30 days (March 11, 2011–April 9, 2011). (c) Number of personal damages for the first year (March 11, 2011–March 13, 2012).

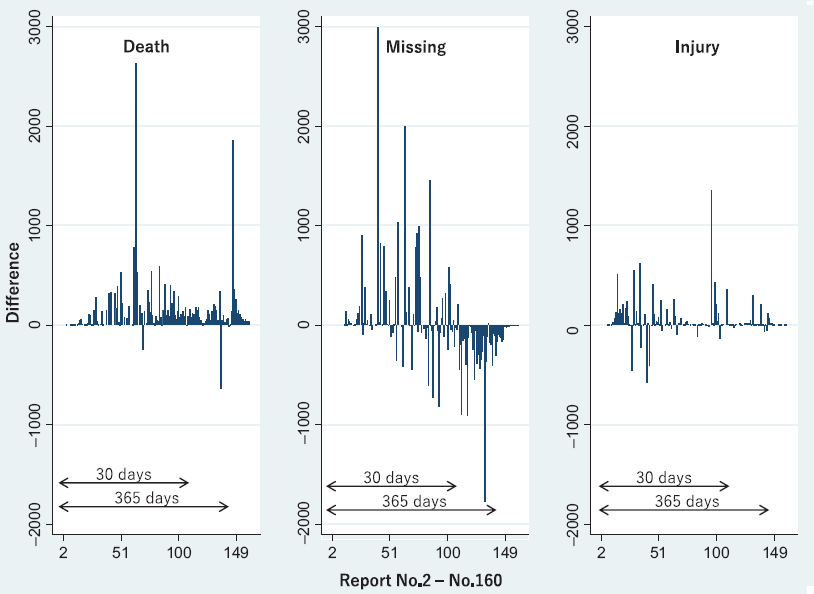
The incidence of deaths increased by 27% daily in the first 2 weeks of the disaster (incident rate ratio [IRR] = 1.27, P < 0.001). The inflation slowed down after a final spike in September 2012 (IRR = 1.00, P < 0.001). There was a spike in the number of missing persons in the first 30 days (IRR = 1.07, P < 0.001), but the number dropped by Day 30 and continued to decrease (IRR = 0.99, P < 0.001). There was a significant increase in injuries in the initial month (IRR = 1.05, P < 0.001). Later, the increase slowed down significantly (IRR = 1.00, P < 0.001; Figure 2).
Differences in the number of deaths, missing persons, and injuries from the previous report.

Personal Damages in the First Month
The fifth situation report, published on March 11, 2011, at 17:00 JST, 2 hours and 14 minutes after the disaster, reported the first 5 deaths.19 The number of deaths continued to increase as the search and rescue progressed. The 13th issue reported the first 2 missing cases at 22:00 JST, 7 hours and 14 minutes after the disaster.20
The sum of deaths and missing persons reached the reference value between March 22 and 23, 2011, Day 12, but continued to increase until the latest report in 2020. The number of missing cases exceeded the number of deaths in the subsequent 80+ papers and continued to increase beyond the death toll for over 40 days until the death toll matched the figure (see Figure 1b).
The sum of deaths and missing persons reached the estimated total direct deaths (Ref. = 18 549) on Day 11 and Day 13 of the disaster (Reports 68 and 73, n = 18 585 and n = 19 054, March 21 and 23, 2011, respectively).21,22 This represents the time taken to cross the threshold, and the value has not subsequently decreased. The value later spiked to 27 020 (Report 109, April 20, 2011).23 It is now slowly increasing again as the number of deaths increases.
The number of missing people was higher than the number of deaths for 1 month. The death toll caught up in 1 month as the search operation progressed. The number of injuries was also higher than the number of deaths in the initial 4 days until the 42nd report on March 15, 2011,24 and then the deaths overtook injuries by the 43rd report,25 which was issued approximately 4 hours later. The cumulative number of injuries reduced by 400, probably due to a re-examination of figures. The number of injuries continued to increase, but slowly.
There were a few severely injured persons with no vital signs reported in the ninth report (approximately 5 hours after the disaster),26 and this figure did not increase over time. The number of injured persons in the 12th to 140th reports (published from March 11 to October 11, 2011)27,28 was unconfirmed, with the possibility of an update noted. The following paper, which became a monthly report, removed the note (141st issue on November 29, 2011).29
Personal Damage in the First Year
The sum of deaths and missing persons increased in 1 month (April 20, 2011; max. = 27 020) and suddenly decreased as the number of missing persons dropped by more than 50% (see Figure 1c).
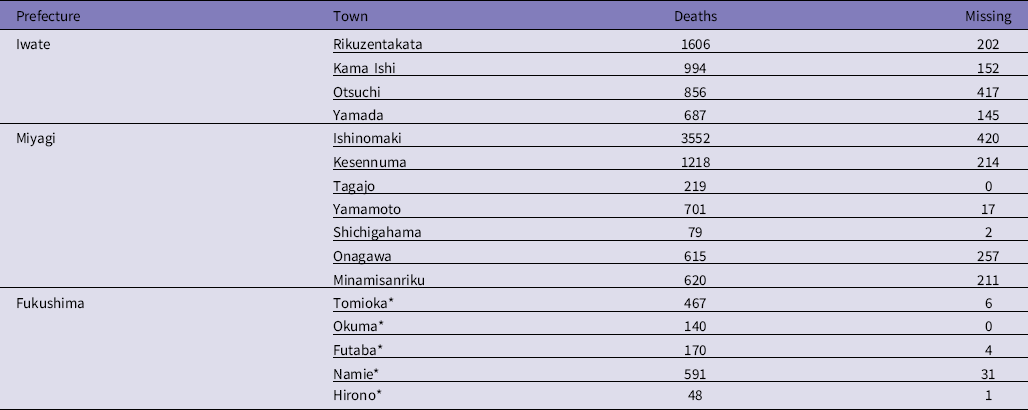
The number of injuries was minimal compared with the number of deaths, particularly in the towns that experienced extreme damage and high mortalities: Miyagi, Iwate, and Fukushima prefectures (Table 2). The odds of failure to report injuries increased by 4.4 times per unit increase in mortality (P < 0.001) and 10.4 times among towns given the evacuation directive for the nuclear accident,30 after adjusting for the number of deaths (P = 0.01).
Towns that failed to report the number of injuries and numbers of actual deaths and missing persons in those towns (as of March 2020)

Note: *Towns within 50-km range of the Fukushima-1 Daiichi Nuclear Power Plant.
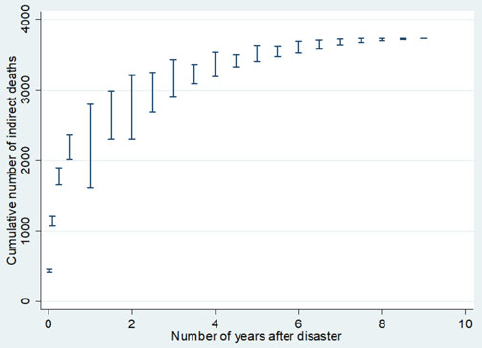
The Reconstruction Agency of the Cabinet Office began reporting the number of indirect deaths every 6 months from April 2012. The office continues to update the figure based on reports from related agencies. The number of indirect deaths has varied over time; for example, the number of non-direct deaths from March 2011 to March 2012 (first year) ranged from 1618 to 2802. The value reported in the first report (1618; April 27, 2012) accounted for 58% of the value indicated in the latest statistics (2802; December 27, 2019), which suggests that the agency initially had available only 58% of the full information. The number increased with time because it shows an accumulated number of deaths at the time of release (Figure 3).
The range of reported numbers of indirect deaths (max-min).

Discussion
Was There a Delay in Reporting?
There is little evidence that suggests there existed a delay in reporting. FDMA reports appeared to be timely, as they sometimes presented information without details, which indicates that they published as frequently as possible rather than waiting for such details to become available. However, the number of indirect deaths suggests that the current reporting system’s limitations reside not in the consolidation or publication of reports but in the potential delay or underreporting of information from the field.
When Was the Earliest Possible Timing for Estimating the Scale of Personal Damages?
The sum of deaths and missing persons reached the estimated total direct casualties (Ref.) only on Day 11 (Report 67 or 68, n = 18531 or n = 18585, March 21, 2011). However, it was technically impossible to predict the scale of personal damage because the value continued to increase far beyond the threshold. The second possible opportunity to predict total direct casualties was at approximately Days 300–400, when the number of missing persons became stable and before indirect deaths started to increase.
Under the assumption that there were no other causes of death other than the disaster, the number of missing persons reduced as the number of deaths increased (the number of discoveries of human remains). However, while the number of discovered deaths increased, the number of missing persons did not decrease at the same rate. Although there were thousands of aftershocks, including 11 earthquakes over M7.0 on the Richter scale,18 there were few casualties. Therefore, it is likely that there was another factor underlying the increased number of deaths, and disaster-related indirect deaths are likely responsible. The disaster-related indirect deaths of survivors appeared to have caused a prolonged increase in mortality and made personal damage prediction more difficult.
Lack of Information
To reduce the number of indirect deaths and effectively use health professionals’ efforts, it is necessary to know the health status of persons affected by a disaster. According to the reconstruction agency, among the 1263 disaster-related deaths observed in the first year of the disaster, 1223 (96.8%) appeared to be caused by physical or mental fatigue or stress.12 Although little is known about the factors that cause indirect deaths, data on the affected population’s mental health conditions, for example, will be necessary as some indirect deaths were suicide cases. However, information on the affected population’s mental health status is usually unavailable, as the current system does not collect this information routinely. If one could assess the general health status of the affected population, some of these deaths could have been prevented.
Likewise, the current public system collects limited information on most people’s health status, as injury is not a required field when applying for public financial aid for disaster victims under the Basic Act for Disaster Management. The Japanese culture also prevents people from complaining about their health conditions, as many Japanese people share social values of patience, keeping silent, and sacrificing themselves to save others. Therefore, collecting health information is proposed for all affected populations, including those undocumented persons who do not make health-related claims, and who are therefore considered in good health by default.
Are Data Reliable?
Overestimation of Missing Persons
An excess of missing persons for 1 month after the disaster was detected. There are 2 primary reasons: (1) Persons were dead but they had not been confirmed, or (2) persons were alive, but they failed to contact family due to confusion. Both reasons were likely responsible for the early spike in the number of missing persons. According to the NPA statistics, the body identification rate was low (42.3% of 1988 bodies in the first 3 days).31 Their intensive efforts improved capacity in 1 month (83.6% of 13 051 dead bodies), but it required months to achieve identification of over 93% of bodies. Miscommunication is more likely responsible for the first increase in missing persons because it significantly decreased after 1 month. A joint operation among agencies for verification found a large number of double counts. Additionally, the closure of some shelters and the opening of temporary housing started, which increased the chances of reuniting separated families.
Underestimation of Injuries
The number of reported injuries was much smaller than the number of deaths. A possible explanation for the reduced number of injured persons is either high fatality rates or underreporting of injuries. The impact of earthquakes and tsunamis was extreme, and few people were able to survive. Further, some of the affected towns failed to report injuries, particularly among severely affected cities with higher mortalities or cities around the nuclear power plant where a large-scale evacuation was necessary. Some information suggested a failure to record and report injuries due to the severity of the chaos or damage. Although some who required health care were among the undocumented population, reporting injuries has no standardized format and is not a required field under the Basic Act on Disaster Management.8 Therefore, underestimation is more likely to cause a reduced number of reported injuries, although a definite conclusion cannot be reached in this regard. Further study is necessary to verify the causes of the reduced number of reports.
What Is the Next Step?
To enable early estimation of total casualties in disasters, it is necessary to know the excess number of missing persons and indirect deaths that cause inflation of casualty estimates.
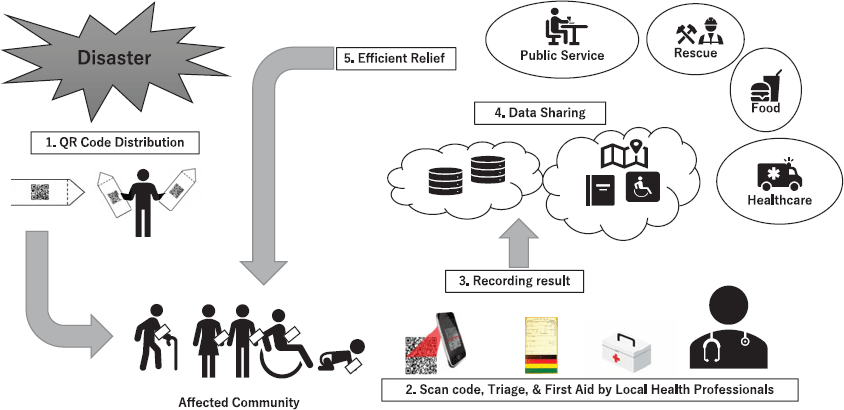
The University of Kochi’s team, in collaboration with the Kochi University of Technology, proposed a novel health assessment system (Figure 4) named Community Oriented Approaches for Comprehensive Healthcare in Emergency Situations (COACHES). It collects individual health data anonymously and records such data in a cloud-based database. The system runs on any personal mobile device (iPhone, iPad, Android) by scanning a personal identification code (QR code), distributed to every person in the area at multiple posts during a disaster. The code is the only item used to identify an individual. The system does not require any prior training or application downloads, as this system’s intended use will be in unpredictable emergencies.
Flow of community oriented approaches for comprehensive health care in emergency settings (COACHES).

It is expected that residents with qualifications in health care, such as nurses, will run this system as volunteers, with the idea that they are ready to work during an evacuation. They do not need extra training because they have the necessary professional skills and knowledge and local knowledge (such as where the people live, names of places, or local languages) to minimize the lag in the wait for external relief. The idea is that someone first checks their family’s health status then proceeds to their neighbors and produces as many records as possible. If the assessments and data collection occur in multiple places, the system will eventually cover the entire affected population. By standardizing each volunteer’s assessment, the cloud-based database will provide helpful comprehensive information. External relief persons can take over the task as soon as they arrive so that local volunteers can return to their homes and families for reconstruction.
The data recorded in the cloud database would be shared among relief workers, health workers, and government officials to improve the efficacy, quality, and coverage of relief activities. The system requires a strict verification process to connect its database with any personal information other than a unique QR code for individuals. The details of the system will be discussed in future correspondence.
Conclusion
The study’s findings depict how challenging it is to collect reliable public health data in times of disaster. A significant delay in reporting was not reported, but there was an overestimation of missing persons and possible underreporting of injuries. These findings explain the limitations of existing approaches to health assessment in extreme emergencies. Therefore, early and continuous evaluation of the whole affected population’s health conditions is necessary to reduce preventable deaths from disaster-related factors. Then, comprehensive approaches that enable reliable health assessment and provision of records of the entire community in emergencies are proposed, such as COACHES, to achieve the concept of UNSDGs, “Leaving no one behind.”
Supplementary material
To view supplementary material for this article, please visit https://doi.org/10.1017/dmp.2021.144
Funding Statement
The work was supported by JSPS KAKENHI Grant Number JP20K11132 and the University of Kochi Strategic Research Promotion Project (R1-2 Theme3) given to MK. No potential COI to disclose.
Conflict(s) of Interest
The authors declared no potential conflicts of interest with respect to the research, authorship, and/or publication of this paper.