INTRODUCTION
Multiple sclerosis (MS) is a progressive neurological disorder that leads to reduced or fragmented cortical and subcortical neural networks within the central nervous system (CNS, DeLuca, Yates, Beale, & Morrow, Reference DeLuca, Yates, Beale and Morrow2015). Widespread CNS involvement in MS causes a range of motor and non-motor disturbances that may co-occur or occur in isolation, including speech execution (dysarthria) and cognitive deficits. Dysarthria occurs in approximately 45–50% of individuals with MS (Noffs et al., Reference Noffs, Perera, Kolbe, Shanahan, Boonstra, Evans, Butzkueven and Vogel2018; Yorkston, Beukelman, Strand, & Hakel., Reference Yorkston, Beukelman, Strand and Hakel2010). Dysarthria severity is quantified using functional communication measures including auditory-perceptual judgments of speech intelligibility (Mackenzie & Green, Reference Mackenzie and Green2009). The perceptual construct of Speech Severity, defined as the overall naturalness and melody of speech, is an alternative measure of functional communication for individuals with mild dysarthria for whom intelligibility is not reduced (Sussman & Tjaden, Reference Sussman and Tjaden2012). Overall dysarthria severity is positively associated with severity of neurologic involvement, but not age or disease duration (Duffy, Reference Duffy2013). Upwards of 70% of individuals with MS experience cognitive impairment in the domains of memory, reasoning, processing speed, attention, concentration, and executive function (Benedict & Zivadinov, Reference Benedict and Zivadinov2011). Careful evaluation of cognitive function is necessary, as cognitive impairment may not correlate with other clinical symptoms (Amato, Ponziani, Siracusa, & Sorbi, Reference Amato, Ponziani, Siracusa and Sorbi2001).
Cognitive impairment or dysarthria and their comorbidity can result in spoken communication problems placing persons with MS at risk for restricted participation in common social roles including work and leisure activities (Yorkston et al., Reference Yorkston, Klasner, Bowen, Ehde, Gibbons, Johnson and Kraft2003). Cognitive impairment may be overestimated in persons with MS experiencing slowed speech due to dysarthria when timed assessments require a verbal response (Smith & Arnett, Reference Smith and Arnett2007). Because cognitive deficits may also contribute to slower speech rates (Duffy, Reference Duffy2013), the contribution of dysarthria to slowed speech may be overestimated in MS for those experiencing dysarthria and cognitive deficits. However, studies investigating dysarthria in MS rarely include a rigorous assessment of cognitive abilities and instead rely on screening tools (Hartelius, Runmarker, & Andersen, & Nord, Reference Hartelius, Runmarker, Andersen and Nord2000; Rosen, Goozee, & Murdoch, Reference Rosen, Goozée and Murdoch2008; Tjaden & Wilding, Reference Tjaden and Wilding2004). Although comorbid cognitive deficits and dysarthria may have a greater impact on functional communication than either impairment in isolation, the deleterious effects of comorbid dysarthria and cognitive impairment in MS on spoken communication are just beginning to be understood (Feenaughty, Tjaden, Weinstock-Guttman, & Benedict, Reference Feenaughty, Tjaden, Weinstock-Guttman and Benedict2018).
Understanding how cognitive impairment or the combination of dysarthria and cognitive impairment in MS impacts spoken communication is clinically and theoretically important. Effective clinical management requires that the overall health condition of the person with MS must be factored into treatment decisions. Dysarthria management that overlooks cognitive mechanisms supporting communication and a person’s ability to acquire new strategies may cause widely disparate responses to therapy and success in life activities. Theoretically, investigating the speech production characteristics and conceivable perceptual consequences caused by impaired cognitive and speech motor processes may advance understanding of the complex interactions between cognitive, linguistic, and motor processes theorized to be crucial for speech production and to ultimately enhance clinical management of MS (Hickok & Poeppel, Reference Hickok and Poeppel2007; Levelt, Roelofs, & Meyer, Reference Levelt, Roelofs and Meyer1999).
We conducted two preliminary studies to begin to evaluate the separate and combined effects of dysarthria and cognitive impairment in MS. Objective measures of speech timing are appealing measures to investigate this topic for several reasons. First, speakers with dysarthria secondary to MS frequently have rate abnormalities that may manifest in articulation and pause characteristics (Hartelius et al., Reference Hartelius, Nord and Buder1995; Rosen et al., Reference Rosen, Goozée and Murdoch2008; Tjaden & Wilding, Reference Tjaden and Wilding2011). Speech timing measures also may be sensitive to cognitive factors. Healthy speakers use longer pauses and/or slowed articulation rate when memory or information processing demands are high (Dromey, Boyce, & Channell, Reference Dromey, Boyce and Channell2014). Rodgers et al. (Reference Rodgers, Tjaden, Feenaughty, Weinstock-Guttman and Benedict2013) therefore investigated cognitive predictors of speech and articulation rate in two connected speech tasks (reading aloud, spontaneous speech) obtained from 50 individuals with MS and 23 healthy talkers. The results suggested that cognitive ability may be an important factor in speech motor performance in MS. However, Rodgers et al. (Reference Rodgers, Tjaden, Feenaughty, Weinstock-Guttman and Benedict2013) only investigated a subset of speech timing measures (speech and articulation rates) and did not examine pause behaviors. Feenaughty et al. (Reference Feenaughty, Tjaden, Benedict and Weinstock-Guttman2013) expanded upon Rodgers et al. (Reference Rodgers, Tjaden, Feenaughty, Weinstock-Guttman and Benedict2013) to further examine cognitive impairment in relation to speech and articulatory rates as well as pause measures in the same speech tasks. Twenty individuals with MS and 10 healthy talkers from the larger Rodgers et al. (Reference Rodgers, Tjaden, Feenaughty, Weinstock-Guttman and Benedict2013) speaker database were studied. Speakers with MS were assigned to high- and low-performance groups based on cognitive tests of executive function and processing efficiency. Thus, in contrast to Rodgers et al. (Reference Rodgers, Tjaden, Feenaughty, Weinstock-Guttman and Benedict2013) where cognitive performance was treated as a continuous variable, cognitive performance in Feenaughty et al. (Reference Feenaughty, Tjaden, Benedict and Weinstock-Guttman2013) was treated as a discrete or between-groups variable. Pause characteristics were most sensitive to cognitive impairment in MS. The low MS group tended to have a greater difference in mean silent pause duration for the two speech tasks, with longer pauses for spontaneous speech. One interpretation of this finding is that pause lengthening provides the speaker with more time for cognitive–linguistic planning and formulation to overcome cognitive limitations. Interpretation of the results was complicated by the presence of dysarthria characteristics for speakers comprising the low MS group, but not the high MS group. It is also unclear if the cognitive variables predicting speech timing in Rodgers et al. (Reference Rodgers, Tjaden, Feenaughty, Weinstock-Guttman and Benedict2013) generalize to a new cohort of MS speakers.
The current study builds upon and extends these prior studies in several important ways. First, a new cohort of speakers separate from those reported in Rodgers et al. (Reference Rodgers, Tjaden, Feenaughty, Weinstock-Guttman and Benedict2013) and Feenaughty et al. (Reference Feenaughty, Tjaden, Benedict and Weinstock-Guttman2013) was recruited for inclusion. The present study also expanded on our prior studies by obtaining a clinical evaluation of dysarthria. Additionally, the present study included a comorbid speaker group (dysarthria and cognitive impairment) as well as speaker groups with only dysarthria or cognitive impairment to permit the study of speech and cognitive variables in MS that may help to explain listeners’ perceived severity of speech samples. Four operationally defined speaker groups with MS were studied: (1) MS with cognitive impairment (MSCI), (2) MS with clinically diagnosed dysarthria and intact cognition (MSDYS), (3) MS with co-occurring cognitive impairment and dysarthria (MSDYS + CI), and (4) MS without dysarthria or cognitive impairment (MS). Healthy controls were studied for comparison (CON). Finally, we considered variables other than cognitive and speech skills in explaining perceived speech severity in MS. Using self-report tools to index speech severity, Yorkston et al. (Reference Yorkston, Klasner, Bowen, Ehde, Gibbons, Johnson and Kraft2003) revealed that persons with MS with moderate to severe speech problems tend to be older and report symptoms of fatigue (84%) and depression (71%) compared to persons with mild speech problems. Measures of speech severity thus may be complicated by cognitive factors, fatigue, and affective symptoms that may exacerbate typical age-related speech decrements in voice, rate, loudness, and fluency (Yorkston et al., Reference Yorkston, Beukelman, Strand and Hakel2010). We therefore evaluated the relative contribution of age, fatigue, depression, and cognitive impairment to perceived speech severity in individuals with MS.
Based on prior dysarthria studies and research relating impaired cognitive and speech motor processes (Feenaughty et al., Reference Feenaughty, Tjaden, Benedict and Weinstock-Guttman2013; Lowit, Brendal, Dobinson, & Howell, Reference Lowit, Brendel, Dobinson and Howell2006; Rodgers et al., Reference Rodgers, Tjaden, Feenaughty, Weinstock-Guttman and Benedict2013), it was hypothesized that the MS and CON groups would not differ on speech timing measures. Further, the MSCI, MSDYS, and MSDYS + CI groups would differ from the MS and CON groups on speech timing measures, but the MSDYS + CI group would have the slowest speech timing, as indicated by reduced speech and articulation rates and longer, more frequent silent pauses. As the construct of Speech Severity may be sensitive to dysarthria and cognitive deficits (Feenaughty et al., Reference Feenaughty, Tjaden, Weinstock-Guttman and Benedict2018), it was hypothesized that perceived speech severity would differ for the MSDYS + CI, MSDYS, and MSCI groups relative to the MS and CON groups. Finally, exploratory regression analyses examined cognitive and biopsychosocial variables contributing to perceived speech severity (Yorkston et al., Reference Yorkston, Beukelman, Strand and Hakel2010).
METHOD
Functional communication measures for all speakers and groups of interest to the current study were reported in a previous paper (Feenaughty et al., Reference Feenaughty, Tjaden, Weinstock-Guttman and Benedict2018). Biographical information, dysarthria diagnosis, cognitive testing, and procedures are only briefly described below. Readers are referred to Feenaughty et al. (Reference Feenaughty, Tjaden, Weinstock-Guttman and Benedict2018) for a complete account. The following methodological detail refers to the experimental measures for the speech task in the present study that have not been previously reported.
Participants
Forty-eight individuals reporting a diagnosis of MS (16 males, 32 females) and 12 sex-matched healthy talkers (4 males, 8 females) were studied. Participants with MS were primarily recruited from MS support groups and with the assistance of a board-certified neuropsychologist. For most participants, the diagnostic criteria of MS followed Polman et al. (Reference Polman, Reingold, Edan, Filippi, Hartung, Kappos and Sandberg-Wollheim2005). Healthy talkers were recruited using flyers posted at the University at Buffalo. The mean age and years of education of all speakers with MS and healthy talkers were 52 ± 10 and 15 ± 3 years and 52 ± 6 and 15 ± 2 years, respectively. All participants spoke standard American English and reported no vision or hearing problems or use of a hearing aid, no substance abuse, and passed a pure tone hearing screening at 40 dB, in at least one ear. Speakers with MS also reported no other neurological or neuropsychiatric diseases, no use of corticosteroids for the relapse of MS within 8 weeks of testing, and no medication changes for treatment or symptoms of MS within 12 weeks of testing. On average, individuals with MS were diagnosed 15 ± 11 years prior to participation and varied in disease course (Feenaughty et al., Reference Feenaughty, Tjaden, Weinstock-Guttman and Benedict2018). Participants with MS were taking a variety of medications to treat MS symptoms. Thirty-eight speakers (81%) were taking a disease-modifying drug. No one was receiving speech therapy at the time of data collection. Overall disease severity and symptoms of depression and fatigue did not significantly differ among the MS groups (Feenaughty et al., Reference Feenaughty, Tjaden, Weinstock-Guttman and Benedict2018). The review board at the University at Buffalo approved this study.
Procedures to Determine Speaker Groups
Similar to Feenaughty et al. (Reference Feenaughty, Tjaden, Weinstock-Guttman and Benedict2018), cognitive impairment was defined as a Z-score of ≤ −1.50 on at least one of the following cognitive tests: (1) Paced Auditory Serial Addition Test-3 second version (PASAT; Gronwall, Reference Gronwall1977), (2) Symbol Digit Modalities Test-oral version (SDMT; Smith, Reference Smith1982), (3) California Verbal Learning Test (CVLT-II; Delis, Kramer, Kaplan, & Ober, Reference Delis, Kramer, Kaplan and Ober2000), and (4) Delis Kaplan Executive Functioning System-sorting test (DKEFS; Delis, Kaplan, & Kramer, Reference Delis, Kaplan and Kramer2001). Tests were administered following standard procedures. Raw scores from each test were normalized for a speaker’s age, years of education, and gender (Parmenter, Testa, Schretlen, Weinstock-Guttman, & Benedict, Reference Parmenter, Testa, Schretlen, Weinstock-Guttman and Benedict2010; Amato et al., Reference Amato, Langdon, Montalban, Benedict, DeLuca, Krupp and Comi2013). The cognitive–dependent variables included the total number of words recalled after a long delay (~25 min) from the CVLT-II, the total number of correct sorts from the DKEFS, and information processing efficiency, an average of the raw scores from the PASAT-3 and SDMT (Parmenter et al., Reference Parmenter, Testa, Schretlen, Weinstock-Guttman and Benedict2010).
Procedures and methods for obtaining clinical dysarthria diagnoses have been described in detail (Feenaughty et al., Reference Feenaughty, Tjaden, Weinstock-Guttman and Benedict2018). Each speaker was audio-recorded producing a variety of speech tasks. Briefly, speakers were randomly assigned to counterbalanced task orders to elicit the speech samples. Audio-recorded files were assigned a numeric code for unbiased measurements. Speech samples were audio-recorded using a Countryman E610P5L2 ear-mounted microphone placed 6 cm from the center of the speaker’s upper lip. The acoustic signal was preamplified and digitized at a sampling rate of 22.05 kHz (Boersma & Weenink, Reference Boersma and Weenink2012).
Three certified speech-language pathologists determined a clinical diagnosis of dysarthria for speakers with MS based on auditory–perceptual analysis using a consensus approach (Keintz, Bunton, & Hoit, Reference Keintz, Bunton and Hoit2007), following procedures for dysarthria diagnosis used in clinical practice (Duffy, Reference Duffy2013). Speech samples were presented in a quiet room over computer speakers. Before listening to the stimuli, the speech-language pathologists were informed of a speaker’s age and neurological diagnosis. Severity ratings as judged by the speech-language pathologists ranged from mild to severe (Feenaughty et al., Reference Feenaughty, Tjaden, Weinstock-Guttman and Benedict2018). Despite a clinical dysarthria diagnosis for speakers with dysarthria, sentence intelligibility approached 100%. Each speaker group contained eight females and four males. The MSCI group was significantly younger and had more years of education than the MSDYS and MS groups (Feenaughty et al., Reference Feenaughty, Tjaden, Weinstock-Guttman and Benedict2018).
Experimental Speech Task, Procedures, and Speech Timing Measures
A descriptive discourse speech task was employed, as spontaneous speech is presumed to impose greater cognitive–linguistic demands on the speaker compared to reading aloud (Feenaughty et al., Reference Feenaughty, Tjaden, Benedict and Weinstock-Guttman2013). Speakers described a person of interest to them (e.g., spouse) and one person selected from six choices reflecting prominent historical figures (e.g., Barack Obama) for about 2 min. Discourse topic order was counterbalanced across speakers and groups. All measures obtained from the discourse tasks were aggregated to reflect a single variable. For all measures, the discourse duration corresponded to approximately 43 s of a continuous stretch of investigator-free speech from the initial portion of each speech sample similar to the reading passage used for dysarthria assessment in clinical practice (Feenaughty et al., Reference Feenaughty, Tjaden, Benedict and Weinstock-Guttman2013).
Following Feenaughty et al. (Reference Feenaughty, Tjaden, Weinstock-Guttman and Benedict2018), we segmented speech samples into speech runs (i.e., phrases) and pauses using speech analysis software (TF32, Milenkovic, Reference Milenkovic2011). A speech run was operationally defined as a stretch of speech between silent pauses greater than 200 ms (Turner & Weismer, Reference Turner and Weismer1993). Standard acoustic criteria were applied to segment the speech samples to obtain speech rate, articulation rate, silent pause frequency, and duration previously shown to be sensitive to cognitive function (Feenaughty et al., Reference Feenaughty, Tjaden, Benedict and Weinstock-Guttman2013; Lowit et al., Reference Lowit, Brendel, Dobinson and Howell2006; Murray, Reference Murray2000). These measures were also selected because slowed speech and articulation rates have been reported in spastic–ataxic dysarthria associated with MS (Noffs et al., Reference Noffs, Perera, Kolbe, Shanahan, Boonstra, Evans, Butzkueven and Vogel2018). Speech rates in syllables per second were derived by dividing the total number of syllables produced by the total duration of each speech sample including pauses. Articulation rates were calculated similarly excluding pause time. Silent pauses were counted to obtain a total number of silent pauses. Silent pause durations were averaged for each speaker and speech task. For approximately 10% of the speech samples, intra- and inter-reliability meets or exceeds reliability in prior studies (Feenaughty et al., Reference Feenaughty, Tjaden, Benedict and Weinstock-Guttman2013).
Listeners, Perceptual Task, and Procedure
For each experimental speech task, 20 listeners judged Speech Severity, an operationally defined perceptual construct reflecting overall naturalness and melody of speech (Sussman & Tjaden, Reference Sussman and Tjaden2012). Ten female listeners judged speech severity for all speaker groups, except for the MSDYS + CI group. Ten different listeners (8 females; 2 males) judged speech severity for the comorbid group. Listeners spoke standard American English, achieved at least a high school diploma or equivalent, were between 19 and 33 years (mean 23 ± 4), reported normal speech-language functions and vision, had minimal familiarity with speech-language disorders, and passed a bilateral hearing screening at 20 dB HL.
Listeners judged speech severity for a variety of speech tasks. Only results for the descriptive discourse speech tasks are reported in the present study. Listeners were seated at a computer in a sound-treated room. Stimuli were presented over headphones at a comfortable listening level (mean 72 ± 2 dB SPL). Listeners judged each speech sample using a visual analog scale (VAS) (Feenaughty et al., Reference Feenaughty, Tjaden, Weinstock-Guttman and Benedict2018; Sussman & Tjaden, Reference Sussman and Tjaden2012; Anand & Stepp, Reference Anand and Stepp2015). Without knowledge of a speaker’s identity and group membership, listeners judged speech severity using a computerized VAS scale, with scale values ranging from “0” (no impairment) to “1” (severe impairment). Speech severity scores from the two discourse tasks were averaged for each speaker for the statistical analysis, as scores did not differ between the self-selected topic and the list of topics. Before the experiment, listeners practiced the task to ensure that they understood how to use the VAS.
For 20% of the stimuli, all listeners achieved intra-judge reliability of r = .70 or greater as indexed by Pearson correlation coefficients. Inter-judge reliability indexed by the average intraclass correlation coefficient (Neel, Reference Neel2009) was at least .91 (SD = .04; p < .001) for both listener groups and was .90 (SD = .26; p < .001) for all 20 listeners, ensuring the two listener groups did not confound the results. Listener intra- and inter-judge reliability meets or exceeds reliability in similar studies (Tjaden, Sussman, & Wilding, Reference Tjaden, Sussman and Wilding2014).
Statistical Analyses
MS groups were evaluated using a 2 × 2 factorial design to test main and interaction effects of dysarthria and cognitive impairment on speech outcome measures using general linear model analysis of covariance (Figure 1). Post hoc testing involved Tukey–Kramer adjustment for multiple comparisons. The Kruskal–Wallis test with covariate-adjusted residuals (Ceyhan & Goad, Reference Ceyhan and Goad2009) followed by the Dwass, Steel, Critchlow-Flinger method for multiple comparisons were performed when statistical assumptions were violated. An effect size, partial eta squared or non-parametric equivalent (Tomczak & Tomczak, Reference Tomczak and Tomczak2014), was obtained for significant effects. Linear regression with Cohen’s f effect size (Cohen, Reference Cohen1988) compared each MS group to the CON group. All analyses included speaker age as a covariate, but not education which did not share a linear relationship with the speech measures. Additionally, two exploratory regression analyses (stepwise function) were conducted to determine: (1) the speech timing measures predicting perceived speech severity and (2) the cognitive and biopsychosocial variables predicting the identified speech measure found to contribute the most to speech severity in the first regression. An alpha level of .05 was used for each analysis.
Participants with multiple sclerosis (MS) were assigned to one of four operationally defined speaker groups using a 2 × 2 factorial pattern based on cognitive and dysarthria status. The number of individuals per speaker group is indicated (i.e., n = 12).

RESULTS
Speech Rate and Articulation Rate
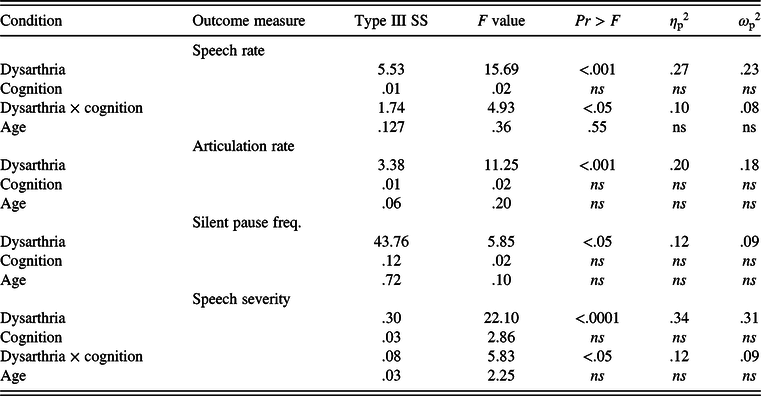
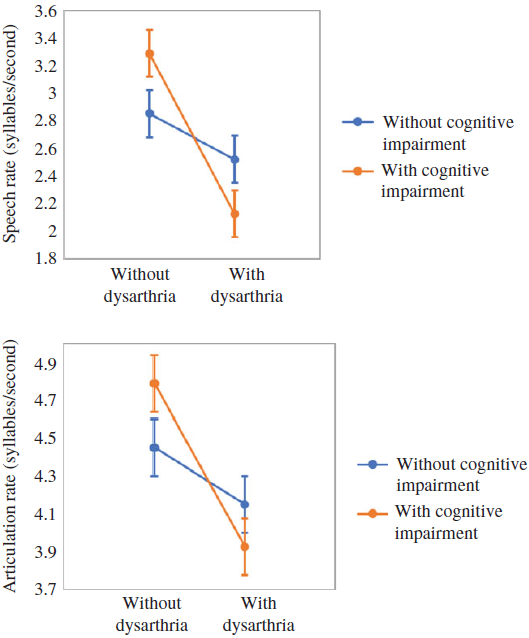
Table 1 summarizes results from the general linear analysis of covariance evaluating main and interaction effects between groups with MS and each speech measure. The effect of dysarthria on speech rate was significant. Speakers with dysarthria produced slower speech rates than speakers without dysarthria. The effect of cognition on speech rate was not significant. As shown in Figure 2 (upper), there was a significant interaction between cognition and dysarthria. Post hoc tests indicated the MSDYS + CI group had significantly slower speech rates than the MSCI (p < .001) and MS (p = .01) groups, but not the MSDYS group (p = .33). Linear regression results summarized in Table 2 indicated significant speech rate differences for the CON group and the four pooled groups of MS speakers. Follow-up comparisons indicated the MSDYS + CI group had significantly slower speech rates compared to the CON group (t = −2.88, p = .006). There were no significant differences between the CON group and the MSDYS (p = .28), MSCI (p = .10), and MS (p = .78) groups.
General linear model results for the 2 × 2 factorial analysis for condition and speech outcome measure controlling for age for speakers with multiple sclerosis

Each model included a main effect of dysarthria, main effect of cognition, a two-way interaction term for dysarthria and cognition if it remained significant, and age. η p2 = partial eta squared, and less biased ω p2 = partial omega squared.
Means (standard error bars) are reported for speech (upper) and articulation (lower) rates as a function of dysarthria and cognitive status for speaker groups with multiple sclerosis (MS).

Overall general linear model results for speech outcome measures comparing the data pooled across the four speaker groups with multiple sclerosis to the reference group of healthy talkers while controlling for age

Each model included group and age. DF = degrees of freedom. Cohen’s f was defined as R 2/(1−R 2).
Figure 2 (lower) also indicates a significant effect of dysarthria on articulation rate, with slower articulation rates for speakers with dysarthria. The effect of cognition and interaction of cognition and dysarthria were not significant. Linear regression results indicated significant articulation rate differences for the CON group and the four pooled groups of MS speakers. Follow-up comparisons indicated the MSCI group had significantly faster articulation rates compared to the CON group (t = −2.92, p = .005). The CON group did not significantly differ from the MSDYS + CI (p = .40), MSDYS (p = .85), and MS (p = .12) groups.
Silent Pause Frequency and Duration
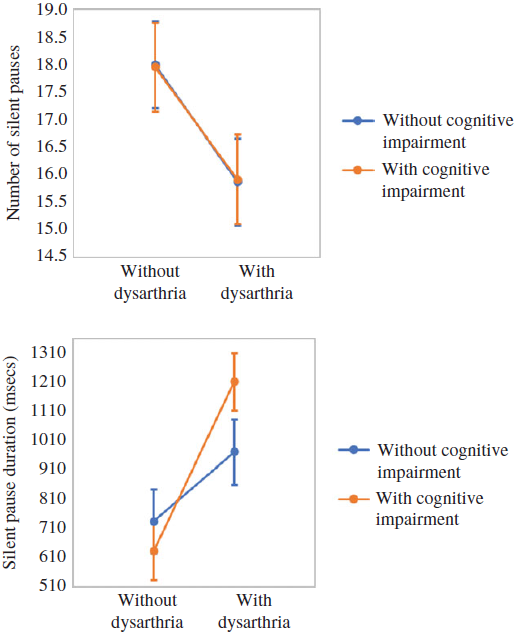
As shown in Figure 3 (upper), there was a significant effect of dysarthria on the number of silent pauses, with fewer pauses for speakers with dysarthria. The effect of cognition and interaction between cognition and dysarthria were not significant. Linear regression results in Table 2 comparing data pooled across the four MS groups to the CON group were not significant.
Means (standard error bars) are reported for the number of silent pauses (upper) and duration (lower) as a function of dysarthria and cognitive status for speaker groups with multiple sclerosis (MS).

Figure 3 (lower) also reports the results for silent pause duration. Results from the Kruskal–Wallis with Dwass et al. method for multiple comparisons indicated a significant difference among the medians of the four MS groups, χ 2(3) = 9.28, p < .05, η p2=.14. The MSDYS + CI group had a significantly different median pause duration compared to the MS group, with longer pauses for speakers in the MSDYS + CI group (p = .02). No other comparisons were significant. Linear regression analysis in Table 2 indicated a significant difference in silent pause durations for data pooled across the four MS groups versus the CON group. Follow-up comparisons indicated the MSDYS + CI group had significantly longer pauses versus the CON group (t = 3.97, p < .001). The CON group did not differ from the MSDYS (p = .07), MSCI (p = .98), and MS (p = .94) groups.
Speech Severity
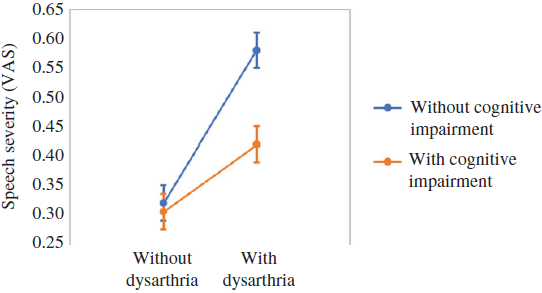
Figure 4 reports scaled speech severity. The statistical analysis indicated a significant effect of dysarthria, with significantly poorer speech severity for speakers with dysarthria. The effect of cognition was not significant. There was also a significant interaction between cognition and dysarthria. Post hoc tests indicated poorer speech severity for the MSDYS group compared to the MSDYS + CI (p = .02), MSCI (p < .001), and MS (p < .0001) groups. Linear regression results in Table 2 also indicated significant differences in speech severity for the CON group and the four pooled groups of MS speakers. Follow-up comparisons indicated the MSDYS + CI (t = 4.25, p < .0001), MSDYS (t = 7.46, p < .0001), and MSCI (t = 2.21, p = .031) groups had significantly poorer speech severity than the CON group.
Means (standard error bars) are reported for scaled speech severity as a function of dysarthria and cognitive status for speaker groups with multiple sclerosis (MS).

Regression Analyses for Speakers with MS
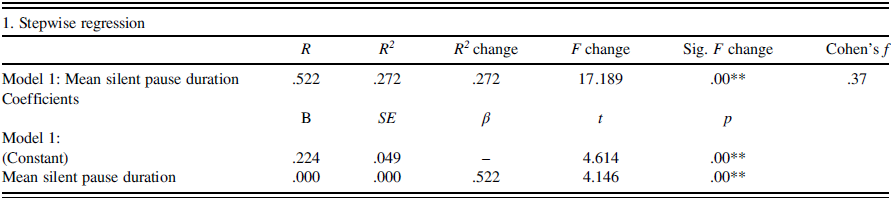
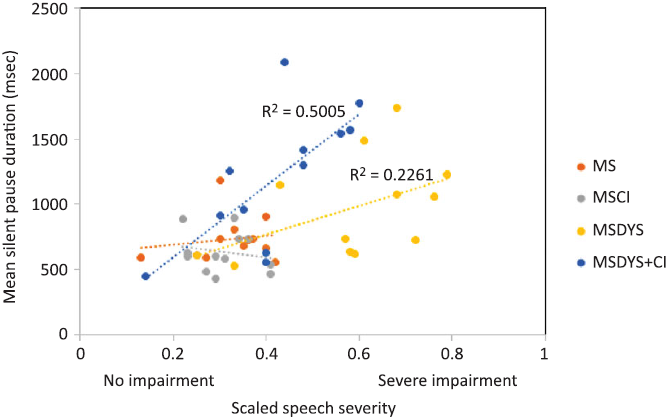
The first stepwise regression exploring the relationship between speech severity and speech timing measures yielded one significant model (Table 3). The model included mean silent pause duration and explained 27% of the variance in scaled speech severity. Figure 5 reports scatter plots illustrating the relationship between scaled speech severity and mean silent pause duration, the dependent variable accounting for the largest proportion of variance in perceived speech severity. Separate, follow-up linear regression functions also were fit to data for the speech measure found to predict speech severity. Within speaker groups with dysarthria, longer pauses were associated with poorer speech severity, with the strongest relationship for the MSDYS + CI group (R 2 = .50).
Summary of stepwise regression results including coefficients and significance values obtained from the final significant regression models for: (1) global speech timing variables predicting listener estimates of speech severity and (2) cognitive and biopsychosocial variables predicting the speech variable found in the first analysis to contribute the most to speech severity

Variables not retained include speech rate, articulation rate, and silent pause frequency.
*Regression model significant at p < .05.
**Regression model significant at p < .001.

Variables not retained include depression, fatigue, memory, and executive function.
*Regression model significant at p < .05.
**Regression model significant at p < .001.
Scatter plots indicate the relationship between scaled speech severity and mean silent pause durations for descriptive discourse. Separate linear regression functions fit to data, particularly the MSDYS and MSDYS + CI groups accounted for 22% and 50% of the variance, respectively.

The second stepwise regression analysis exploring the relation between cognitive test scores and biopsychosocial variables (age, depression, fatigue) and the speech variable (longer silent pauses) accounting for most of the variance in speech severity yielded two significant models (Table 3). Age accounted for 8% of the variance in silent pause durations. Information processing efficiency accounted for an additional 12% of the variance.
DISCUSSION
Speech Timing Measures
Speakers with MS without dysarthria or cognitive impairment (MS) did not differ from healthy controls on speech timing measures, as hypothesized. Except for articulation rate, speakers with cognitive impairment (MSCI) also maintained similar patterns of speech timing in descriptive discourse as the MS and CON groups. This outcome and the significantly faster articulation rates for the MSCI group compared to healthy controls do not support our hypothesis and are at odds with prior studies (Friedova et al., Reference Friedova, Rusz, Motyl, Srpova, Vodehnalova, Andelova and Havrdova2019; Rodgers et al., Reference Rodgers, Tjaden, Feenaughty, Weinstock-Guttman and Benedict2013). An explanation for this unexpected finding is not entirely clear. Language characteristics of the descriptive discourse task were not examined in the current study. However, it may be speculated that the MSCI group used less informative lexical content with an accompanied faster speaking rate (Priva, Reference Priva2017). Faster articulation rate is also associated with a more casual or hypoarticulated speech style (Smiljanić & Bradlow, Reference Smiljanić and Bradlow2009). It is also possible that the faster articulation rate for the MSCI group reflects a more casual style of speaking.
As hypothesized, dysarthria played a significant role in speech timing measures (Figures 2 and 3), consistent with prior studies (Feenaughty et al., Reference Feenaughty, Tjaden, Benedict and Weinstock-Guttman2013; Lowit et al., Reference Lowit, Brendel, Dobinson and Howell2006; Smith & Caplan, Reference Smith and Caplan2018; Yunusova et al., Reference Yunusova, Graham, Shellikeri, Phuong, Kulkarni, Rochon and Green2016). Individuals with dysarthria spoke more slowly and produced less frequent and longer pauses than speakers without dysarthria. The finding that the two groups with dysarthria were not statistically different from one another seems to argue against the role of cognitive involvement in speech rate outcomes. However, the significant interaction effect indicated that differences in speech rate between speakers with and without dysarthria can be accounted for by cognitive status. For speakers with cognitive impairment, comorbid dysarthria was accompanied by slower speech rates than no dysarthria. For speakers with no cognitive impairment, dysarthria had no effect on speech rate (Figure 2). These results seem to strengthen theoretical perspectives and Feenaughty et al.’s (Reference Feenaughty, Tjaden, Benedict and Weinstock-Guttman2013) assertion that it may be difficult for speakers with MS facing both cognitive impairment and mild dysarthria to maintain typical speech timing patterns during connected speech. The finding that speech rates produced by the MSDYS + CI group, but not the MSDYS group, were significantly different from controls also supports this idea. The current findings and others suggest further studies of comorbid cognitive deficits and dysarthria in MS are warranted (Feenaughty et al., Reference Feenaughty, Tjaden, Weinstock-Guttman and Benedict2018; Yorkston et al., Reference Yorkston, Klasner, Bowen, Ehde, Gibbons, Johnson and Kraft2003).
Pause time has been interpreted to reflect cognitive–linguistic planning demands (Feenaughty et al., Reference Feenaughty, Tjaden, Benedict and Weinstock-Guttman2013; De Looze et al., Reference De Looze, Moreau, Renié, Kelly, Ghio, Rico and Petrone2017; Svindt, Bona, & Hoffmann, Reference Svindt, Bóna and Hoffmann2020) or the demand to generate an internal motor plan free of linguistic context required for spontaneous speech (Sidtis & Sidtis, Reference Sidtis and Sidtis2017). Thus, it could be speculated that speakers in the MSDYS + CI group demonstrated significantly longer silent pauses to allow more time for language formulation or to generate an internal motor plan for the spontaneous speech task, as an external printed script or verbal model of the desired speech output was not provided. Alternatively, limited capacity processing models consider the speed at which information can be processed as naturally fixed for a given person (Baddeley & Hitch, Reference Baddeley and Hitch1974; Kail & Salthouse, Reference Kail and Salthouse1994). The neural damage likely varies by location, severity, and speaker, yet speakers with mild cognitive impairment (MSCI) may have been able to process information for the speech task relatively quickly and efficiently compared to speakers with dysarthria (MSDYS). Damage to shared neural networks for speech (Simonyan, Ackermann, Chang, & Greenlee, Reference Simonyan, Ackermann, Chang and Greenlee2016) or the combined burden of damage (MSDYS + CI) also may have led to greater neural inefficiency and diminished interactions among higher level systems for retrieving or encoding cognitive–linguistic information and the speech motor system (Hickok & Poeppel, Reference Hickok and Poeppel2007), yielding significant declines in speech timing when processing capacity was exceeded. Statistically significant pause length differences for only the comorbid group compared to the MS and CON groups also support pause time in connected speech serving as a marker of neurological involvement in MS (Asgari, Kaye, & Dodge, Reference Asgari, Kaye and Dodge2017). However, care is warranted about drawing strong conclusions, as mild cognitive impairment alone did not strongly impact speech timing measures. Caution is also warranted about comparing results of the present study to other studies due to differences in speech tasks, cognitive metrics, and neurological diagnoses.
Perceptual Measures
Listeners judged descriptive discourse for the MSDYS group to be the most severe, although the comorbid group had speech timing measures that differed the most from other groups. Similar findings were found in Feenaughty et al. (Reference Feenaughty, Tjaden, Weinstock-Guttman and Benedict2018) for a reading passage. The comorbid group in the present study also demonstrated longer silent pauses and slower speech rates relative to all other groups. This suggests that other factors may have contributed to perceptual judgments of speech severity. One possibility is that listeners perceived deviant voice characteristics (i.e., strained strangled) to be more salient and unnatural. Thus, samples produced by the MSDYS group were judged as more severe (Dagenais, Watts, Turnage, & Kennedy, Reference Dagenais, Watts, Turnage and Kennedy1999). Perceived speech severity for both groups with cognitive impairment also was significantly poorer compared to controls, suggesting that MSCI in MS may be reflected in judgments of speech severity. Mackenzie and Green (Reference Mackenzie and Green2009) found that higher scores on the Arizona Battery for Communication Disorders of Dementia (Bayles & Tomoeda, Reference Bayles and Tomoeda1993), indicating less cognitive involvement, were associated with higher sentence intelligibility. Although these findings may reflect a third variable effect because participants spanned a broad range of overall disease and dysarthria severity, the present findings appear to support this prior study suggesting that listeners were sensitive to the presence of cognitive impairment.
Relationship Among Speech Timing and Perceived Speech Severity
Longer silent pauses explained a significant portion of the variance (27%) in speech severity, when data were pooled for all speakers with MS. As stated above, listeners may have been sensitive to deviant voice characteristics. However, exploratory regression results and the significant pause duration differences for the comorbid group have implications for interventions aimed at pausing behavior. MacGregor and colleagues (Reference MacGregor, Corley and Donaldson2010) suggested that longer pauses contribute to perceptions of reduced speaker competence. These perceptions may be detrimental in the workplace (Smith & Arnett, Reference Smith and Arnett2005). Therapy to reduce pause lengths thus may improve the flow of speech and positively impact perceptions of speaker competence and ability to perform in the workplace. The results also suggested a more robust relationship between perceived speech severity and pause durations for the speakers with comorbid deficits versus the other speaker groups with MS (Figure 5). However, studies are needed to investigate factors other than speech timing (linguistic characteristics) to clarify why the MSCI group was perceived to be more severe than controls.
Identifying the mechanisms underlying aberrant speech production behaviors including slowed speech rate is crucial for effective management. Thus, a second stepwise regression analysis explored cognitive and biopsychosocial variables (Table 3) with potential to contribute to longer silent pauses. Age (8%) and reduced processing speed and efficiency (12%) explained a significant portion of the variance in mean silent pause durations. The findings are broadly similar to Rodgers et al. (Reference Rodgers, Tjaden, Feenaughty, Weinstock-Guttman and Benedict2013) for paragraph reading and spontaneous speech tasks. Although it is challenging to determine variables underlying the group differences in perceived speech severity in the present study, preliminary results seem to be consistent with prior research suggesting that motor and non-motor factors are reflected in both speech production (Rodgers et al., Reference Rodgers, Tjaden, Feenaughty, Weinstock-Guttman and Benedict2013) and perceptual outcomes (Feenaughty et al., Reference Feenaughty, Tjaden, Weinstock-Guttman and Benedict2018; Mackenzie & Green, Reference Mackenzie and Green2009). However, the variables contributing to perceptual judgments of speech severity are just beginning to be understood. Future studies could examine variants of listener instructions to identify the separate effects of prosodic and other features of dysarthria on scaled speech severity in MS.
This study is the first to empirically test the separate and co-occurring consequences of impaired cognition and dysarthria on speech timing measures for individuals with MS, who underwent rigorous neuropsychological testing and a formal clinical dysarthria evaluation. The findings provide support for mild cognitive deficits co-occurring with dysarthria as a factor which significantly contributes to slowed speech in MS. The findings also have implications for clinical management of dysarthria and our understanding of cognitive–speech motor interactions in MS. First, dysarthria treatment should be delivered within a comprehensive rehabilitation plan, as dysarthria co-occurs with other physical, cognitive, and psychosocial changes (Yorkston et al., Reference Yorkston, Klasner, Bowen, Ehde, Gibbons, Johnson and Kraft2003). The amount of rate reduction attributed to speech motor ability may also be overestimated in individuals also experiencing cognitive impairment, as not only dysarthria, but also reduced processing efficiency may contribute to aberrancies in objective speech timing measures and ultimately to speech severity judgements. Future studies comparing performance across tasks imposing a range of cognitive–linguistic load and paradigms with greater ecological validity (dual tasks) may help to manage symptoms of MS and to better understand the complex interactions between cognitive, linguistic, and motor processes crucial for speech production.
Acknowledgments
This work was funded by an ASHFoundation New Century Doctoral Scholarship (L.F.), the Mark Diamond Research Fund of the Graduate Student Association at the University at Buffalo (L.F.), and National Institutes of Health (K.T., grant number R01DC004689). Portions of this work were presented at the 2016 and 2018 Biennial Conferences on Motor Speech. The authors thank Dr. Joan Sussman for assistance with the perceptual design and research assistants for support with various parts of this study.
Conflict of interest
The authors report no conflicts of interest.