1 Introduction
In the last two decades, corporatisation has been widely adopted by policymakers in many countries as a strategy to improve hospital performance (Braithwaite et al., Reference Braithwaite, Travaglia and Corbet2011). Under corporatisation, hospital managers are given a higher degree of authority over inputs and issues related to service delivery (Preker and Harding, Reference Preker and Harding2003). This increased authority is intended to give hospital managers the opportunity for innovation, which in turn is expected to improve several aspects of hospital performance, including efficiency, equity and quality. While corporatisation is intended to improve hospital performance, evidence across countries has not been definitive. Corporatised hospitals in Australia succeeded in reducing unit cost (Corden, Reference Corden2003), while Scott et al. (Reference Scott, McKenzie and Webster2003) found that the efficiency of corporatised hospitals in New Zealand remained unchanged, indicated by no reduction in waiting time.
Similar mixed findings emerge from studies in South East Asian countries. Corporatised hospitals in Singapore (Phua, Reference Phua2003) and Malaysia (Hussein et al., Reference Hussein, Al-Junid, Nyunt-U, Baba and Geyndt2003) have achieved many positive results in efficiency, including a better ability to recoup costs and higher bed occupancy rates (BOR). In addition, the one corporatised hospital studied in Malaysia has succeeded in maintaining its social functions, as indicated by the stable amount of subsidy for the poor. In the neighbouring countries of Thailand and Vietnam, government reformed the hospitals into autonomous units. The autonomous hospital studied in Thailand was successful in increasing its range of services, occupancy rate and bed turnover (Hawkins et al., Reference Hawkins, Srisasalux and Osornprasorp2009), while hospital autonomy in Vietnam showed mixed results (London, Reference London2013). Here, hospital reform improved hospital revenue and reduced government subsidies; however it had no effect on length of stay (LOS) and occupancy rate.
Some limitations are evident in the emerging literature. First, the studies examined a limited number of hospitals. For instance, both in Malaysia (Hussein et al., Reference Hussein, Al-Junid, Nyunt-U, Baba and Geyndt2003) and Thailand (Hawkins et al., Reference Hawkins, Srisasalux and Osornprasorp2009), the study was conducted in only one hospital, while in Singapore it was carried out in eight hospitals (Phua, Reference Phua2003). This limited sample cannot well represent all hospitals in a country. Second, no study has examined non-corporatised hospitals as a control. Without control hospitals, it is difficult to assess the consequences of corporatisation independent of other factors, such as unobserved variables driving a hospital to choose reform over another decision. Finally, most of these studies stopped at descriptive analysis to explain the consequences of corporatisation for hospital performance (Corden, Reference Corden2003; Hussein et al., Reference Hussein, Al-Junid, Nyunt-U, Baba and Geyndt2003; Phua, Reference Phua2003; Scott et al., Reference Scott, McKenzie and Webster2003), an approach with limited power to uncover the association of corporatisation with hospital performance. The study in Vietnam made some improvements by using linear regression (London, Reference London2013). However, the coefficient estimates derived from this may be biased, as it does not take into account unobserved heterogeneity that may exist among the hospitals.
To fill these gaps, this study investigates the consequences of corporatisation on hospital performance by referring to the experience of hospital corporatisation in Indonesia. In 2004, Indonesia transformed public hospitals from either budgetary or autonomous units into corporate units, or Badan Layanan Umum (Public Service Agencies) (Government of Indonesia, 2005). The main aim of this corporatisation was to improve efficiency in the provision of hospital services. This transformation has not been automatic: it has occurred only when hospitals have met the requirements set down by government, such as the availability of unit cost calculations, financial reports and a business plan. This research, sited in Indonesia, is thus able to examine the consequences of corporatisation in the hospital sector by comparing the performance of corporatised and non-corporatised hospitals.
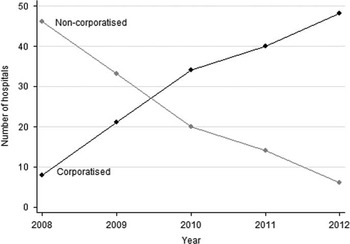
This study contributes to the existing literature in a number of ways. It is one of the first to use data from a large number (54) of public hospitals. These hospitals have different classes, types and ownerships, and thus represent all public hospitals in Indonesia. Second, this study analyses the performance of corporatised hospitals with non-corporatised hospitals as the control group. Moreover, the data in this study covers hospital performance over five years, during which time 80% of the hospitals were corporatised (see Figure 1). These circumstances enable us to examine the dynamic changes in these hospitals over time. Finally, it uses panel regression analysis which accommodates the observations of a hospital over time (Singer, Reference Singer2003; Gujarati, Reference Gujarati2011). This answers the unobserved heterogeneity problem by allowing each hospital to have its own intercept, thus enabling our hypothesis regarding the consequences of corporatisation on hospital performance to be tested more robustly.
Hospital status from 2008 to 2012.

The rest of the paper continues as follows. First, we briefly review the relevant literature related to hospital corporatisation and its consequences across countries. We then describe hospital corporatisation in Indonesia. Empirical analysis proceeds by presenting the data followed by the results of both descriptive and panel data regression analysis. Finally, we discuss the results and conclude with suggestions for further work.
2 Hospital corporatisation and its consequences across countries
Over the past two decades policymakers and researchers have taken an increased interest in hospital performance as the hospital is the main provider of both basic and advanced health care services, especially critical care services. This interest has become even more intense because of the widely reported problems faced by public hospitals in delivering these services, such as inefficiency, user dissatisfaction and failure to reach poor people (Jakab et al., Reference Jakab, Preker, Harding and Hawkins2002). Furthermore, the hospital sector absorbs the largest proportion of health care expenditure in both developed (Organization for Economic Cooperation and Development: OECD, 2010) and developing countries (Mills, Reference Mills1990a, 1990Reference Millsb). Hospitals thus often become the main target of reforms, which aim to improve their efficiency, equity and quality of care. One particular reform widely applied in the hospital sector is corporatisation, which intends to increase hospital performance specifically through the adoption of practices found in the private sector (Preker and Harding, Reference Preker and Harding2003; Vienazindiene and Ciarniene, Reference Vienazindiene and Ciarniene2007).
However, the consequences of corporatisation vary across countries. A number of studies have found these to be positive. For example, the successful implementation of corporatisation was carried out in the state of Victoria in Australia. In 1995, the government of Victoria restructured its 32 autonomous public hospitals into seven health care networks: six based in the regions and one specialist network. This reform was expected to increase the efficiency of hospitals by reducing duplication of services and sharing infrastructure costs. Corden (Reference Corden2003) found that the existence of these health care networks reduced unit costs. Real unit costs per case mix-adjusted inpatient in the network hospitals fell about 5% in the two years after the network was introduced. Furthermore, the introduction of networks contributed significantly to the improvement of quality and access to services as more hospitals were accredited and nearly 40,000 more patients were treated per quarter (a 20% increase) by September 1999.
Similar findings emerged in Asian countries, where Singapore, Malaysia and Hong Kong presented positive consequences of corporatisation. In 1985, Singapore applied corporatisation to its public hospitals after carrying out a successful pilot project at the new hospital at Kent Ridge. This reform achieved many positive results, including improvements in cost recovery ratios, services standards and responsiveness to patient’s needs (Phua, Reference Phua2003). In Malaysia in 1992, the government corporatised the National Heart Institute, following the successful corporatisation of the state-owned enterprise sector. This differs from previous cases, in that the reform was applied to a single hospital. Hussein et al. (Reference Hussein, Al-Junid, Nyunt-U, Baba and Geyndt2003) reported that the National Heart Institute gained higher revenue from private patients than other public hospitals while still maintaining its social function. At the same time, the stable amount of government subsidy earmarked for poor patients resulted in the Institute being able to successfully balance its social function with its role as a corporatised hospital. Turning to Hong Kong, in 1991 policymakers changed the public hospital network, integrating all public hospitals into a new, corporatised hospital authority. This reform is considered to be successful as it has resulted in increased bed availability, which in turn has reduced overcrowding and improved quality of care. Higher staff retention and unit cost reduction complement the success of the reform (Yip and Hsiao, Reference Yip and Hsiao2003).
Contrasting results of corporatisation in the hospital sector are found in New Zealand, the second developed country to implement hospital corporatisation under New Zealand company law in 1993. Here however, Scott et al. (Reference Scott, McKenzie and Webster2003) suggested that hospital efficiency remains unchanged. Given these mixed results, we now turn to the experience of Indonesia.
3 Corporatisation of public hospital in Indonesia
Indonesia is the fourth most populous country in the world, with over 230 million people inhabiting an extended archipelago between the Pacific and Indian oceans. Serving this population, Indonesia has a very low supply of hospital beds. In 2011, the ratio of hospital beds to population was 6.3:10,000, far below the global average of 30:10,000 (Awofeso et al., Reference Awofeso, Rammohan and Asmaripa2013). At the same time, utilisation of these beds was very low (55–60%) compared with that of the South East Asian region (over 80%) (Awofeso et al., Reference Awofeso, Rammohan and Asmaripa2013), implying high unmet needs for inpatient care.
The health sector in Indonesia includes public and private hospitals. These hospitals are grouped into four classes (A, B, C, D) according to the medical specialty, technological competencies and the number of beds (Rokx et al., Reference Rokx, Schieber, Harimurti, Tandon and Somanathan2009). Class A hospitals have highly specialised services (each is obliged to provide every specialist and most subspecialist services available) and a minimum of 400 beds, while Class B hospitals provide a minimum of 18 specialty services and 200 beds. Class C have four basic specialist services and a minimum of 100 beds. Class D, the lowest level of hospital, provides at least any two of the four basic specialist services and a minimum of 50 beds (Ministry of Health, 2010). Class A hospitals are majority-owned by central government, while class B hospitals are owned by provincial government and district government owns class C and D hospitals. Based on the services provided, each hospitals is categorised into two types: general and specialist hospitals. General hospitals provide services for all diseases, while specialist hospitals provide services for certain conditions, such as lung disease, leprosy and mental health.
Indonesia’s public hospitals have faced major challenges in recent decades, arising from increasing demand for good quality health services and increasing numbers of private hospitals dedicated to serve the same population. Moreover, public hospitals experience rigid bureaucracy (especially in managing finances, human resources and procurement), which in many cases leads to inefficiency. In 1991, in an effort to improve performance and reduce dependency on government subsidy, Indonesia began the process of reforming its public hospitals (Lieberman and Alkatiri, Reference Lieberman and Alkatiri2003). The objectives were the establishment of strict budget constraints to control costs and provide a better quality service for patients at a lower cost.
To put the current reform in context, a brief historical overview of reforms over the last four decades follows. The first step on the road to reform in 1991 was the government launch of the autonomisation of public (or ‘swadana’) hospitals. Autonomised hospitals have greater authority over their management and are encouraged to operate a commercial section in addition to the standard non-commercial section (Government of Indonesia, 1991). The maximum allotment of the commercial section is 25% of hospital beds (Ministry of Health, 1995). Here patients are charged a higher rate for enhanced room facilities such as private rooms, an en-suite bathroom, television and air conditioning. The generation of revenue is intended to lessen the hospital’s need for government subsidy.
Several studies examine the effect of the hospital autonomisation in Indonesia on patient satisfaction and financial performance. Gani (Reference Gani1996) looked at two public hospitals in West Java and concluded that hospital revenue and patient satisfaction increased under autonomisation, while at the same time the use of facilities by the poor was sustained. However, other studies present different results. Lieberman and Alkatiri (Reference Lieberman and Alkatiri2003) found that autonomisation failed to reduce government subsidy, while Bossert et al. (Reference Bossert, Kosen, Harsono and Gani1997) showed that subsidies to two autonomised hospitals had actually increased five years into autonomisation. In terms of equity, Bossert et al. (Reference Bossert, Kosen, Harsono and Gani1997) found that autonomous hospitals failed to protect the poor, allocating them fewer beds and charging higher fees than the non-autonomous hospitals.
Lieberman and Alkatiri (Reference Lieberman and Alkatiri2003) suggested that the possible explanation of these disappointing results was the increased role of private hospitals. In the mid-1990s the number of private hospital beds in Indonesia has increased significantly, equalling more than a third of public hospital capacity, up from a quarter 10 years before. This circumstance combined with the relative stability of hospital care demand, resulted in lower utilisation of public hospitals. An additional explanation was supplied by Bossert et al. (Reference Bossert, Kosen, Harsono and Gani1997), who used the concept of decision space to identify the range of choice available to hospital managers under autonomy. Examining management functions such as human resources, finance and service delivery, they concluded that autonomisation had conveyed a limited increase in decision space available to the managers, which together with institutional capacities and accountability is an important factor in the improvement of services when authority and responsibility are shifted to the local executives (Bossert and Mitchell, Reference Bossert and Beauvais2011).
After 10 years of the reform, Suwandono et al. (Reference Suwandono, Gani, Purwani, Blas and Brugha2001) analysed the cost recovery rate of inpatient units in three autonomous hospitals in East Java. They found that commercial sections in these hospitals covered only 60% of their costs. One reason for this was the failure of hospital managers to set realistic bed fees (partly the result of the cash-based accounting systems used in public hospitals at the time not being set up to record sufficient financial data to perform comprehensive and routine financial analysis). Accrual-based accounting systems are suggested to provide managers with regular data which compares revenue with costs. Similar empirical evidence is provided by Maharani et al. (Reference Maharani, Femina and Tampubolon2015), who extended the previous study by Suwandono et al. (Reference Suwandono, Gani, Purwani, Blas and Brugha2001) by examining the cost recovery rates in five service units (inpatient, outpatient, operating room, laboratory and radiology) and showed that autonomous hospitals failed to cover their cost in these units. Maharani et al. (Reference Maharani, Femina and Tampubolon2015) concluded that 20 years after autonomisation, hospital financial performance remains weak.
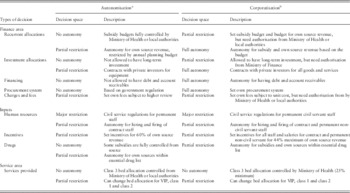
Most recently, in 2004 the Indonesian government launched corporatisation (Government of Indonesia, 2005). Corporatised hospitals have broader decision space on finance and inputs than autonomised hospitals have (see Table 1). Managers have significantly increased autonomy over the following functional areas: setting hospital budget, utilising revenue (both from subsidy and operational), initiating long-term investment programmes, contracting with private sector services and investors, procuring debt and accounts receivable, and having their own permanent (non-civil servant) staff.
Decision space of autonomisation and corporatisation in Indonesia

Note:
a Based on Bossert et al. (Reference Bossert, Kosen, Harsono and Gani1997).
b Based on Regulation of Government of Indonesia number 23 and 24 (2005), Regulation of Ministry of Health number 12 (2003).
With this increased decision space, corporatised hospitals are expected by the stakeholder (central government) to depend less on government subsidies, to successfully compete with other public and private hospitals, and to better serve the community. As yet however, no study has examined the consequences of corporatisation in Indonesia, thus making an assessment of how it affects hospital performance of immediate importance. To do this, we use primary data from public hospitals in East Java province.
4 Data and methods
4.1 Data
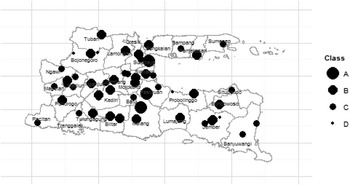
In the summer and autumn 2013, we collected data from 54 public hospitals in East Java province (see Figure 2). This has 29 districts and nine cities, with a total area of 47,130 km2. In 2007, East Java province was the second most populous province in Indonesia with total population of 36,895,571 inhabitants served by 55 public hospitals. This province was chosen for this study as it contains hospitals of every class, type and ownership, and is thus representative of all public hospitals in Indonesia. Of the 55 public hospitals, only one refused to participate, as it was dealing with the accreditation process at that time. The targeted respondents were hospital managers, who answered questions on the characteristics and performance of their hospital over a five-year period from 2008 to 2012.
Spatial distributions of the 54 public hospitals in East Java province.

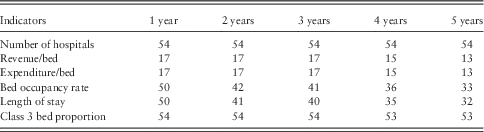
The quality of data obtained (especially financial data) varied among hospitals: this study presents the best data available. It was collected over several visits; however, several hospitals did not provide sufficient data for our analysis (see Table 2). Out of all the sample hospitals, only 13 provided five-year financial data, while five-year data on BOR and LOS was available in 33 and 32 hospitals, respectively. All hospitals provided five-year data on the proportion of class 3 bed (serving mainly the poor), except one hospital which only started to run an inpatient unit in 2010.
Data availability of hospital performance indicators

4.2 Measures of hospital performance
The purpose of evaluating hospital reform is to determine whether the performance of those hospitals undergoing reform is better than those which have not gone through the process. The hospital performance measures in this study are revenue/bed, expenditure/bed, revenue/expenditure, BOR, LOS and proportion of class 3 beds. Revenue/bed, expenditure/bed and revenue/expenditure are financial performance measures, while hospital efficiency is measured by BOR and LOS. The class 3 bed proportion provides a measure of equity. As in many East Asian health systems, public hospitals in Indonesia operate an internal system of cross-subsidisation via tiered pricing (Hussein et al., Reference Hussein, Al-Junid, Nyunt-U, Baba and Geyndt2003; Phua, Reference Phua2003). Individuals admitted to public hospitals choose their level of accommodations and in doing so, a price regime: the more amenities they want, the more they pay. Hospital beds in Indonesia are classified into VIP class, class 1, class 2, class 3 and non-class, depending on the level of services received by the patient and the corresponding cost. Class 3 hospital beds are those with the lowest level of services (and a corresponding cost). The charges for VIP and class 1 beds are used to subsidise class 3 beds. According to the pricing guidelines issued by government to corporatised hospitals, the fee charged for a class 3 bed should be used to cover only the non-salary component of its unit cost (e.g. food, drugs and supplies). As revenue generation is an important feature of the corporatisation concept, the tendency is to invest in expanding VIP and class 1 beds. To avoid hospitals neglecting their social function, public hospitals are required to allocate at least 25% of their beds for class 3 use (Ministry of Health, 1995), ensuring that the poor are not excluded from accessing hospital services. This composition is considered sufficient to allow the hospital to generate revenue for efficiency and quality improvement, as well as cross-subsidising patients treated in class 3 beds.
4.3 Independent variable
We created a dummy variable for corporatisation (1 for a corporatised hospital, 0 for a non-corporatised hospital). In total, ~80% of hospitals were transformed into corporatised unit during the five-year period; we considered these hospitals to be non-corporatised units before the change of the status and corporatised units afterwards.
4.4 Covariates
Hospital type and class are the covariates of hospital performance. Hospital type was measured using a dummy variable (1 for a general hospital and 0 for a specialist hospital). We classified hospital class into four levels: class A, class B, class C and class D.
4.5 Methods
This study aims to measure the consequences of corporatisation on hospitals performance using a panel data regression model (Gujarati, Reference Gujarati2011). Including a binary indicator of corporatisation as an explanatory variable, the estimated model is as follows:
 $$Y_{{it}} \,{\equals}\, \beta X_{{it}} {\plus}\delta Z_{{it}} {\plus}\gamma D_{{it}} {\plus}\alpha _{i} {\plus}v_{{it}} ,$$
where i=1, … , N indexes the hospital and t=1, … , T indexes year. X it is a set of time-varying hospital characteristics, Z it the time invariant hospital characteristics and D it the binary variable for corporatisation. D the step variable, using the value 0 in all periods prior to corporatisation and 1 in all periods at and after the change.
Important is the presence of hospital heterogeneity, term α i . This error component is often correlated with the explanatory variables, meaning that simple regression on the pooled data results in biased and inconsistent estimates of β, γ and δ. The fixed effect model remedies this problem by including N intercepts as parameters to be estimated, which for the estimates for β and γ are equivalent to within regression:
 $$Y_{{it}} {\minus}\bar{Y}_{i} \,{\equals}\,\beta \left( {X_{{it}} {\minus}\bar{X}_{i} } \right){\plus}\gamma \left( {D_{{it}} {\minus}\bar{D}_{i} } \right){\plus}(v_{{it}} {\minus}v_{i} ),$$
where
 $$\bar{Y}_{{i\,}} \,,\,\bar{X}_{i} $$
and
 $\bar{D}_{i} $
are the mean of hospital characteristics. It is clear that fixed effect model will be consistent when
 $(X_{{it}} {\minus}\bar{X}_{i} )$
and
 $(D_{{it}} {\minus}\bar{D}_{i} )$
are not correlated with (v
it
−v
i
), i.e. when X
it
and D
it
are strictly exogenous.
As an alternative to the fixed effect model, we use a random effect model. Assuming the unobserved effect α i is not correlated with explanatory variables, the random effect model uses the following transformation to remove the fixed effect model and obtain efficient estimates in the presence of serial correlation:
 $$Y_{{it}\,} {\equals}\,\beta X_{i} {\plus}\delta Z_{i} {\plus}\gamma D_{i} {\plus}\alpha _{i} {\plus}v_{{it}} .$$
We use the Hausman test to choose between the fixed effect and random effect model.
5 Results
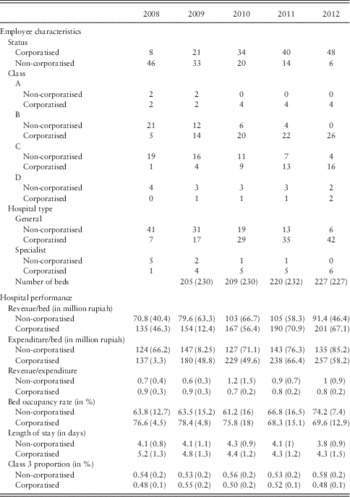
We begin by describing the hospital characteristics and performance of the hospitals under study, followed by the results of the panel data regression analysis associating corporatisation and performance. Across the sample, the number of corporatised hospitals increased sixfold from 2008 to 2012 (Table 3). The majority were class B hospitals (26 hospitals) and class C hospitals (20 hospitals). Hospitals of a higher class tended to take part in corporatisation earlier than those of a lower class; thus half of class A hospitals and 20% of class B hospitals were already corporatised by 2008. Class D hospitals (the smallest group) started to take part in the corporatisation only in 2009. By 2012, all class A and B hospitals had been reformed into corporatised units, while 20% of class C and half of class D hospitals remained unreformed. Based on hospital type, the sample consisted of 48 general hospitals and six specialist hospitals, i.e. three hospitals for lung diseases, two hospitals for leprosy, and a hospital for mental health. By 2012, all specialist hospitals and 87% of general hospitals were corporatised. Over these five years the number of hospital beds increased slightly, by about 17%.
Descriptive characteristics of public hospitals and their performance

Note: Reported are total or mean (SD).
Focussing on hospital performance, there are striking differences in income and spending between corporatised and non-corporatised hospitals. Over the five-year period, corporatised hospitals doubled their income and incurred higher spending than their non-corporatised counterparts. Between 2008 and 2012 corporatised hospitals spending increased by 87%, ~10-fold compared with that of non-corporatised hospitals (8%). BOR and LOS as proxies for efficiency also show different patterns between corporatised and non-corporatised hospitals. The BOR of non-corporatised hospitals decreased slightly up between 2008 and 2010 before increasing in the following years, while that of corporatised hospitals showed a steady decline. The LOS in both types of hospitals had a similar downward trend over five years, indicating an improvement in hospital efficiency. However, the LOS in corporatised hospitals tends to be higher than that in non-corporatised hospitals. Class 3 bed proportion as a proxy for equity remains stable in the same period. Corporatised hospitals tend to have lower proportion of class 3 bed compared with non-corporatised hospitals.
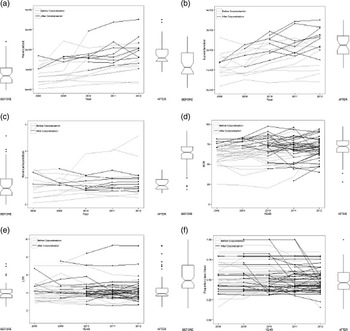
To provide a better insight into hospital performance and its change over time, Figure 3 presents hospital financial, efficiency and equity measures trends from 2008 to 2012, showing that the hospitals’ overall income and spending increased significantly over the five years [Figure 3(a) and 3(b)]. Hospitals taking part in the corporatisation did obtain a certain amount of income, over 100 million rupiahs/bed/year [Figure 3(a)]. At the same time, they also spent >100 million rupiahs/bed/year [Figure 3(b)].
Hospital performances 2008–2012.
Note: (a) Revenue/bed; (b) Expenditure/bed; (c) Revenue/expenditure; (d) Bed occupancy rate; (e) Length of stay; (f) proportion of class 3 bed. Thick line marks corporatised period; boxplots summarise distributions at the beginning and end of the study period.

The increasing trend of hospital revenue and spending among sampled hospitals has not however automatically translated into an increase in efficiency and equity. A comparison of the beginning and end box plots shows no difference in ratio of revenue to expenditure, BOR and LOS over the five years [Figure (3c), (3d) and (3e)]. This stable distribution suggests that the increasing number of corporatised hospitals over time in fact had no effect on efficiency. Even hospitals which have been corporatised for up to five years showed stagnation in both BOR and LOS. Turning to equity, Figure 3(f) shows no significant differences in the proportion of class 3 beds in corporatised and non-corporatised hospitals. One explanation for this could be that corporatisation induced several hospitals which previously had only class 3 beds to begin offering higher class beds in order to generate more revenue. What is certain is that corporatisation significantly improves hospital revenue; one of its major income sources is its commercial section.
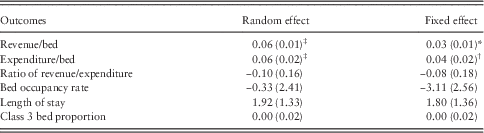
Table 4 presents the results of random effect and fixed effect models, picking out only the corporatisation coefficient (the full coefficients are given in the Appendix). According to the Hausman test statistics, the random effect model is rejected in favour of the fixed effect model; we thus present both results. The dependent variables represent the measures of hospital performance stated above: revenue/bed, expenditure/bed, revenue/expenditure, BOR, LOS and class 3 proportion bed. The results indicated that corporatisation has had a positive and significant effect on hospital revenue and spending. Interesting (although not significant) is the fact that corporatised hospitals have a lower ability to recover their costs, a lower BOR and a longer LOS than their non-corporatised counterparts. Despite the lack of significance, these associations provide some evidence that corporatisation in Indonesia reduces hospital efficiency. Focussing on equity, the fact that class 3 bed proportion is not influenced by corporatisation implies that there is no increase in equity in corporatised hospitals.
Estimates of corporatisation in different specifications (n max=268 hospital-year)

Note: Reported are coefficients (SE).
Significance: *10% or less; †5% or less; ‡1% or less.
6 Discussions
Since the launch of hospital corporatisation in Indonesia in 2004, no formal evaluation has been carried out to assess its consequences on hospital performance. Yet better understanding about the positive and negative consequences of this type of reform could provide an important basis for further application of similar reforms in the hospital sector. The need to undertake evaluation of the consequences of health reform in Indonesia is noted by the World Bank (2010):
… the need to make more information available about past experiences to inform future policy changes is pressing. Few studies have been undertaken to measure the actual impact of the reforms and the remaining challenges (World Bank, 2010).
This study provides the first attempt at such an evaluation of hospitals performance, including financial, efficiency and equity outcomes. Overall, the results show a puzzling consequence of corporatisation on hospital performance, namely, one which increases revenue but decreases efficiency and equity. Several drivers may contribute to such dismal findings. The lack of decision space is one possibility. Bossert (Reference Bossert1998) highlights the importance of the decision space given to the lower tier authorities as part of a successful reform in developing countries. Greater decision space increases the efficiency and quality of a health care system. For instance, increasing decision space in the area of human resources management allows hospital managers to set incentives for employees, which in turn increase their productivity and performance. In a comparative study of four developing countries (Ghana, Zambia, Uganda and the Philippines), Bossert and Beauvais (Reference Bossert and Mitchell2002) found a considerable range in size of decision space among those countries and suggested that this may have contributed to the successes or failures of the reform. In Zambia, the reform transferred less authority to local government than the other three countries and has experienced less successful reform (Bossert et al., Reference Bossert, Chitah and Bowser2003). Establishing greater decision space is recommended by Bossert et al. (Reference Bossert, Chitah and Bowser2003) to improve the performance of the health system in Zambia. However, our study shows that corporatised hospitals (which have greater authority than autonomised hospitals, see Table 1), still failed to deliver improved performance beyond improving revenue. Decision space may not be the main answer and other plausible explanation still need to be explored.
One possibility is the availability of external factors which may affect the success or failure of corporatisation. Preker and Harding (Reference Preker and Harding2003) highlighted the external determinants of the behaviour of a hospital undergoing reform, e.g. governance arrangements, funding arrangements and the market environment. They also found that the less successful corporatisation in New Zealand and autonomisation in Indonesia were partly due to having been carried out in an environment of fiscal pressure. This present study eliminates the effect of external factors by analysing the performance of corporatised and non-corporatised hospitals over five years in one country. Since the results show that the corporatisation fails to improve hospital efficiency and equity, the external factors are unlikely to be the major cause. Having discounted these possibilities, we arrive at the two final explanations for the failure of the reform: reform design and the capacity of hospital managers.
Good design is essential for the success of any reform, including corporatisation, and this is true particularly for developing countries (Berman and Bossert, Reference Berman and Bossert2000). Corporatisation has been widely applied in developed countries and has been successful, for instance in Australia. However, what worked well in developed countries cannot be automatically assumed to work in developing countries. These differ greatly from their developed counterparts, especially in terms of their health systems and economic conditions. One of the important tools necessary to ensure the design of good reform is the availability of preliminary data which can be gained from a pilot model. Successful hospital corporatisation in other countries in regions similar to Indonesia (i.e. elsewhere in South East Asia) tended to implement a pilot model before applying corporatisation in every hospital. The government of Malaysia, for example, applied hospital corporatisation on one hospital only (Hussein et al., Reference Hussein, Al-Junid, Nyunt-U, Baba and Geyndt2003), while the government of Singapore conducted the pilot study in the hospital at Kent Ridge before expanding corporatisation (Phua, Reference Phua2003). The government of Thailand carried out a hospital autonomisation pilot model in Ban Phaeo hospital (Hawkins et al., Reference Hawkins, Srisasalux and Osornprasorp2009) and incorporated learning from this into the reform which was subsequently applied in other hospitals. In contrast, hospital corporatisation in Indonesia began without reference to a pilot model, the lack of which is likely to have resulted in a lack of preliminary data needed to refine the reform design.
Turning to the capacity of managers’, previous research has identified that the capacity of hospital manager is one of the major contributors of the success of corporatisation. For example, Bossert and Mitchell (Reference Bossert and Beauvais2011) in their study in Pakistan suggested that capacities – whether at an institutional or individual level – are particularly important in the implementation of health sector reform. The higher capacity of local executives results in greater innovation, which is likely to improve service delivery. Here, the greater authority of the hospital manager under corporatisation allows them to innovate, but only if this is accompanied by higher capacities. Similar evidence appears in a study of hospital autonomy in Vietnam (London, Reference London2013), which revealed that the increased revenue obtained by autonomised hospitals was not merely due to higher hospital charges, but more to innovations introduced by the managers (such as generating patient-requested services and using equipment procured through joint ventures). The lack of improvement in efficiency and equity of the corporatised hospitals in this study implies that the managers in these hospitals may not be exercising their higher decision space to innovate and to manage the hospital efficiently. Furthermore, the high variability of LOS among corporatised hospitals indicates that under corporatisation (Table 3), hospital managers exercise decisions in similar decision space differently.
This study leaves a number of limitations to be addressed, some of which may be dealt with in future research. First, although it has demonstrated a positive association between corporatisation and hospital revenue and spending, it has not provided an estimate of the causal effect of corporatisation, the effect of which on hospital financial performance using observational data requires researchers both to solve the reverse causality problem and to control for all other unobserved factors. Future research could consider employing an instrumental variable estimator so that reverse causality can be ruled out while simultaneously controlling for at least all time-varying unobservable determinants. Second, this study is limited by data availability. Several hospitals failed to provide the full five years of data (especially financial data). We suggest that further research considers prospective methods for better data availability. Finally, although covering the largest number of hospitals so far, this research was nevertheless limited to one province, Indonesia has 32 other provinces with widely different economic and social conditions. Expanding the research to other provinces is recommended to improve the generalisability of the results.
These limitations notwithstanding, our findings have several important implications for policymakers. First, the availability of multiyear financial data in only 17 out of 54 hospitals in this study (despite the government requirement stipulating the need for hospital provision of financial data before corporatisation) indicates that there is no regular monitoring of these corporatised hospitals by the stakeholder. Yet, monitoring is essential to improve performance as indicated by the studies in Malaysia (Hussein et al., Reference Hussein, Al-Junid, Nyunt-U, Baba and Geyndt2003) and Vietnam (London, Reference London2013). A monitoring system should also be considered in Indonesia as public hospitals here are the main provider of secondary care under the recently launched social security system promises universal health coverage. The failure of hospitals to provide a regular audited financial statement may mean that errors might occur undetected (either intentionally or unintentionally) during the performance of their role in the new system.
Second, in confirming the mixed results found in previous research, the present study provides a further source of empirical support regarding the failure of corporatisation to improve hospital performance in terms of efficiency and equity. Policymakers should note that corporatisation alone cannot guarantee the improvement of hospital performance: planned learning – preliminary data obtained through a pilot model and used to design reform well – is essential. Success stories from Singapore highlight the importance of conducting a pilot study before expanding corporatisation, while Thailand spent much time designing its health reform and implementing it gradually.
Third, policymakers should ensure that hospital managers have good capacity and capability. The lessons from the Indonesia experience show that merely having the appropriate documentation in place before corporatising a hospital is not enough. Having succeeded in their pilot health reform, Thailand established several criteria for health care centre managers to ensure their capacity and commitment; these included having received a good governance award, establishing a public health section and contributing to a community health fund.
Finally, policymakers need to give more prominence to efforts aimed at improving equity. The smaller proportion of hospital beds allocated to the poor in the corporatised hospitals in Indonesia implies a tendency to reduce these beds and focus more on commercial beds. Regulating the minimum proportion of beds allocated to the poor (as decreed by the Indonesian government) is not enough. In order to improve this provision, the government needs to continue to monitor and evaluate the provision of hospital beds for the poor, and ensure that it is adequate, as well as the other performance measures discussed.
In conclusion, addressing the debate on the effect of corporatisation on hospital performance, this study demonstrates that corporatisation put both opportunity and threat into public hospitals in Indonesia. It improves revenue and expenditure, but not efficiency and equity. These results highlight that the transfer of authority to hospital managers is no panacea for the problems faced by public hospitals in delivering services. For successful corporatisation, policymakers should maintain attention on hospital efficiency and equity and not merely on financial performance. Good reform design through planned learning process, capable managers and regular monitoring are needed to improve performance of reformed hospitals.
Acknowledgements
We thank Devi Femina and Tri Ratna Wiryawan for assistance with data collection, and Thomas Bossert, Harvard T.H. Chan School of Public Health, for comments that greatly improved the manuscript. This study was conducted with ethical clearance from the Ethical Committee of the University of Manchester.
Supplementary material
To view supplementary material for this article, please visit http://dx.doi.org/10.1017/S174413311600027X