Introduction
Many potential mechanisms drive differences in insect pest biology across sympatric and allopatric populations. When pests are introduced to novel environments, they can experience reduced genetic diversity caused by bottleneck effects and genetic drift (Sakai et al. Reference Sakai, Allendorf, Holt, Lodge, Molofsky and With2001; Allendorf and Lundquist Reference Allendorf and Lundquist2003). Others experience no change or even an increase in genetic diversity. An increase in genetic or epistatic variation may occur due to multiple introduction events across different source populations, intra- or inter-specific hybridisation, or gene-by-environment interactions (Lee Reference Lee2002; Allendorf and Lundquist Reference Allendorf and Lundquist2003). Environmental conditions differ between geographic regions, and insect development and growth vary due to local adaptations generated by selection pressure or due to fitness trade-offs associated with adapting to the local environmental conditions (Stoks and de Block Reference Stoks and de Block2011). This encourages rapid evolution in invasive species (Sakai et al. Reference Sakai, Allendorf, Holt, Lodge, Molofsky and With2001). Some pest species may be especially plastic in their reactions to temperature or seasonal cues such as photoperiod (Forrest Reference Forrest2016; Shearer et al. Reference Shearer, West, Walton, Brown, Svetec and Chiu2016).
Successful integrated pest management programmes are based on an understanding of pest and host biology. Pest population dynamics affect sampling, control tactics, and economic thresholds, which vary over time and with population fluctuations (Onstad Reference Onstad1987). Monitoring the life stage(s) of the target pest that causes damage is preferred, but that stage(s) is not always susceptible to control. Timing of sample collections and control applications depends on insect phenology and patterns of activity – specifically when insect populations and susceptible stages are present (Chi Reference Chi1990; Way and Van Emden Reference Way and Van Emden2000).
Insect phenology and development are temperature-dependent and can be modelled over time, based on temperature accumulation above a developmental threshold. Over intermediate temperatures, insect development tends to increase linearly with temperature but plateaus or decreases outside an optimum range (Wagner et al. Reference Wagner, Wu, Sharpe and Coulson1984). Developmental and phenological models based on growing degree-days, the accumulated temperature above a base threshold, are important components of integrated pest management programmes for many pests (Riedl et al. Reference Riedl, Croft and Howitt1976; Welch et al. Reference Welch, Croft, Brunner and Michels1978; Esbjerg and Sigsgaard Reference Esbjerg and Sigsgaard2014; Nealis and Régnière Reference Nealis and Régnière2014; Hanson et al. Reference Hanson, Moon, Wright, Hunt and Hutchison2015). Behavioural adaptations and microclimatic conditions can cause differences between temperatures in a growing degree-day model and conditions experienced by insects, but over large temporal scales, these inaccuracies are minimal (Herms Reference Herms2004). For additional accuracy, some phenological models include other factors, such as photoperiod (Riedl and Croft Reference Riedl and Croft1978; Nielsen et al. Reference Nielsen, Chen and Fleischer2016) or moisture (Tauber et al. Reference Tauber, Tauber, Nyrop and Villani1998; Hodek Reference Hodek2003).
The wheat midge, Sitodiplosis mosellana Géhin (Diptera: Cecidomyiidae), is a major pest of wheat, Triticum spp. (Poaceae), in most wheat-growing regions of the world. The wheat midge was first reported in North America in 1828 in Québec, Canada (Felt 1921, as cited in Olfert et al. Reference Olfert, Mukerji and Doane1985) and has since spread across North America (Knodel and Ganehiarachchi Reference Knodel and Ganehiarachchi2008; Olfert et al. Reference Olfert, Elliott and Hartley2009). Originally Palaearctic in origin (Borkent Reference Borkent1989), wheat midge has spread to most wheat-growing regions, including China (Miao et al. Reference Miao, Wu, Gong, He, Duan and Jiang2013), the United Kingdom (Bruce et al. Reference Bruce, Hooper, Ireland, Jones, Martin and Smart2007), and Europe (El-Wakeil et al. Reference El-Wakeil, Abdel-Moniem, Gaafar and Volkmar2013). Wheat midge is univoltine across its range (Mukerji et al. Reference Mukerji, Olfert and Doane1988).
Wheat midge development depends upon environmental conditions. In Saskatchewan, Canada, wheat midge females fly and oviposit at sunset on warm nights when wind speeds are below 10 km/h (Pivnick and Labbé Reference Pivnick and Labbé1993). Wheat midge larvae feed on the exterior of wheat kernels as they develop inside the floret (Gagné and Doane Reference Gagné and Doane1999) until the third larval instar, when rain triggers them to leave the wheat head and drop to the soil (Mukerji et al. Reference Mukerji, Olfert and Doane1988). Wheat midge overwinters as a third-instar larva within a cocoon (Gagné and Doane Reference Gagné and Doane1999). In the fall, overwintering larval cocoons are found mostly within the top 0–6 cm of soil; however, some cocoons occur as deep as 15 cm within the soil (Doane and Olfert Reference Doane and Olfert2008). There is an obligatory diapause period in the third larval instar of at least 70 days below 2 °C in North America (Hinks and Doane Reference Hinks and Doane1988) or 3–4 months below 10 °C in Germany (Basedow and Gillich Reference Basedow and Gillich1982). In Germany, wheat midge larvae experience variable overwintering mortality ranging from 0 to 64% (Basedow and Gillich Reference Basedow and Gillich1982). In western Canada, an average of 218 growing degree-days above a base threshold of 3 °C is required for larvae to break diapause (Doane and Olfert Reference Doane and Olfert2008) and 250 growing degree-days above 3 °C in Belgium (Jacquemin et al. Reference Jacquemin, Chavalle and De Proft2014). Larvae can remain in diapause for up to 13 years if moisture conditions are inadequate, but in western Canada, 95% of midges will emerge after one winter with adequate soil moisture (Basedow and Gillich Reference Basedow and Gillich1982; Wise and Lamb Reference Wise and Lamb2004; Cheng et al. Reference Cheng, Long, Zhang, Liang and Zhu-Salzman2017). Emergence of adult midges increases when overwintering larvae are exposed to 20–50% soil moisture (Cheng et al. Reference Cheng, Long, Zhang, Liang and Zhu-Salzman2017). Adult emergence after overwintering decreases at temperatures below 10 °C (Wise and Lamb Reference Wise and Lamb2004) or above 30 °C (Cheng et al. Reference Cheng, Long, Zhang, Liang and Zhu-Salzman2017). In Belgium, adults require an inductive rainfall (minimum 1.2 L/m2) to pupate (Jacquemin Reference Jacquemin2014; Jacquemin et al. Reference Jacquemin, Chavalle and De Proft2014).
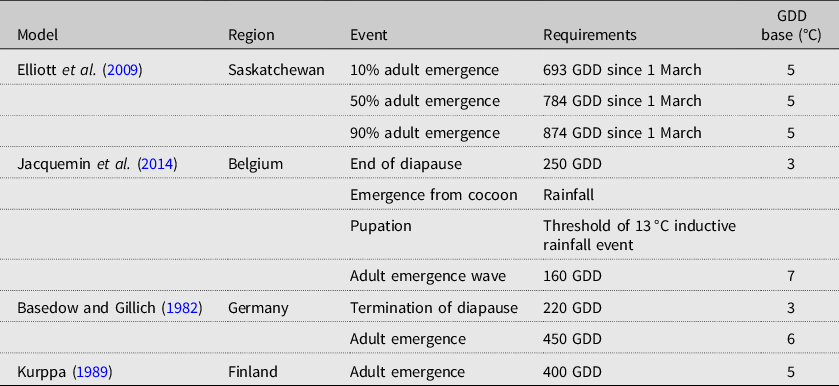
Multiple developmental models have been applied to different wheat midge populations. Models from Germany (Basedow and Gillich Reference Basedow and Gillich1982), Finland (Kurppa Reference Kurppa1989), the United Kingdom (Oakley et al. Reference Oakley, Cumbleton, Corbett, Saunders, Green, Young and Rodgers1998), Belgium (Jacquemin et al. Reference Jacquemin2014), and Saskatchewan, Canada (Elliott et al. Reference Elliott, Mann and Olfert2009) have been developed (Table 1). Different base temperatures used in the various models range from 5 °C to 9 °C (Table 1). Most models predict adult emergence with degree-day accumulation over the growing season, including the Elliott model from Saskatchewan (Elliott et al. Reference Elliott, Mann and Olfert2009). The Jacquemin model, developed in Belgium, describes wheat midge adult emergence as “waves” that occur a set number of degree-days after inductive rainfall events (Jacquemin et al. Reference Jacquemin2014). All European emergence models predict earlier adult wheat midge emergence than the Canadian models do (Table 1).
Available phenological models of wheat midge emergence in the scientific literature.
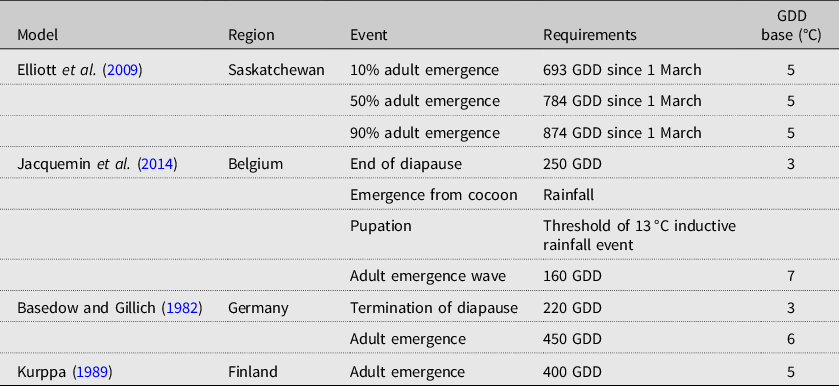
GDD, growing degree-days.
Wheat midge emergence coincides with susceptible stages of wheat, which also vary across the cereal’s production range. Wheat is susceptible to midge after wheat head emergence but not after anthesis (Ding and Lamb Reference Ding and Lamb1999). Wheat midge adults typically emerge from mid-May to mid-June in Europe (Basedow and Gillich Reference Basedow and Gillich1982; Oakley et al. Reference Oakley, Cumbleton, Corbett, Saunders, Green, Young and Rodgers1998; Jacquemin et al. Reference Jacquemin2014), from late April to early May in China (Cheng et al. Reference Cheng, Long, Zhang, Liang and Zhu-Salzman2017), and from early to mid-July in Canada (Lamb et al. Reference Lamb, Wise, Olfert, Gavloski and Barker1999; Elliott et al. Reference Elliott, Mann and Olfert2009). In Europe, wheat midge infests winter-sown wheat (El-Wakeil et al. Reference El-Wakeil, Abdel-Moniem, Gaafar and Volkmar2013). In North America, infestation occurs mainly in spring-sown wheat (Dexter et al. Reference Dexter, Preston, Cooke, Morgan, Kruger, Kilborn and Elliott1987), which emerges and flowers later in the season than winter wheat does.
Wheat midge biology has not been examined in the northernmost part of its North American range, the Peace River region of Alberta, Canada. Wheat midge recently expanded into the Peace River region, where it was first reported in 2011 (Meers Reference Meers2011). The developmental model used in Saskatchewan does not appear to accurately fit patterns of midge emergence observed in this region. Additionally, rainfall as an inductive event that results in “waves” of wheat midge emergence has not been studied in Canada. The present study assesses these response differences in wheat midge biology that occur in the Peace River region, with their implications for integrated pest management strategies.
Methods
The timing of adult wheat midge emergence was tested in situ to determine the ability of the existing bioclimatic models to predict midge emergence in wheat-growing areas (55° to 59° N by –116° to –118° W) of Alberta’s Peace River region, Canada. Within each year, distances between field sites ranged from 20 to 300 km. In the first year of the study, fields that had the highest number of midge cocoons in fall soil cores were selected. In each following year, fields adjacent to the previous-year field sites were selected for monitoring. This allowed monitoring of the same initially higher populations of wheat midge and allowed for consistent distances from weather stations. Day length in this area is approximately 18 hours on 1 July. The experiment was conducted at commercial field sites that were seeded with wheat during the previous year. Monitoring was conducted between 20 June and 5 August at seven sites in 2016, between 6 June and 9 August at four sites in 2017, and between 6 June and 9 August at four sites in 2018.
Midge-emergence timing was determined using plastic emergence traps constructed from 2-L plastic pails (Plastipak™, Boucherville, Québec, Canada) with the bottoms cut off (Doane and Olfert Reference Doane and Olfert2008). Ventilation holes were cut in the sides of each bucket (3 cm × 2.54 cm in diameter) and in the accompanying lids (1 cm × 5.08 cm in diameter) and lined with fine mesh. Each individual trap sampled 174.37 cm2 of the soil surface. A single clear polyethylene strip coated with Stikem special™ (Scotts Canada, Mississauga, Ontario, Canada; 14 cm × 5 cm sticky surface) was secured under the lid of each trap to capture emerging wheat midge adults. Traps were placed with the bottom 7.6 cm of each bucket buried in the soil. Traps were positioned 10 m apart along a north–south linear transect within each field along the first row of wheat stubble from the field margin. In 2016, eight traps were placed in each field. Due to low midge capture in emergence traps in 2016, 20 traps were placed in each field in both 2017 and 2018.
Collection strips were removed and replaced every two to seven days, weather permitting, during the putative flight period (June–July). Strips were examined under a dissecting stereomicroscope (Zeiss™ Stemi-C, Oberkochen, Baden-Württemberg, Germany) at 8 × magnification, and wheat midge adults were identified based on antennal morphology (Harris Reference Harris1966), then counted and separated by sex.
Soil temperature was recorded 2 cm below the soil surface with Onset ™ Tidbit v2 data loggers (Hoskins Scientific, Edmonton, Alberta, Canada) every 15 minutes from 13 May until 5 August in 2016, from 11 May until 14 August in 2017, and from 8 May until 9 August in 2018. Air temperature was recorded 1 m above the ground with Onset ™ Tidbit v2 data loggers inside Onset RS1 solar shields (Hoskins Scientific). Air temperature was collected from 8 May until 9 August in 2018 and from 30 May until 14 August in 2017. In 2016, daily maximum and minimum air temperatures were provided by Alberta Agriculture and Forestry, Alberta Climate Information Service, https://acis.alberta.ca [accessed July 2020]. Alberta Agriculture and Forestry weather stations were located 6–26 km from field sites. Dates of rainfall events were determined using daily precipitation data from those same weather stations. Accumulated rainfall was recorded with Onset™ plastic rain gauges (Hoskins Scientific) weekly during the same periods when weather did not prohibit site access.
Statistical analysis for wheat midge emergence
To test for agreement between dates of adult emergence predicted by the various published models and those observed in this study, observed dates were regressed on predicted dates (Piñeiro et al. Reference Piñeiro, Perelman, Guerschman and Paruelo2008). Day of year was used in the analyses rather than growing degree-day values in order to include variation in predicted emergence amongst sites, which was necessary to analyse model fit through a regression approach.
To determine predicted day of year of emergence, dates of growing degree-day accumulation required for emergence events for the Elliott model (Elliott et al. Reference Elliott, Mann and Olfert2009) and for the Jacquemin model (Jacquemin et al. Reference Jacquemin2014) were determined. The Elliott model predicts 10% cumulative emergence at 693 GDD and 50% at 784 GDD base 5 °C (Elliott et al. Reference Elliott, Mann and Olfert2009). The Jacquemin model predicts waves of emergence at 160 GDD base 7 °C after a rainfall event (once a baseline of 230 GDD base 3 °C and a threshold of 13 °C have been reached). Growing degree-day values with a base of 3 °C, 5 °C, and 7 °C were calculated from maximum and minimum temperature values using a modified sine-wave method (Allen Reference Allen1975) and half-day intervals. For the Elliott model, dates of 693 and 784 GDD base 5 °C accumulation were determined for each site. To determine the observed dates of 10 and 50 % emergence, the cumulative percentages of total female emergence (in 2016) and male and female emergence (in 2017 and 2018) were calculated for each site. In 2016, only female emergence was used because male counts from the first two weeks of collection were lost. The dates of 10 and 50% emergence were estimated by linear interpolation using the ‘approx.’ function in R Studio, version 3.13 (R Core Team 2016). For the Jacquemin model, dates of peaks of emergence were determined for all sites. Two clear emergence peaks were observed at some field sites, although in Belgium, more than two peaks occur per season. Dates of accumulated 160 GDD above a base temperature of 7 °C after the first and second inductive rainfall events (2–25 mm) were determined for each site. The Jacquemin model reported inductive rainfall events ranging from 1.2 to 22.2 L/m2, although 1.2 L/m2 resulted in lower numbers of emerged midges (Jacquemin et al. Reference Jacquemin2014). Rainfall events were considered inductive after temperatures exceeded the threshold of 13 °C, and 250 GDD (base 3 °C) had accumulated beginning 1 January. All field sites received non-inductive precipitation before the temperature requirements were met. Sites with less than 10 midges collected during the season were excluded from analysis. Calendar dates were converted to day of year format by subtracting the date from a date stamp of 31 December the previous year.
All statistical analyses were conducted in R Studio, version 3.13 (R Core Team 2016). Linear mixed models were fit with lme4 (Bates et al. Reference Bates, Mächler, Bolker and Walker2014). Separate models were run for predicted dates determined from soil or air temperature and for different emergence events (10 and 50% cumulative emergence, or separate emergence peaks). For all models, observed day of year was modelled with predicted day of year as a fixed factor and with year as a random factor. Normality of model residuals was examined visually using q–q plots and confirmed with Shapiro–Wilks tests. Marginal r 2 values were calculated as per Nakagawa and Schielzeth (Reference Nakagawa and Schielzeth2013) using the MuMIN package (Barton Reference Barton2018). To determine whether the predicted day of year significantly influenced model fit, models containing both fixed and random effects were compared to models containing only the random effect using likelihood ratio tests (using the analysis of variance function from the car package (Fox and Weisburg Reference Fox and Weisberg2011)) and Akaike information criterion (AIC) values. Concordance correlation coefficients were calculated as a relative measure of both model accuracy (differences between model prediction and observed values, as determined by deviation of regression line of best fit slope from 45 °) and model precision (residual variation between values and the regression line of best fit). Concordance correlation coefficient values can range from –1, indicating perfect disagreement between predicted and observed values, to +1, indicating perfect agreement between predicted and observed values. Concordance correlation coefficient values of 0 indicate a lack of precision and accuracy, while values of 0.90 or greater indicate very strong agreement. Concordance correlation coefficient values were determined using variance components using the CCRM package (Carrasco and Jover Reference Carrasco and Jover2003).
Results
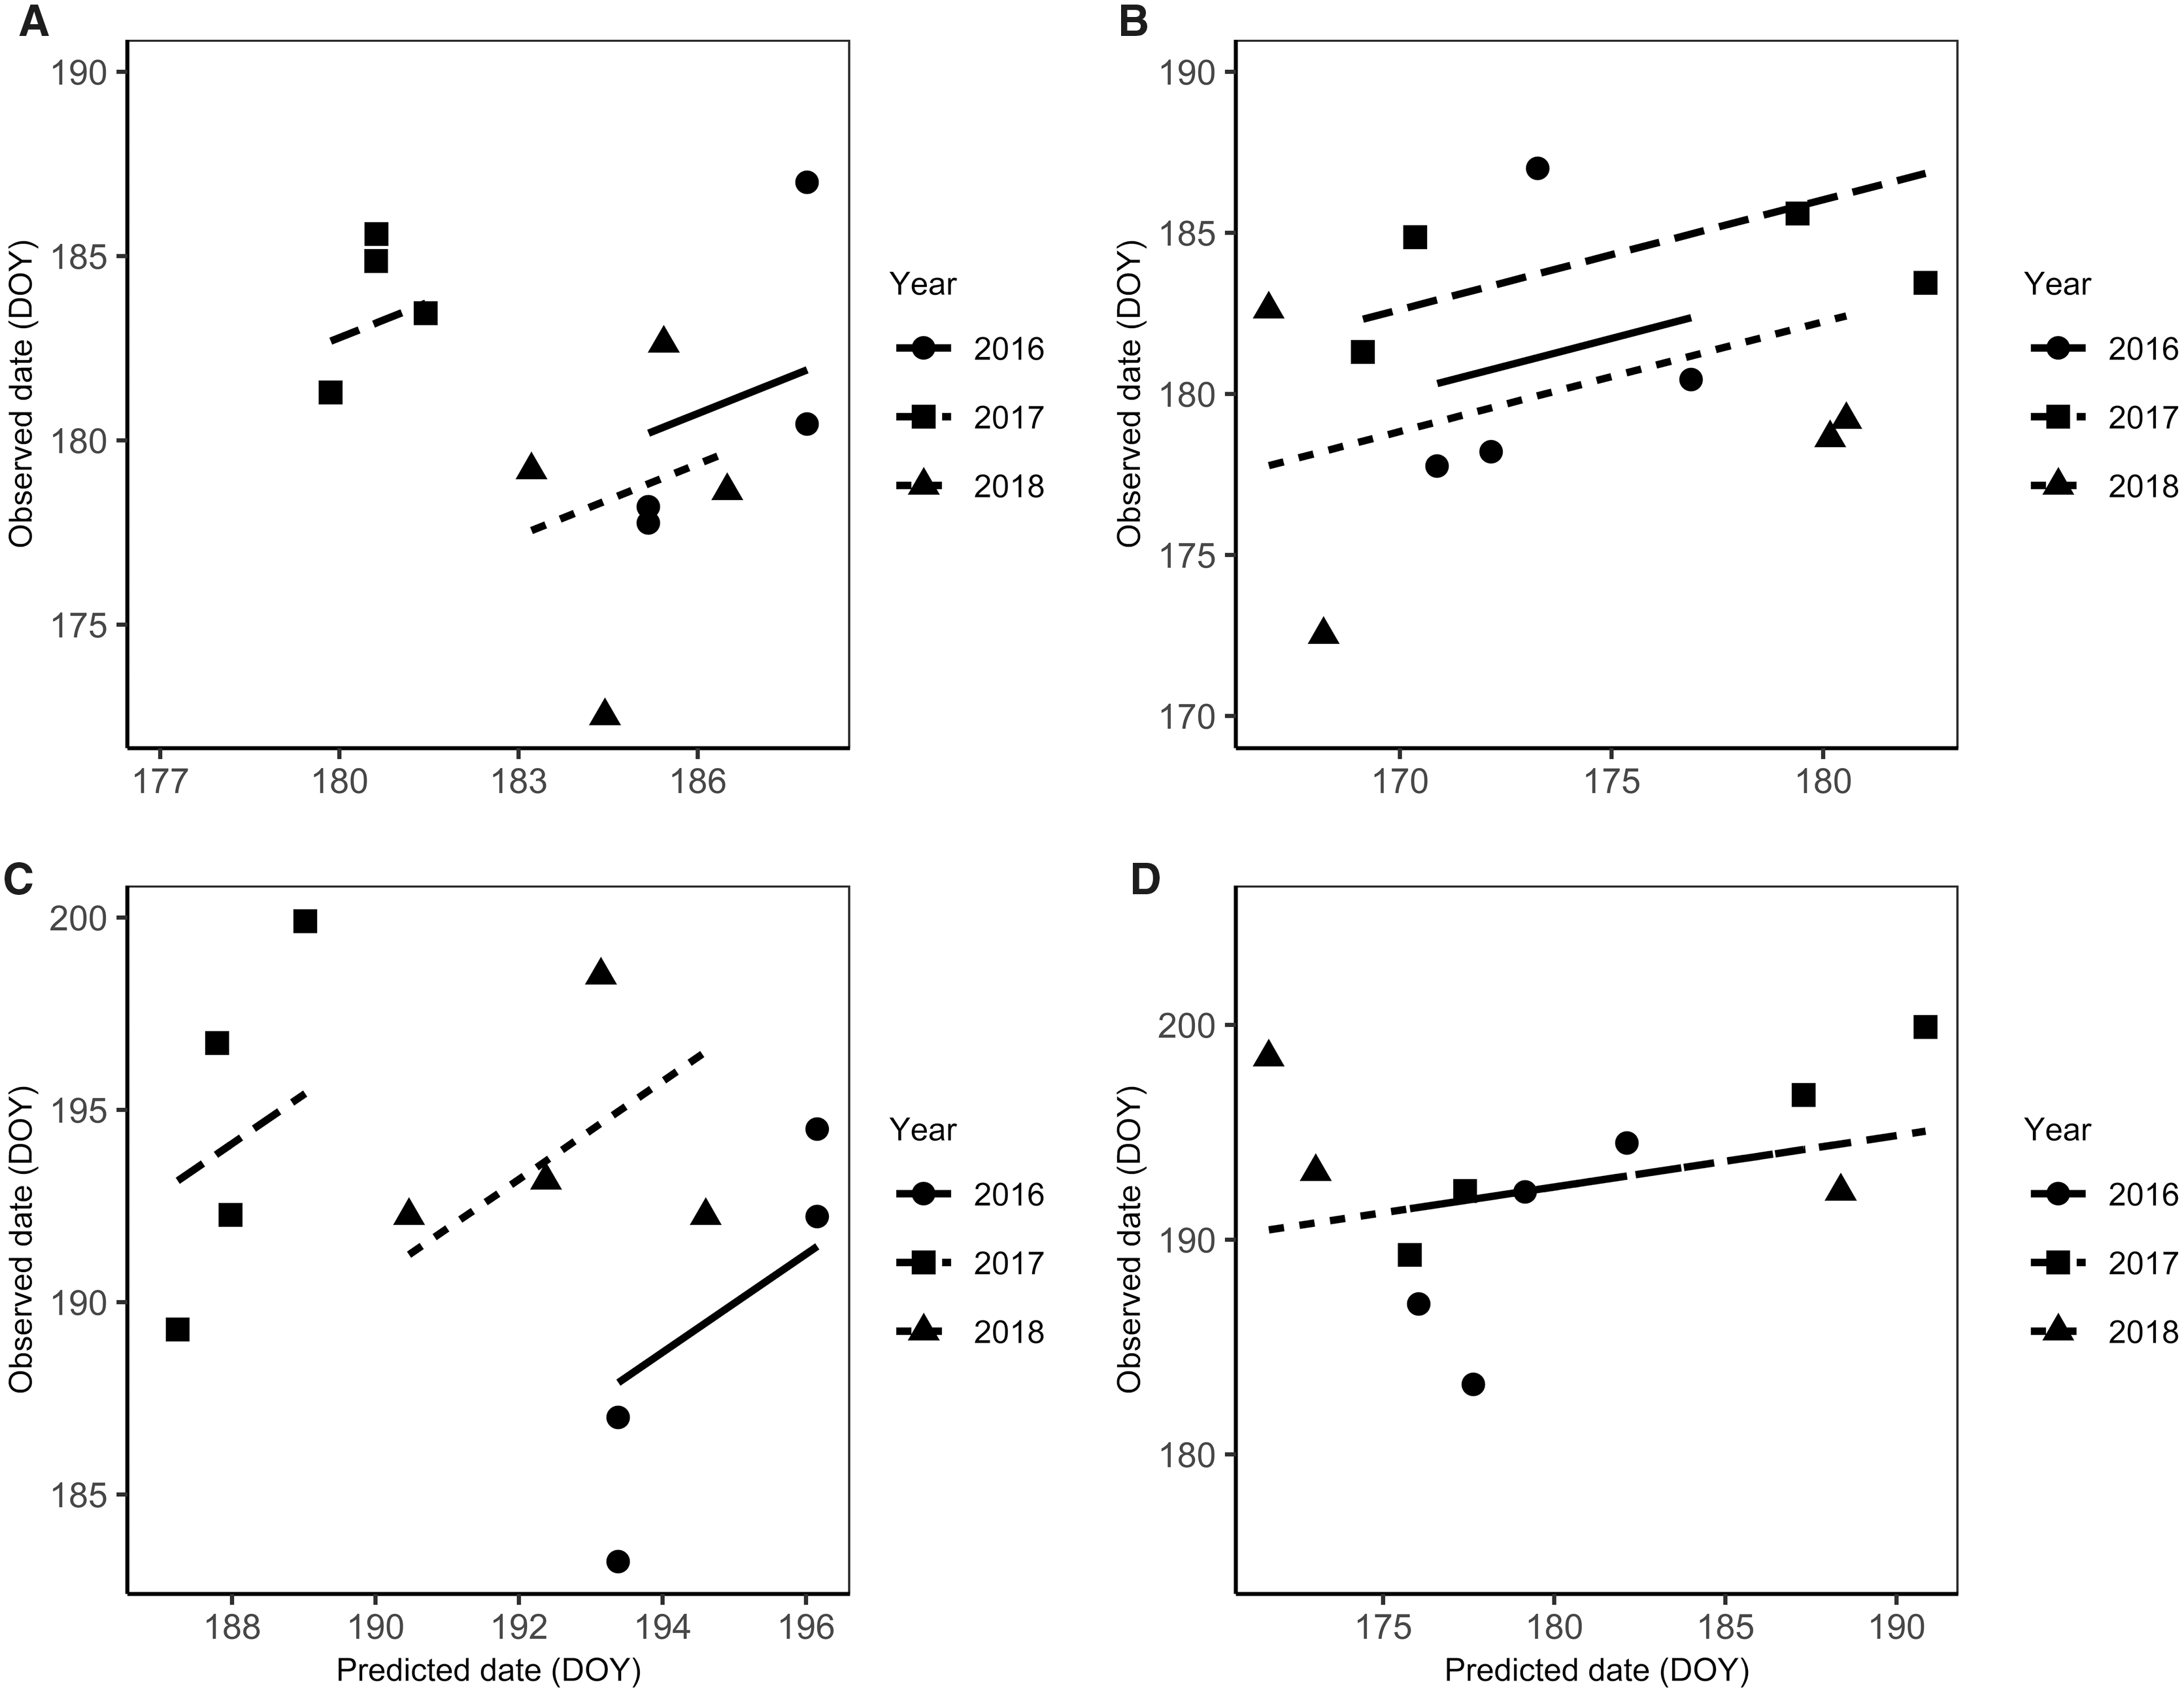
The Elliott model (Elliott et al. Reference Elliott, Mann and Olfert2009) better predicted dates of early and mid-season wheat midge adult emergence in the field within the Peace River region of Alberta, Canada than the Jacquemin model (Jacquemin et al. Reference Jacquemin2014) did, using either air or soil temperature (Table 2). An input of air temperature into the Elliott model more accurately predicted early and mid-season adult emergence than an input of soil temperature did. The mean differences between the predicted and observed values were smaller when air temperature was input. Precision was similarly low for models using soil temperature (r 2 = 0.04 for 10% emergence; r 2 = 0.02 for 50% emergence) and models using air temperature (r 2 = 0.09 for 10% emergence; r 2 = 0.09 for 50% emergence) (Fig. 1B and D). Likelihood ratio tests comparing predictions of emergence dates using soil temperature to null models showed that the relationship between predicted and observed dates was not significant for both 10% (χ 2 = 0.485, df = 1, P = 0.486, AIC null = 72.32, AIC full = 73.84) and 50% emergence (χ 2 = 0.578, df = 1, P = 0.447, AIC null = 80.50, AIC full = 81.92). Likewise, models of observed emergence as a function of predictions of emergence date using air temperature were not significantly different from null models for 10% (χ 2 = 0.381, df = 1, P = 0.537, AIC null = 72.32, AIC full = 73.94) or 50% emergence (χ 2 = 0, df = 1, P = 1.00, AIC null = 74.79, AIC full = 81.76). Using soil temperatures, the models predicted earlier emergence than what was observed in the field (Table 2). Using air temperature, the Elliott model predicted 10 and 50% emergence that was earlier than was observed in 2017 and later than was observed in both 2016 and 2018, which together contributed to low overall model precision (Fig. 1A and C). Deviation between predicted and observed values was closest for the Elliott model for 50% emergence using air temperature. Mean 10% emergence was 3.04 days later than predicted (standard deviation = 5.43), and 50% emergence was only 0.8 days earlier than predicted (standard deviation = 6.12) when the observed emergence was compared to the Elliott model results. Concordance correlation coefficients were low for all models, and all 95% confidence intervals included 0 (Table 2), indicating that agreement between observed and predicted values was low for all models.
Comparison of wheat midge adult emergence under field conditions to those predicted using published models (Elliott et al., Reference Elliott, Mann and Olfert2009; Jacquemin et al., Reference Jacquemin2014). Emergence was determined by the presence of wheat midge adults on sticky strips placed in plastic emergence bucket traps (n = 8 per field in 2016; n = 20 per field in 2017 and 2018).

GDD, growing degree-days; DOY, day of year; CCC, concordance correlation coefficients; SD, standard deviation; CI, confidence interval.
Linear regressions of observed adult wheat midge emergence dates (DOY, date of year) on dates (DOY) of necessary growing degree-day (GDD) accumulation predicted by the Elliott model for: A, 10% male and female wheat midge emergence using air temperature (n = 8 field sites); B, 10% female wheat midge emergence using soil temperature (n = 12 field sites); C, 50% male and female wheat midge emergence using air temperature (n = 8 field sites); D, 50% female emergence using soil temperature (n = 12 field sites). Dates of 10 and 50% observed emergence were determined using linear interpolation based on cumulative counts of midge emerged in plastic emergence traps (n = 20 traps per site for 2017–2018; n = 8 traps per site for 2016). Black lines are linear regression lines for each year. Different symbols represent different years.

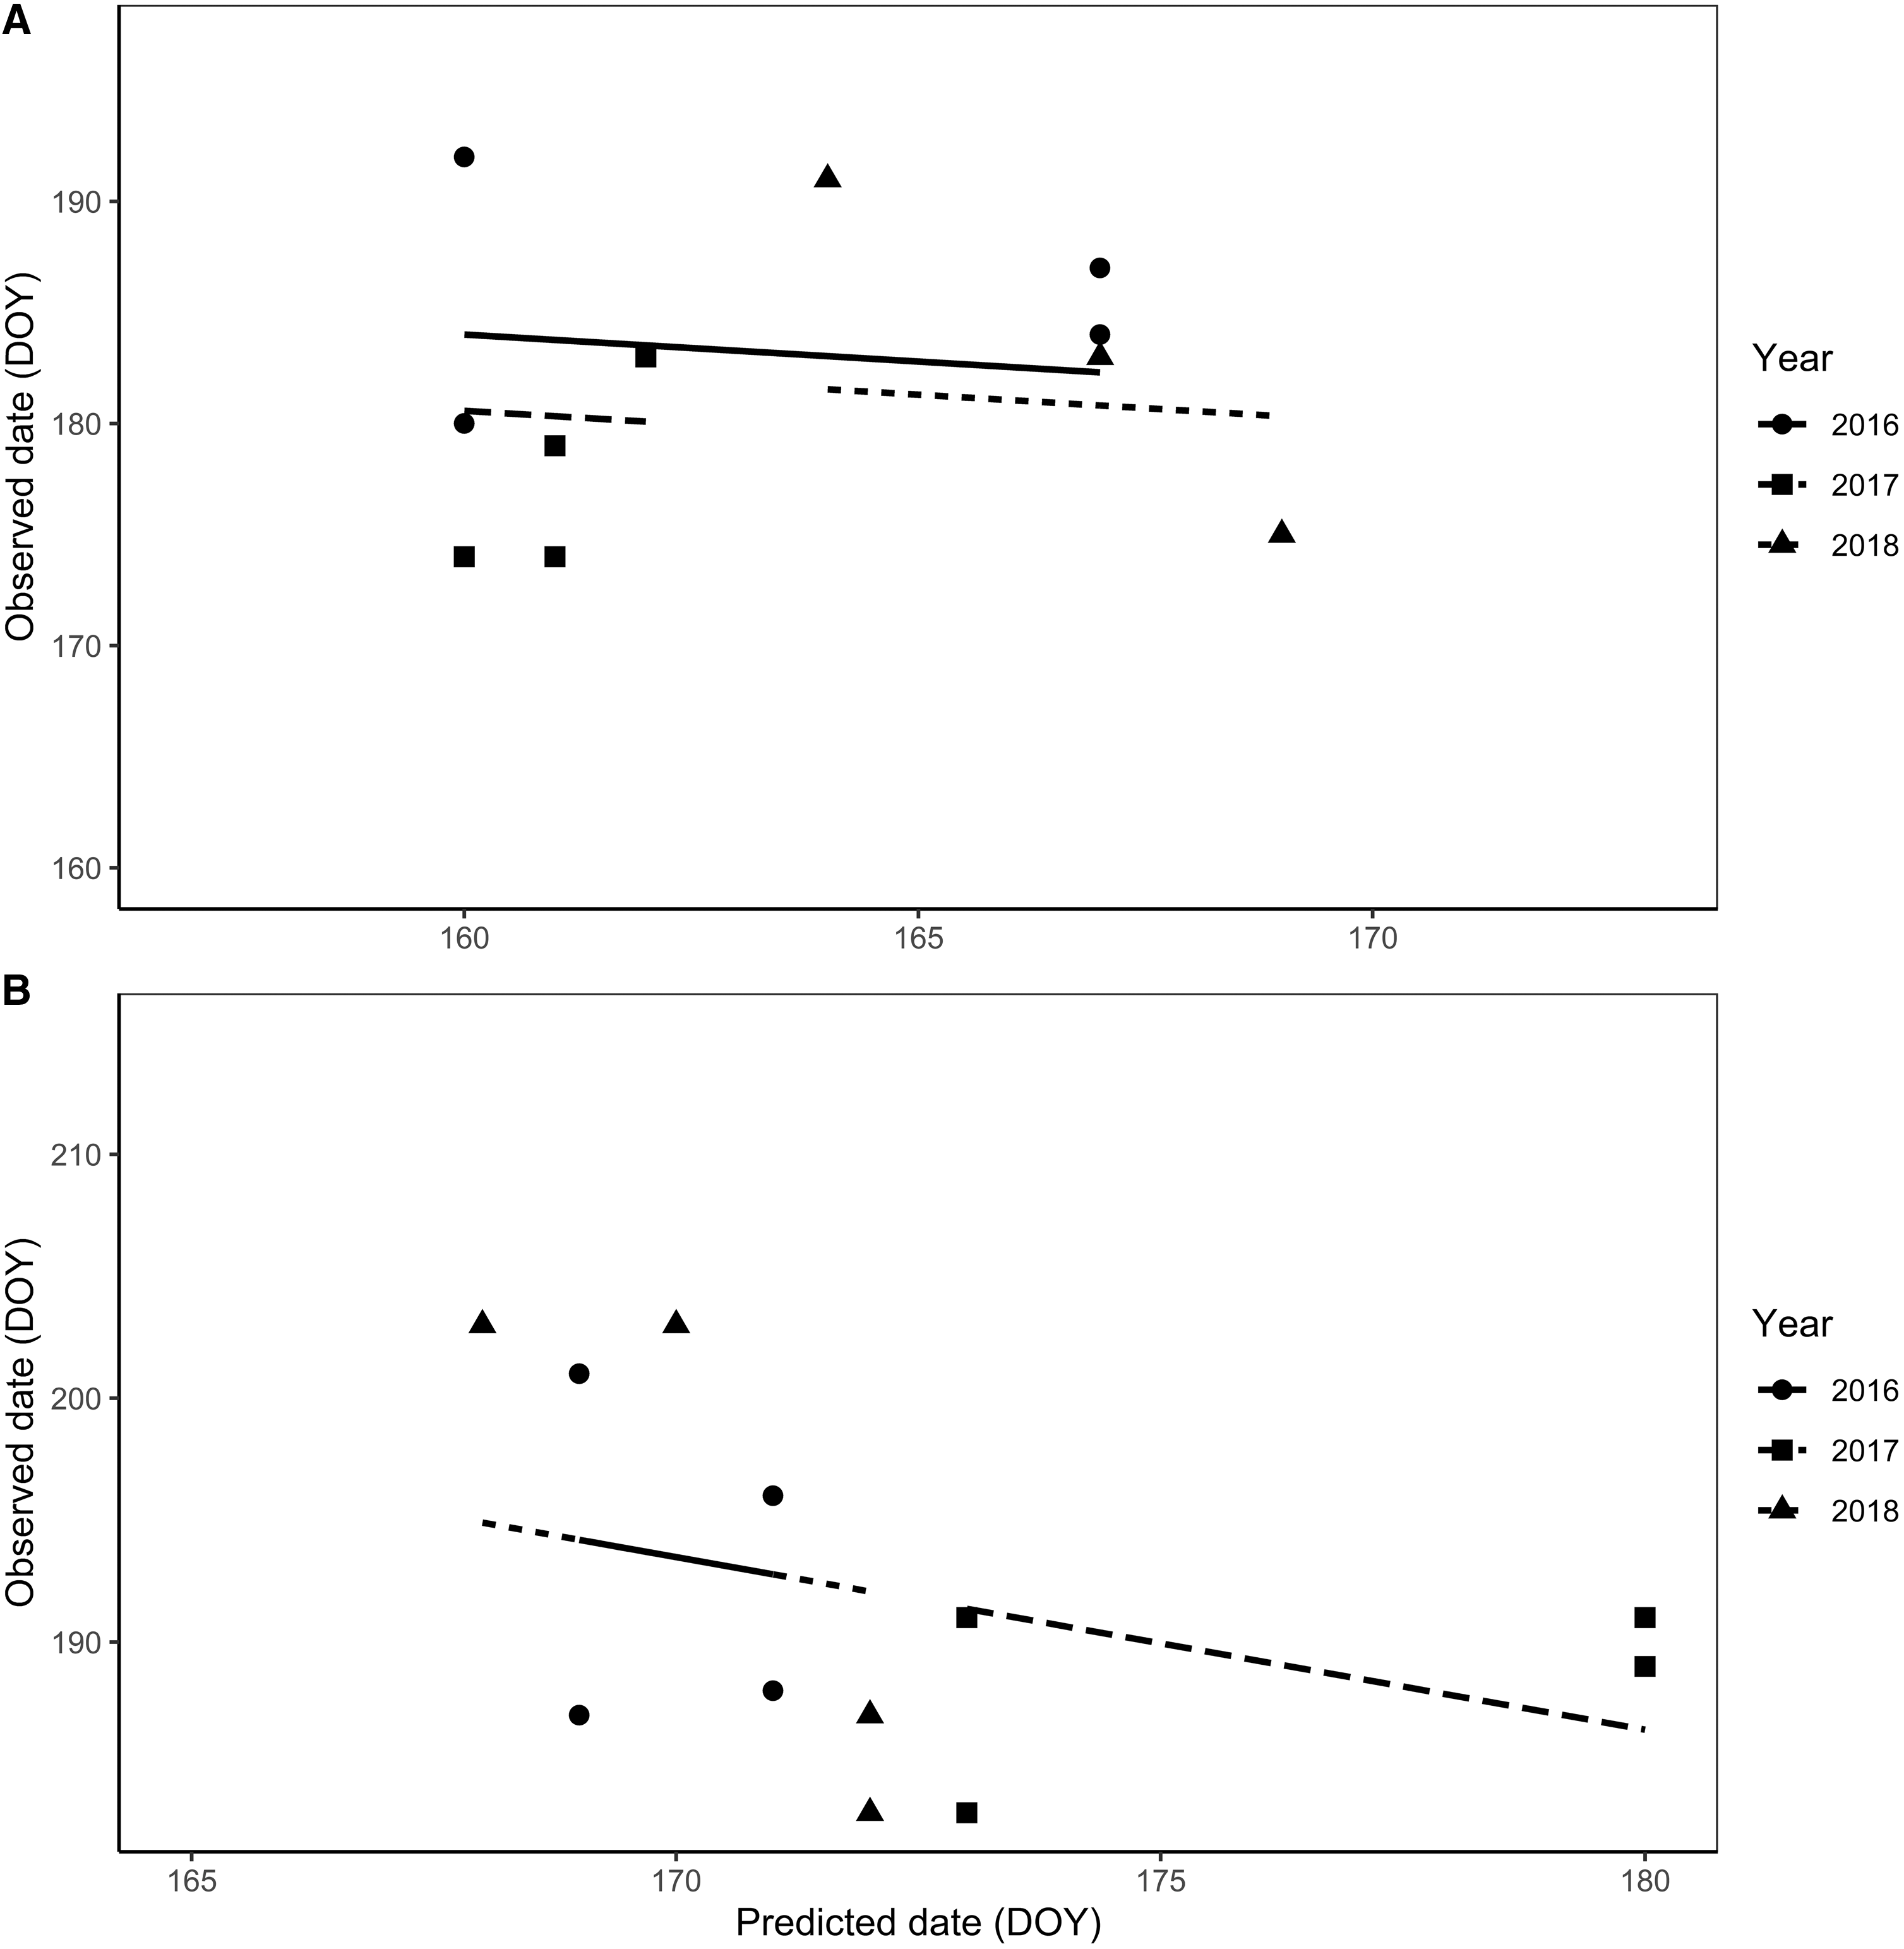
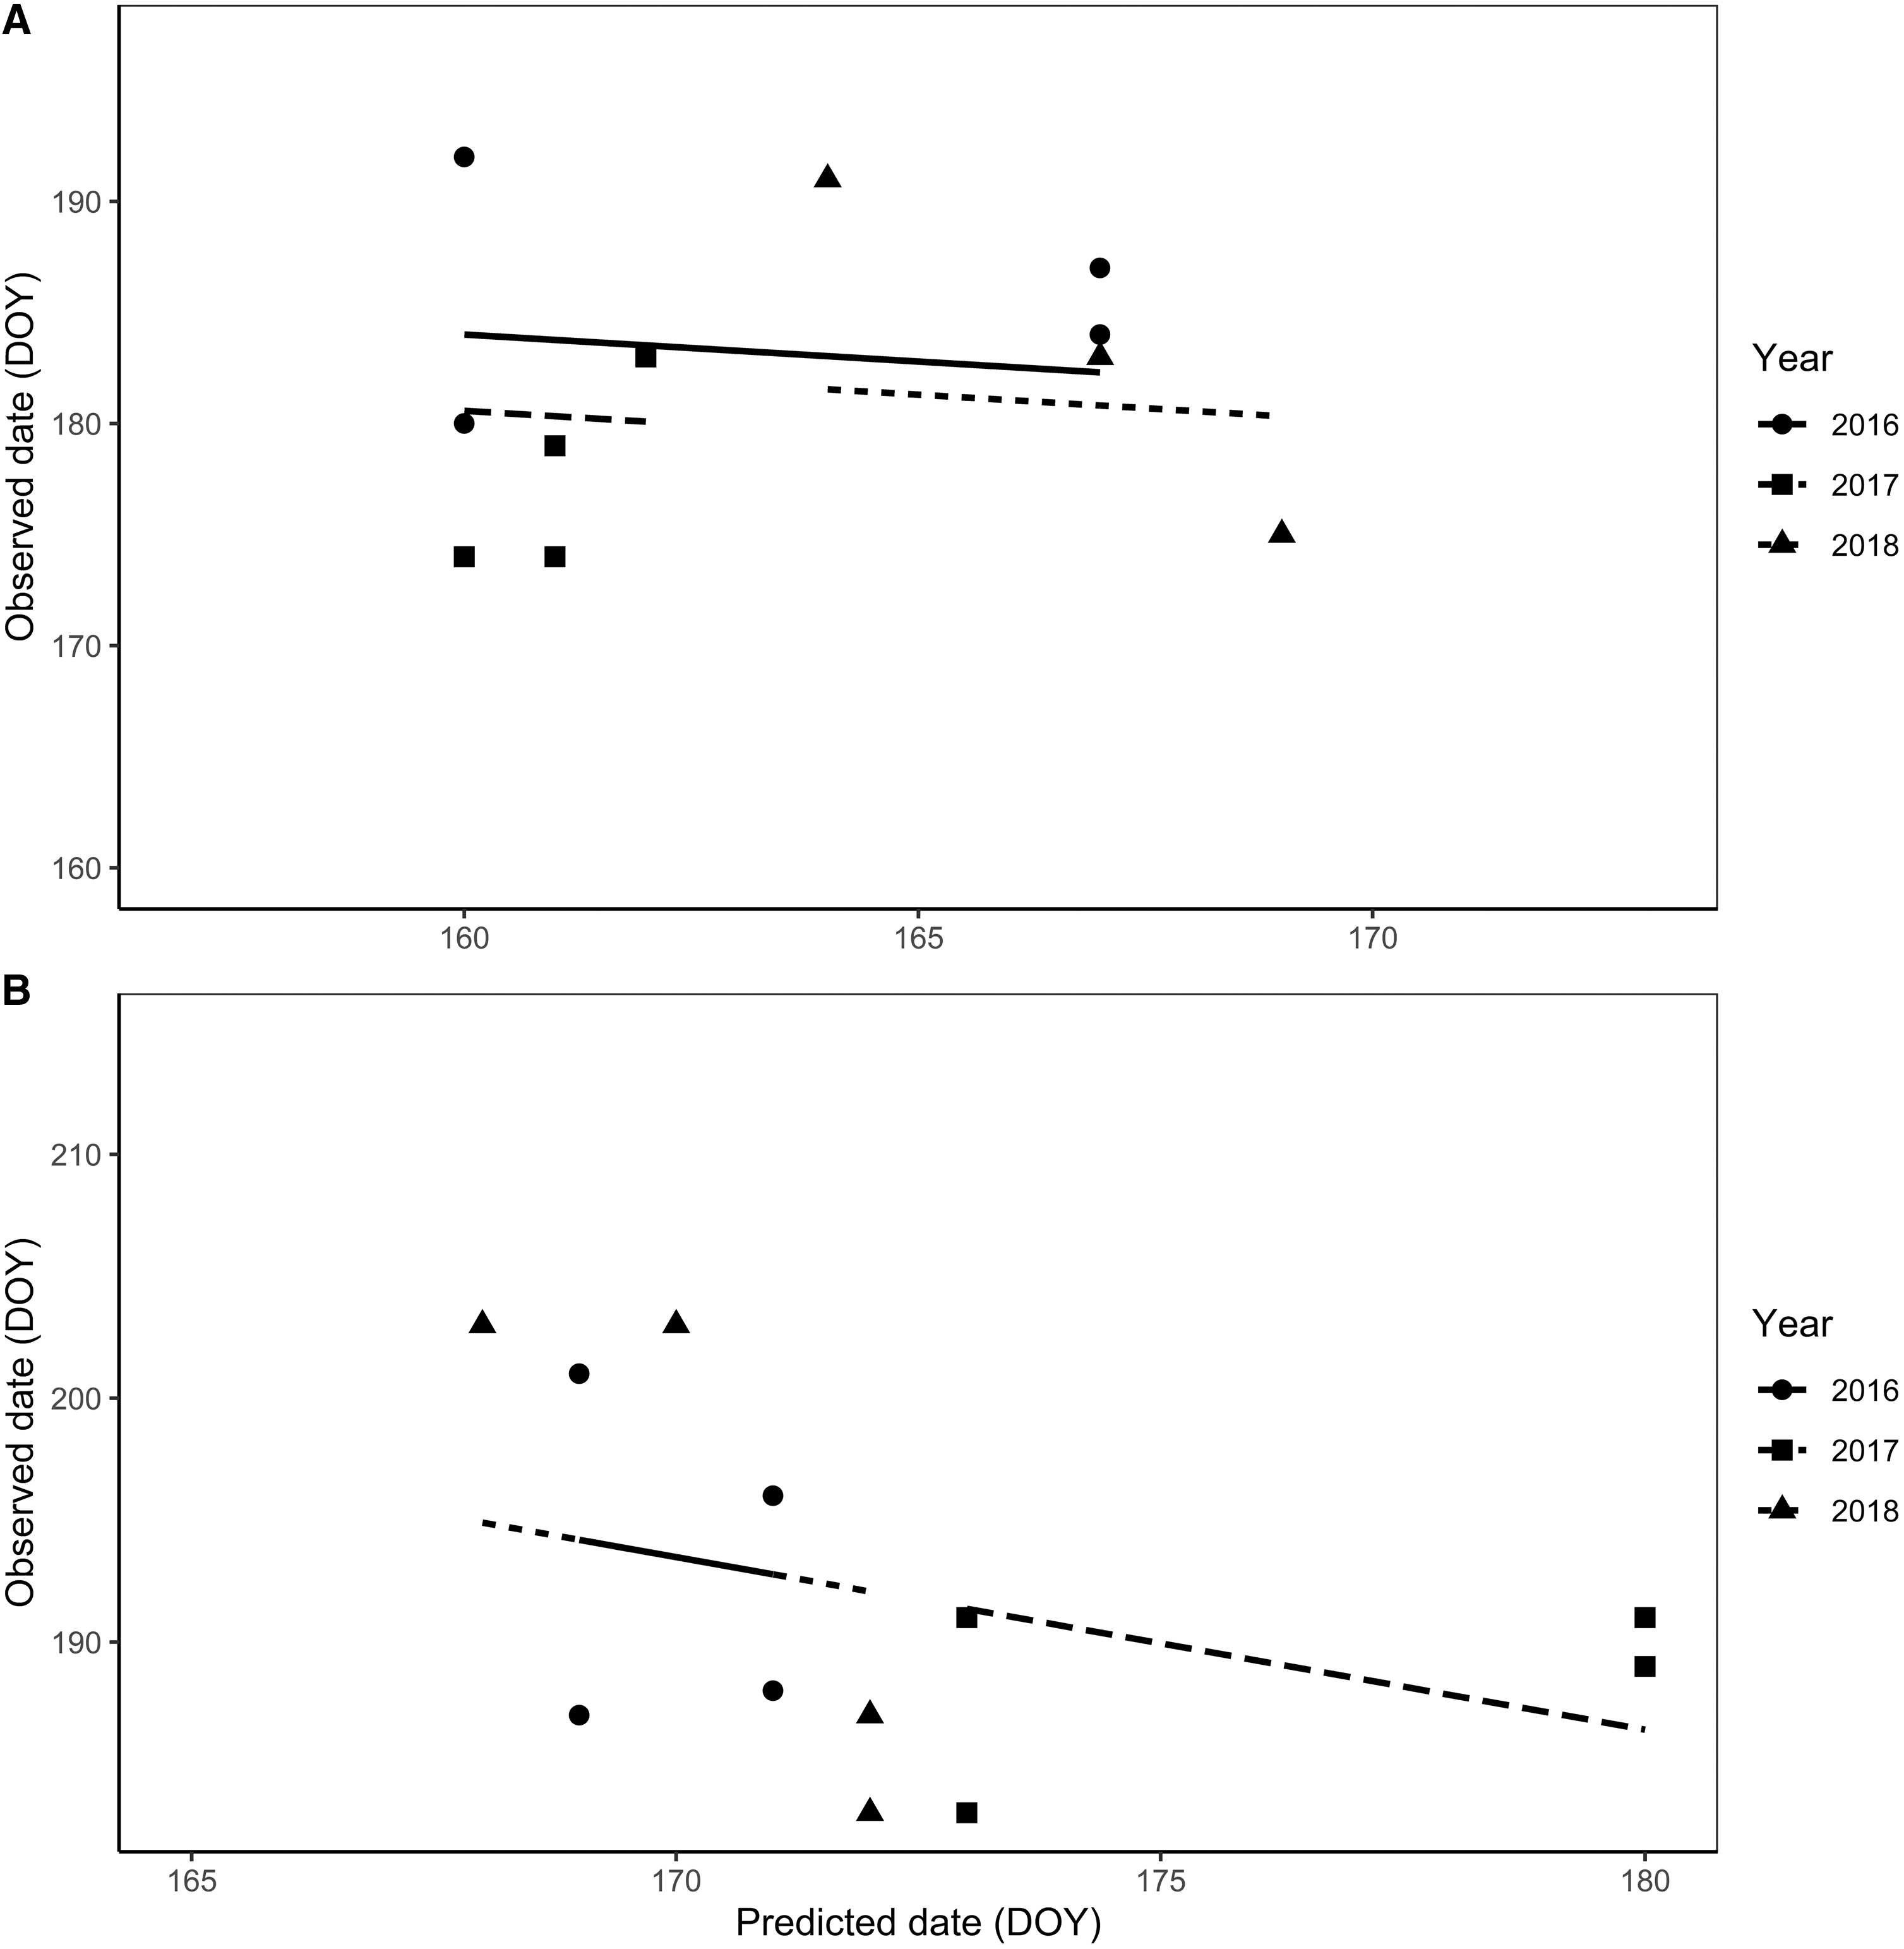
In all years, the Jacquemin model predicted earlier peaks of emergence than were observed for both first (Fig. 2A) and second (Fig. 2B) waves of emergence. Null models of observed emergence did not significantly differ from models between predicted and observed dates of first peak of emergence (χ 2 = 0.026, df = 1, P = 0.871, AIC null = 83.37, AIC full = 85.20) or second peak of emergence (χ 2 = 1.89, df = 1, P = 0.168, AIC null = 86.54, AIC full = 86.65). Concordance correlation coefficients were low for all models, and all 95% confidence intervals included 0 (Table 2), indicating that agreement between observed and predicted values was low for all models.
Linear regressions of observed adult wheat midge emergence dates (DOY, date of year) on dates (DOY) of necessary growing degree-day (GDD) accumulation predicted by the Jacquemin model for: A, first peak of male and female wheat midge emergence using air temperature (n = 8 field sites); B, first peak of female wheat midge emergence using soil temperature (n = 12 field sites); C, second peak of male and female wheat midge emergence using air temperature (n = 8 field sites); D, second peak of female emergence using soil temperature (n = 12 field sites) using linear interpolation based on cumulative counts of midges emerged in plastic emergence traps (n = 20 traps per site for 2017–2018; n = 8 traps per site for 2016). Black lines are linear trend lines for each year. Different symbols represent different years.
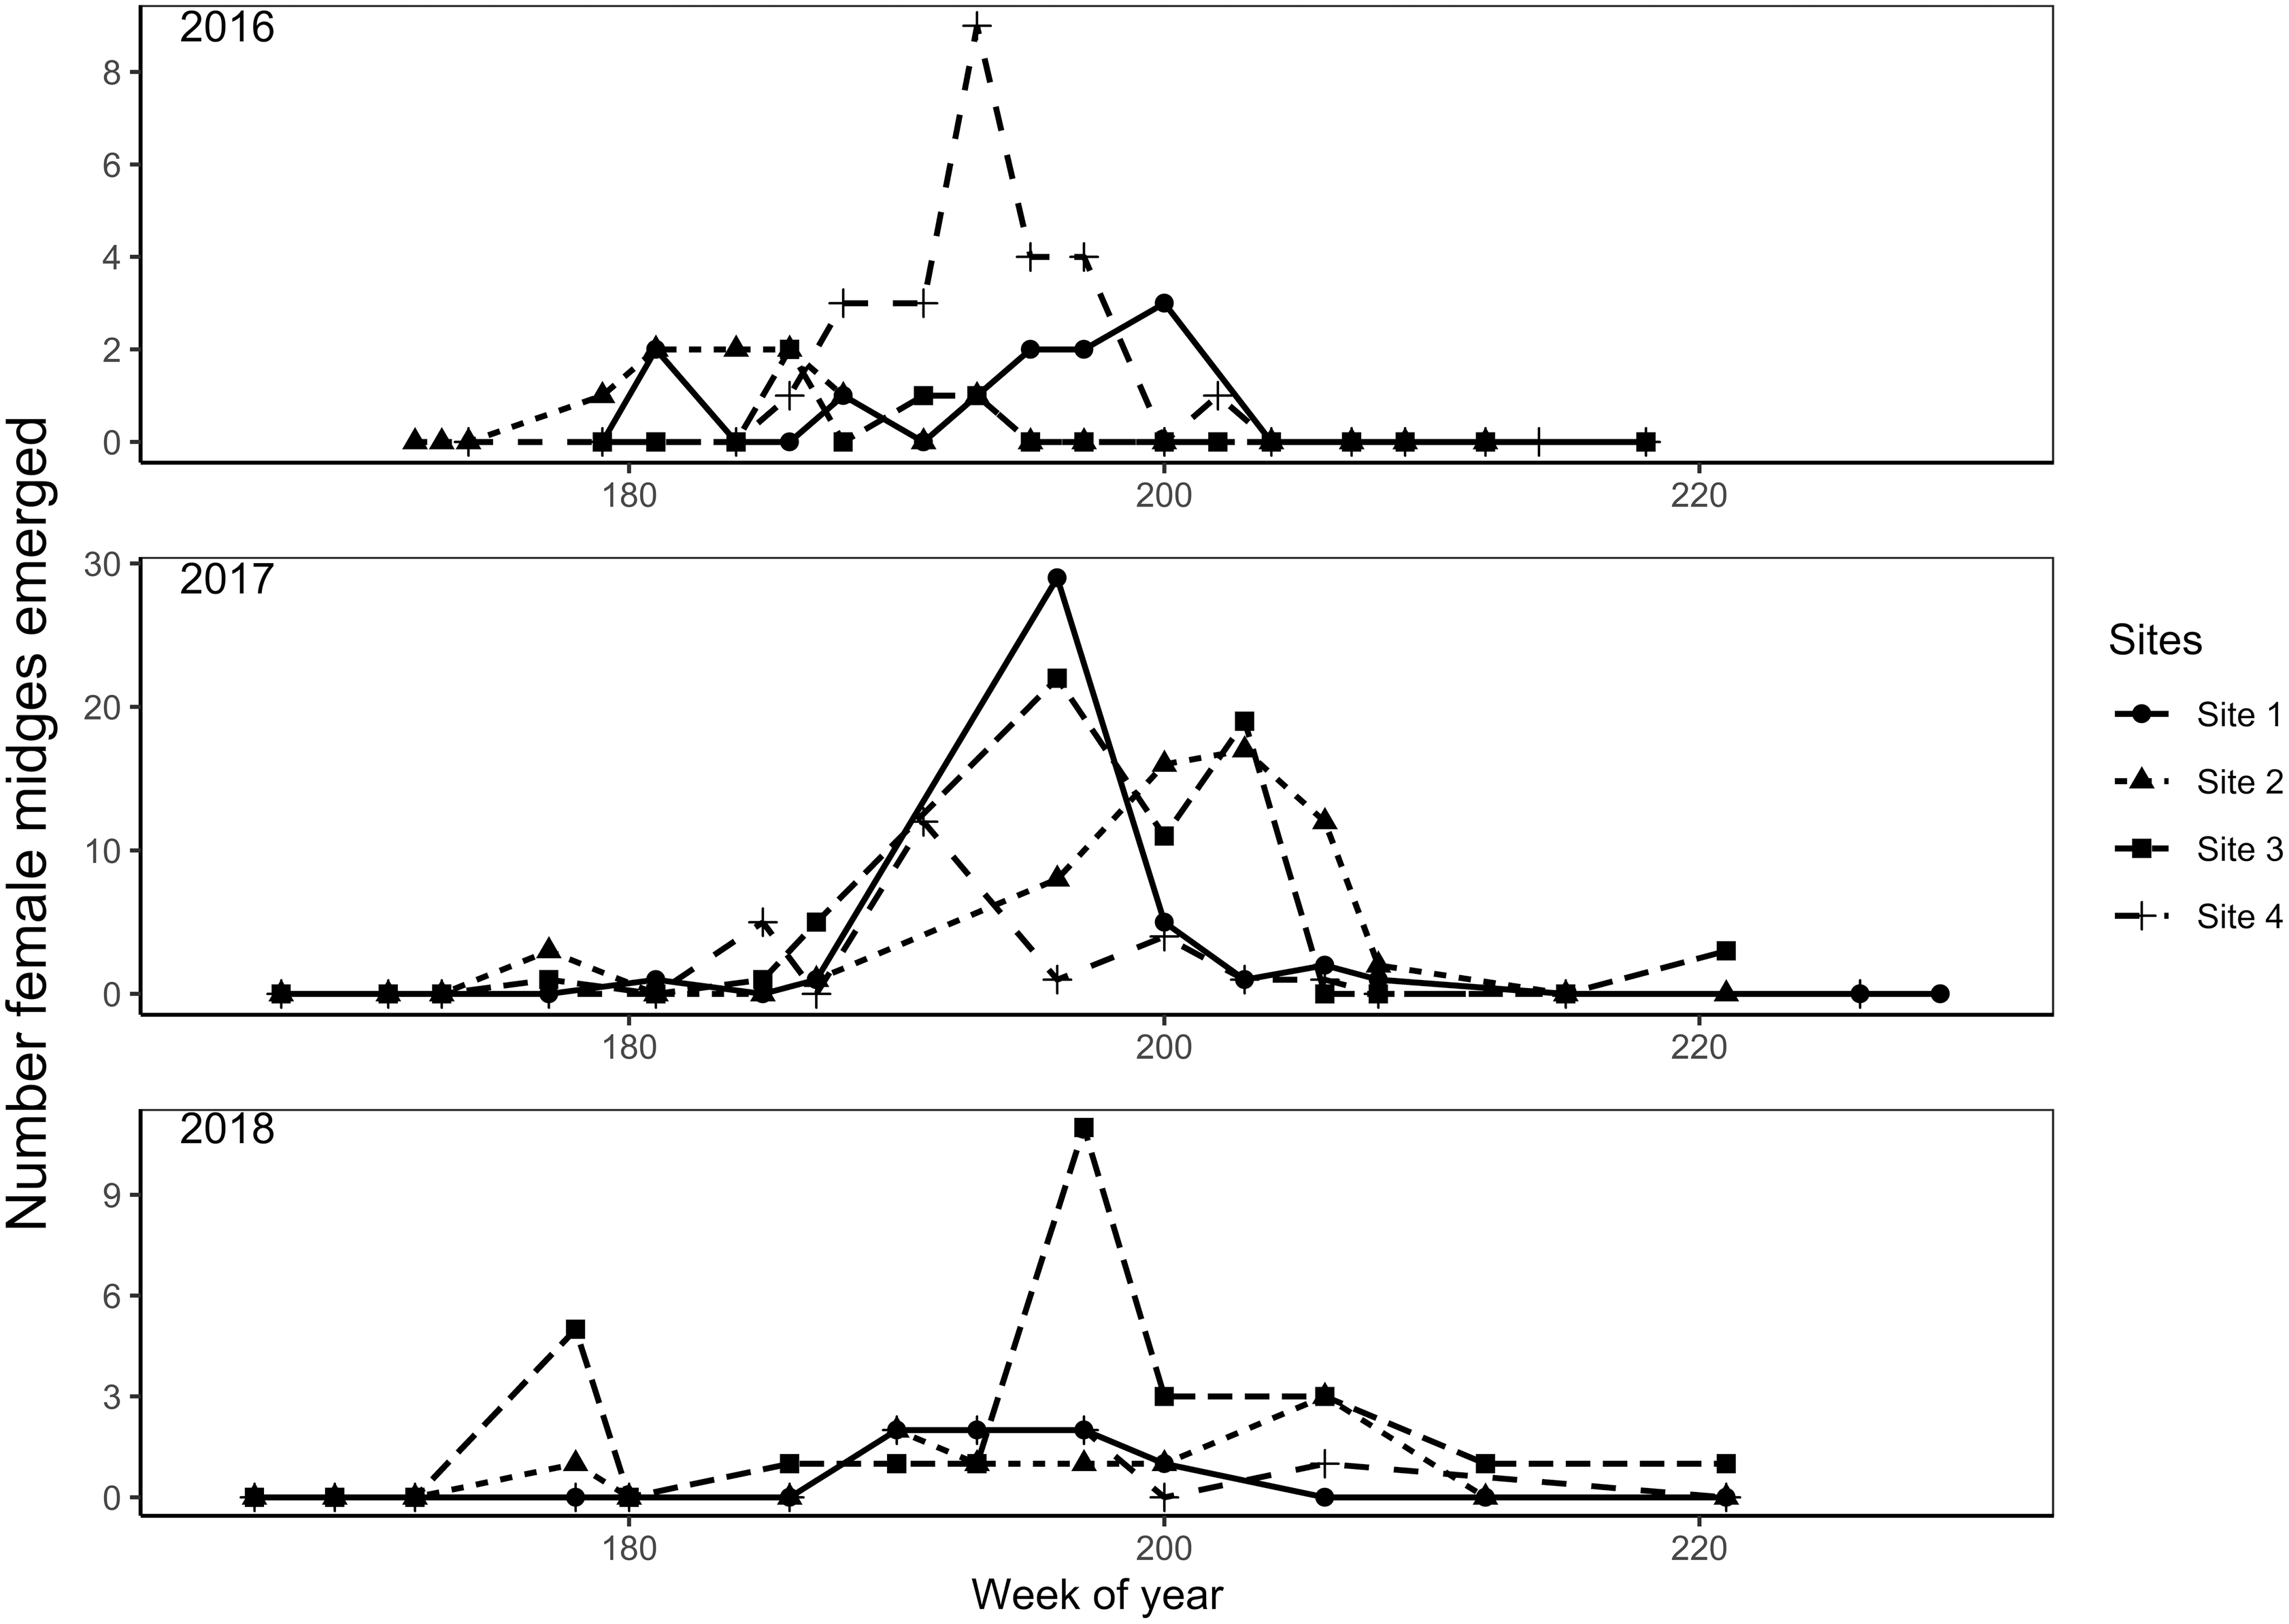
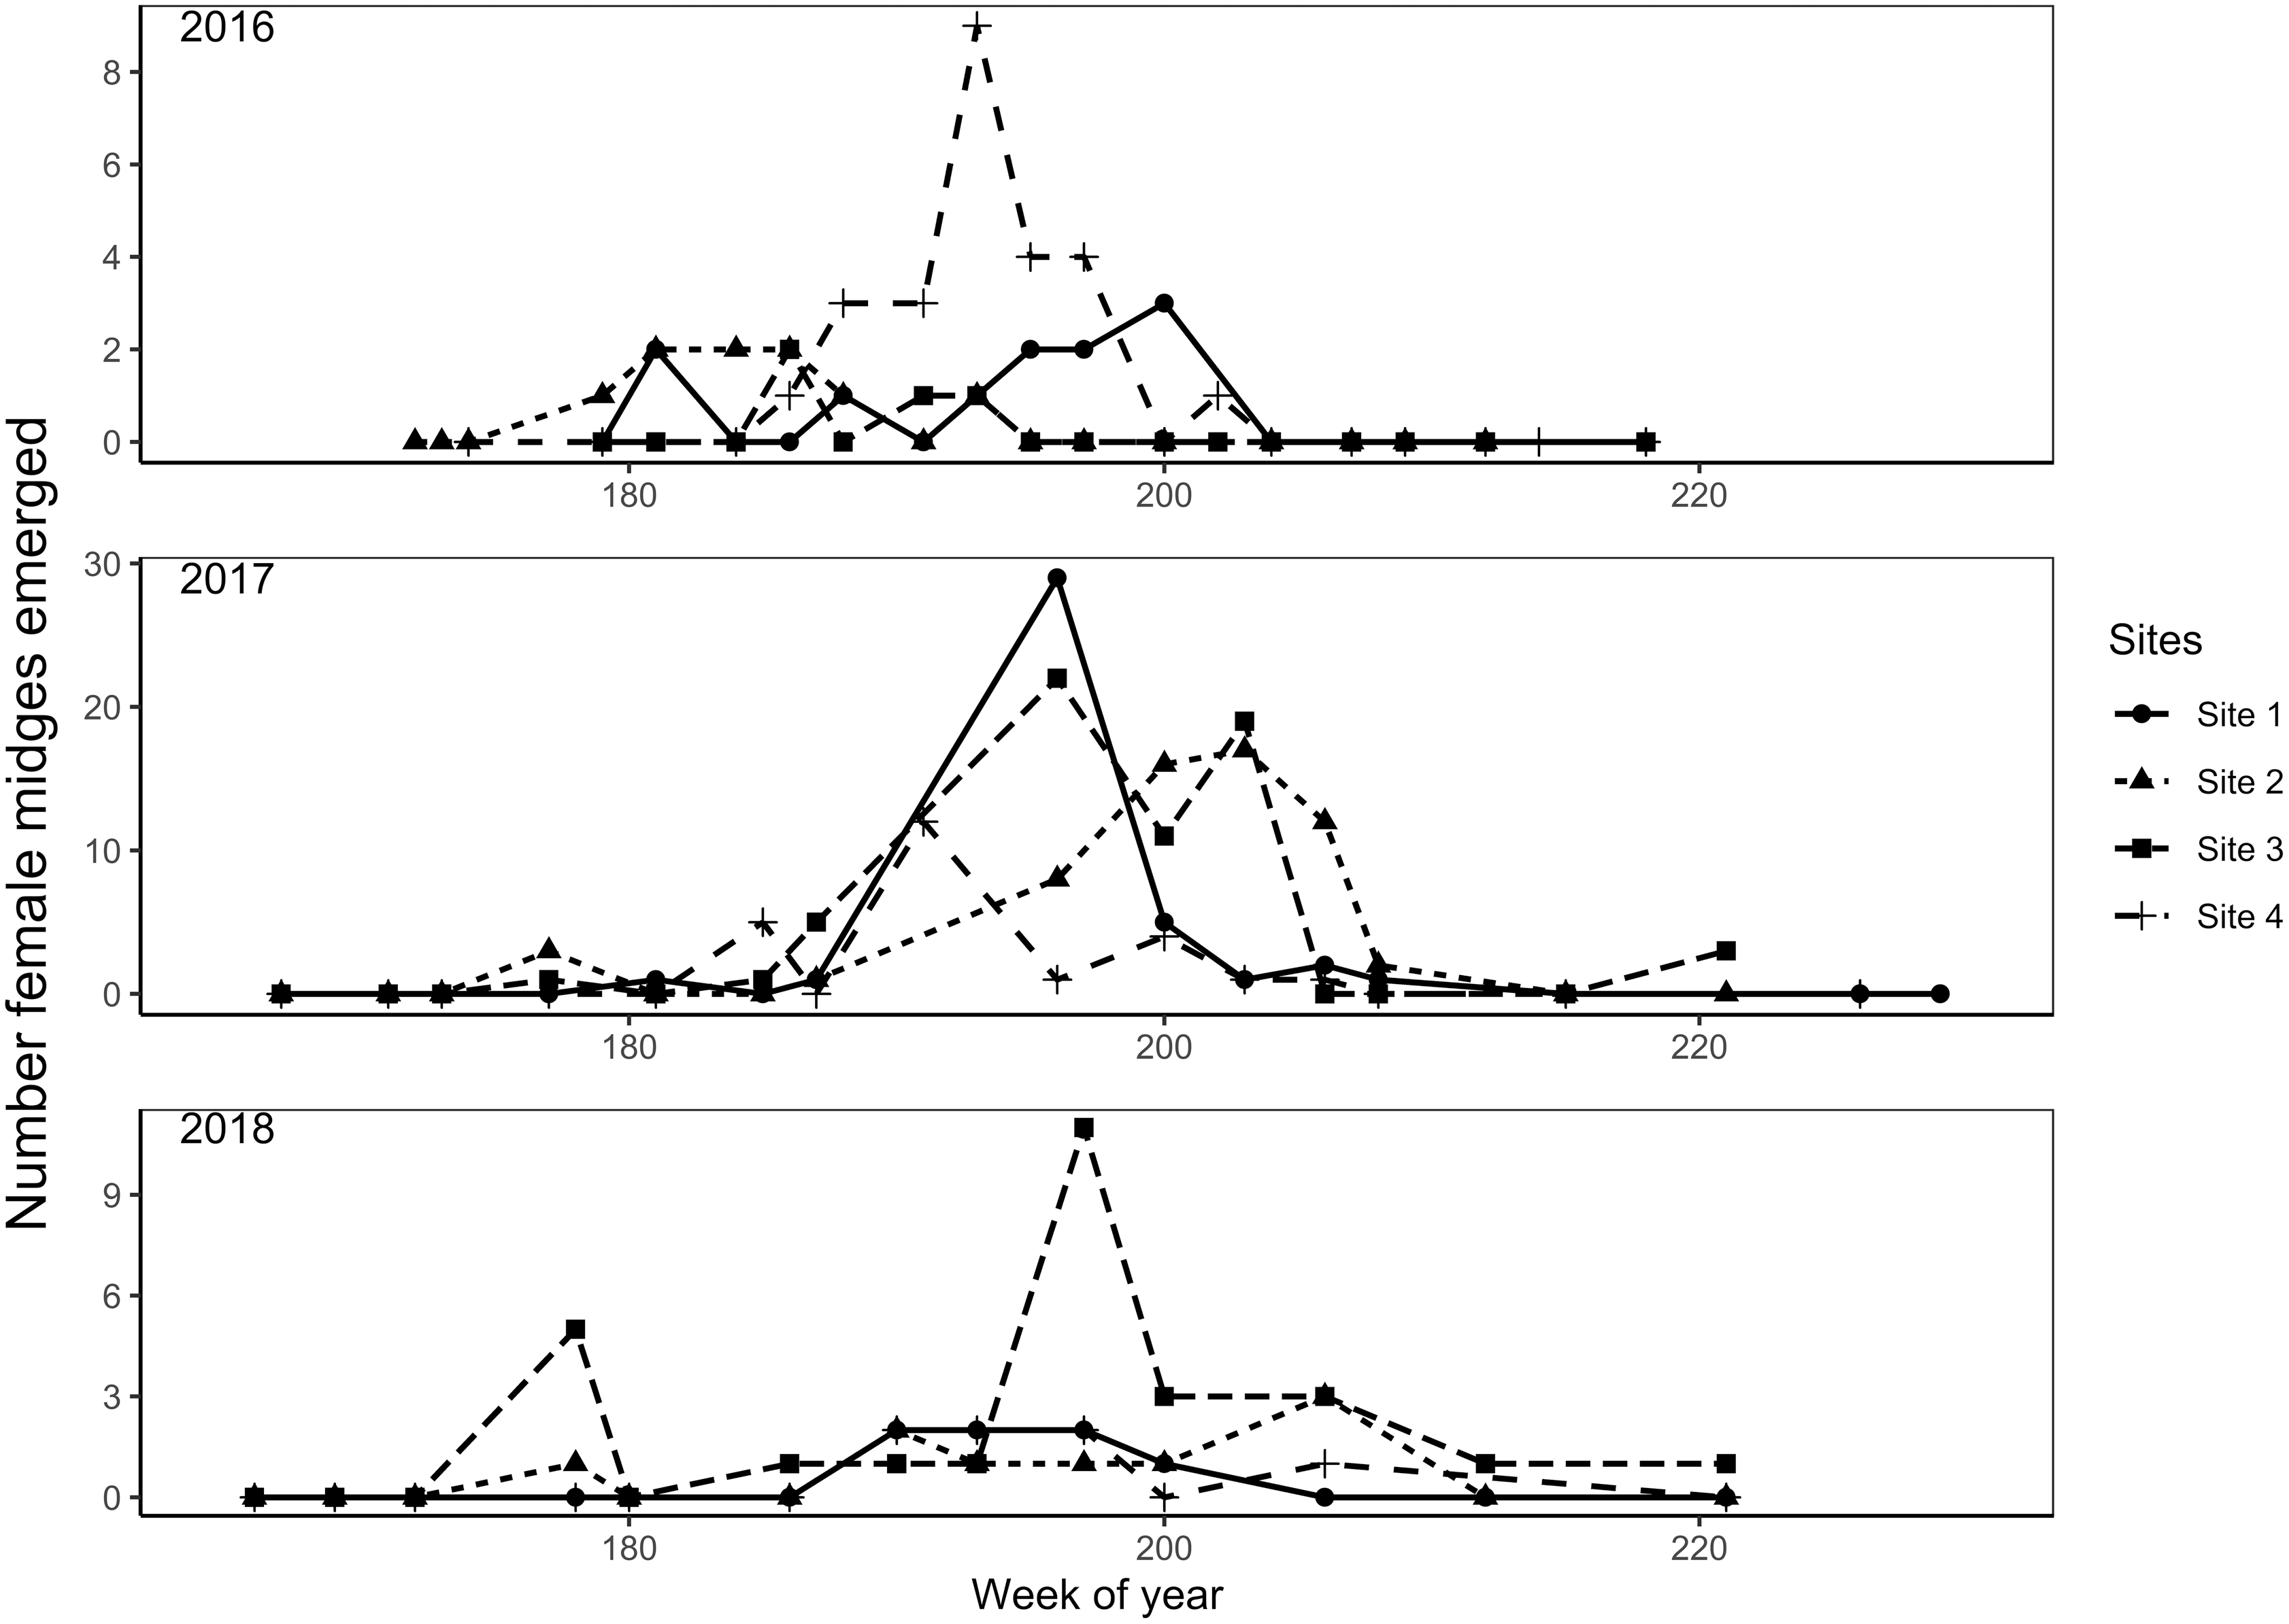
At most field sites, wheat midge emergence occurred with multiple peaks (Fig. 3). Multiple peaks were observed consistently at site 3 in all three years and at site 2 in 2016 and 2018 (Fig. 3). The first peak of midge emergence occurred at 338.06 ± 81.26 GDD above base 7 °C after a period of 250 GDD base 3 °C and a rainfall event.
Emergence of wheat midge adults on sticky strips placed in plastic emergence bucket traps deployed in wheat fields. Traps (n = 8 per field in 2016; n = 20 per field in 2017 and 2018) were spaced 10 m apart in the first row of wheat stubble in fields (n = 4 in 2016, 2017, and 2018). Traps were checked three times weekly. Different line types and symbols represent different field sites.
Discussion
Patterns of wheat midge emergence in the Peace River region of Alberta, Canada do not fit the published bioclimatic models developed and tested in western Canada (Elliott et al. Reference Elliott, Mann and Olfert2009) or in Europe (Jacquemin et al. Reference Jacquemin2014). Both the Elliott and Jacquemin models tend to predict emergence earlier than it occurred in the field, suggesting that in years with adequate rainfall, wheat midge in the Peace River region may require a higher accumulation of growing degree-days from air temperature than is predicted in the published models before emergence occurs.
Rainfall impacts the accumulation of growing degree-days in soil, affecting the ability of models that use air temperature to predict phenology. There were differences in the relationships between predicted and observed dates of emergence when air and soil temperature values were used. When air temperature was used, the Elliott model predicted 10% emergence to occur earlier than was observed in 2017 and later than was observed in 2016 and 2018. This effect was stronger at 50% emergence for 2017 and 2016. In 2018, deviation between observed and predicted 50% emergence was low (–0.8 ± 6.12 standard deviation). In contrast, when soil temperatures from the region were input, the model consistently predicted earlier-than-observed emergence of adult midges. This was not surprising, given that the Elliott model was developed using air temperature; however, we expected higher precision using soil temperature than what was observed. Higher precision was expected because soil temperature measurements should more accurately reflect variation in the temperature conditions that midges experience. Rainfall in May and June 2017 (87.7–115.7 mm) was within the optimum 30–145 mm moisture range for midge emergence that Elliott et al. (Reference Elliott, Mann and Olfert2009) suggest. Emergence occurred 9–10 days later than predicted at the two sites that received more than 110 mm of rain in May and June, whereas emergence only occurred 3–5 days later than predicted at the two sites that received less than 100 mm of rain in May and June. Most of this rainfall occurred in May. In 2018, rainfall in May was less than 20 mm at all sites; however, only the 10% adult emergence was delayed, as in Elliott et al. (Reference Elliott, Mann and Olfert2009), but not the 50% emergence. Accumulated precipitation from 1 May to 14 June was 40 mm or greater. Additionally, numbers of emerged adults were low, likely due to the low precipitation. In 2016, rainfall for May and June was greater than 145 mm, which would indicate delayed emergence in the Elliot model. However, adults emerged earlier than predicted, which may be because rainfall in May was less than 20 mm and most of the rain accumulation occurred 8–20 June. Elliott et al. (Reference Elliott, Mann and Olfert2009) suggest that the rainfall-related emergence patterns may be caused by differences in the accumulation of growing degree-days in soil and air; this study supports this observation. Predictions from the Elliott model using soil temperature were more consistent amongst years than were the predictions using air temperature, and the deviations associated with air temperature generally followed the patterns described by Elliott et al. (Reference Elliott, Mann and Olfert2009). Patterns in soil temperature are caused by multiple factors, including soil colour, organic matter content, and moisture. Dark soils (dark-grey luvisols and chernozems) with a heavy clay content are common in the Peace River region. This may increase the magnitude of the discrepancy between air and soil temperatures, as these factors increase the potential for temperature extremes. Field sites with dark, heavy clay experienced soil temperature spikes when the soil was dry, which increased growing degree-day accumulation in those fields. Summer day length in the Peace River region is 1.5–2 hours longer than in southern Saskatchewan (49 °N). The additional daylight hours can quickly increase growing degree-day accumulation, depending on climatic conditions, especially on dark, bare soil. In contrast, soil with a high clay content retains moisture longer than silty or sandy soils do because of drainage differences and a higher evaporation temperature requirement (Utkaeva Reference Utkaeva2007). Moist soils also heat more slowly and reach a lower daily maximum temperature than drier soils do (Al-Kayssi et al. Reference Al-Kayssi, Al-Karaghouli, Hasson and Beker1990), which decreases the variation in soil temperature. This means that the optimum range of moisture to obtain the same soil growing degree-day accumulation thresholds that are included in the Elliott model may be different in the Peace River region. This is complicated by the apparent effect of moisture timing on adult midge emergence. Rainfall higher than 60 mm in May could delay adult emergence, and low rainfall in late May and early June may cause earlier-than-expected emergence even if total May–June rainfall is greater than 145 mm. For the impacts of timing of soil moisture on wheat midge emergence to be better understood, more studies over a wider range of precipitation levels and dates are required. Air temperature data are widely available across the Canadian Prairies; therefore, optimisation of a model using air temperature instead of soil temperature would be preferred. We were also unable to develop and test a new phenological model in this study because of the low numbers of field sites available to us. Midge capture at field sites was low, and further research over a range of seasonal densities at more field sites will allow for the development of a region-specific phenological model.
The emergence patterns observed in the field suggest that, at least at some sites, wheat midge emergence in the Peace River region occurs in “wave” patterns. The temperature accumulation between potentially inductive rainfall events was, not surprisingly, greater in the Peace River region (338 GDD base 7 °C) than in Belgium. Waves of emergence did not occur at all field sites in all years. Research has not yet been done to determine the relative importance of inductive rainfall events for midge emergence compared to early season soil moisture from snow melt. In the Peace River region, fields with high clay content can retain high soil moisture levels into May, depending on temperature fluctuations, snowpack, and cultivation methods (personal observation). Further research is required to better understand these relationships.
The current experiment was unable to determine exact dates of rainfall events at field sites or midge emergence due to the frequency of data collection. For the purposes of testing the model, dates of rainfall events were obtained from Alberta Agriculture and Forestry, Alberta Climate Information Services weather data. Weather stations were located 6–26 km from the field sites. Rainfall was confirmed with onsite weekly cumulative rainfall data, but exact dates and amounts of daily rainfall may have differed between field sites and weather stations. This may have impacted the accuracy of estimates using the Jacquemin model. Although emergence patterns vary amongst the fields studied, an understanding of the emergence patterns that are most likely to occur across a region could provide producers with further guidance for timing in-field scouting of adult female midges on wheat heads for the purpose of making control decisions, and it would be particularly important if a second peak of midge emergence is expected in a field with late wheat head emergence.
Wheat midge management may require region-specific bioclimatic models because wheat midge has shifted its development rates regionally to match host plant phenology. In Germany and the United Kingdom, it mainly infests winter wheat (Basedow Reference Basedow1972; Oakley et al. Reference Oakley, Talbot, Dyer, Self, Freer and Angus2005; Chavalle et al. Reference Chavalle, Buhl, Censier and De Proft2015). In Finland, wheat midge infests winter and spring wheat equally, depending on abiotic conditions, and has adapted to emerge three weeks earlier than wheat midge does in Germany, at 400 GDD base 5 °C (Kurppa Reference Kurppa1989). In North America, wheat midge has adapted to infest mainly spring wheat (Olfert et al. Reference Olfert, Mukerji and Doane1985). This host plant association is reflected in an overall shift in adult emergence from late May or early June to late June or early July. This shift in calendar date also represents a shift in growing degree-days, as midge in Saskatchewan requires 693 GDD base 5 °C for adult emergence, whereas midge in Germany requires 500 GDD base 6 °C (Basedow Reference Basedow1972; Elliott et al. Reference Elliott, Mann and Olfert2009). A shift in phenology may have occurred when wheat midge expanded its range to the Peace River region of Alberta and adapted to different host phenology, latitude, and precipitation patterns. Adaptation to these variables at a broad or site-specific scale could increase the imprecision seen in phenological models. High variation in emergence periods occurs even in wheat-infesting midges in Germany, with some midges emerging early and others emerging later in the season (Basedow Reference Basedow1972). This has been attributed to extended diapause (Wise and Lamb Reference Wise and Lamb2004), although this pattern has not been previously reported in Canada. Wheat midge exhibits Type C polymodal emergence (Waldbauer Reference Waldbauer1978), or emergence that occurs over multiple years. In this study, we saw distinct bimodal emergence patterns consistently at some field sites, as well as high rates of extended diapause (20–95% in extended diapause, data not shown). It is possible that the bimodal emergence was due to prolonged diapause in a portion of the population or that some wheat midges exhibit a Type A polymodal emergence (or emergence in multiple periods within a field season) response, as well as Type C emergence. A Type A polymodal emergence pattern would fit the Jacquemin et al. (Reference Jacquemin2014) model concept of waves of emergence. The mechanism behind polymodal emergence for wheat midge is unknown but is likely due to genetics because some midges require two cold periods to emerge under the same rearing conditions (Wise and Lamb Reference Wise and Lamb2004). Pre-existing genetic heterogeneity in phenological and diapause responses probably promotes phenological adaptations for alternate host use.
Improved management of wheat midge can be achieved by understanding regional variations in biology. It is critical that producers and agrologists have modelling tools that allow them to predict wheat midge emergence in order to accurately time spring monitoring and management. The recent development of a tri-trophic model for the wheat midge agroecosystem by Olfert et al. (Reference Olfert, Weiss, Vankosky, Hartley and Doane2020) increases the need for accurate regional phenological model parameters. Use of the model to estimate year-to-year risk and within-year phenological updates requires input of correct developmental thresholds for wheat midge. Emergence model parameters such as growing degree-day thresholds for emergence under both high- and low-moisture conditions need to be optimised for the phenological shift that appears to apply to the Peace River region. Further research is needed to determine how the differences in wheat midge biology that occur in the Peace River region can be applied to integrated pest management strategies.
Acknowledgements
Funding for this project was provided by Agriculture and Agri-Food Canada A-base (WBSE Project J 001303.001.03: New tools for managing wheat midge) and a teaching assistantship to A. Jorgensen from the University of Alberta, Edmonton, Alberta, Canada. The authors thank Shelby Dufton, Scott Meers, Shelley Barkley, Nancy Melnychuk, David Giffen, Dr. Breanne Tidemann, Patty Reid, Ian Wise, Sheila Wolfe, Holly Spence, Janelle Barbarich, and many summer students for help with data collection, processing, and advice. The authors owe many thanks to Peace River wheat growers Marc and Lise Rochon, Mike Caron, Norm Lamoureux, Danny and Wayne Dion, Denis Boucher, Lucien Houle, Garnet Berge, Walter Hill, Wayne Longson, Greg Sears, Norm Wilson, and Greg Newman; without their cooperation and support, this project would not have been possible. Air temperature data from 2016 and precipitation data were provided by the Alberta Climate Information Service, Edmonton, Alberta, Canada, found at https://acis.alberta.ca.