

Introduction
For about two hundred years, mathematical models have been used to explain and interpret data obtained through observations and measurements and to reveal cause and effect relationships in different fields of science. Mathematical functions enable scientists to reach unbiased results by considering the events in an abstract manner. The evaluation and processing of data collected from samples within the population or the system as a whole, clarification of the findings, their validation on wide scales and estimations obtained for the following cases are more accurate and significant through the use of mathematical functions. In addition, it is possible to intervene in the changes at various times and in different cases considering the estimations obtained as a result of the modelling of a system (Panik, Reference PANIK2014). Since the growth of a living organism is affected by many factors in biology, it is not always possible to identify some of them numerically. Therefore, the methods used in exact sciences such as physics and chemistry cannot be used with the same success for animals. Besides, it is not compulsory to represent all factors in the model when making the mathematical definition of the growth of a system or an organism. Conversely, representing the factors with fewer parameters and a simple function is essential in terms of both comprehensibility and practice. If the basic model is presented, it may be allowed to solve similar problems under different conditions by changing or transforming the parameters of the model (Konarzewski et al., Reference KONARZEWSKI, KOOIJMAN and RICKLEFS1998).
Mostly ‘asymptotic’ functions and ‘parabolic’ functions - although at a small rate - are used to model data from agriculture. If the dependent variable tends to approach the maximum point according to the levels of the independent variable, it is expressed with an asymptotic function. However, if the dependent variable tends to decrease after it has reached the maximum, it represents a parabolic process. In plants and animals, growth is generally of asymptotic structure. Growth is of parabolic structure in plants such as parsnip, corn, and cotton. The models used in the field of agriculture are divided into three categories as teleonomic, empirical, and mechanistic (Thornley and France, Reference THORNLEY and FRANCE2007). Teleonomic models act towards the target and are generally multi-stage mathematical models which are clearly formulated in terms of the target. The use of teleonomic modelling is rather limited in explaining biological events (France and Dijkstra, Reference FRANCE and DIJKSTRA2006). The mathematical models for growth may be either empirical or mechanistic. A mechanistic model should be preferred to represent the biochemical processes controlling growth as much as possible. However, unless the mechanism which manages the process is known in detail and the data obtained with an experiment are interpreted, the mathematical function of the process may be empirical and model fitness evaluates the ability of fitness to empirical data according to the statistical criteria. Empirical models are expressions which define the action of the dependent variable without attempting to identify the causes or to explain the event. This means neither that empirical functions do not provide biologically realistic estimations nor that they fall short of biologically-based equations. The most widely used form of empirical equations is linear, and although they have non-linear forms as well. In fact, when more information about the system is available, empirical models can be transformed into a more mechanistic structure (Zwitering et al., Reference ZWITERING, JONGENBURGER, ROMBOUTS and VAN ’T RIET1990).
Growth modelling in the poultry
Many mathematical models have been used to model growth in poultry, and the majority are asymptotic and mechanistic. These models consist of functions which accept, on the basis of the reality of the biological growth of an animal, that the dependent variable has an estimated asymptotic value when the independent variable is at infinity. These growth models use non-linear functions, and the majority of them have a sigmoid structure; however, their courses of growth may vary. A comprehensive review and history of the growth models used in poultry species has been published by Darmani Kuhi et al. (Reference DARMANI KUHI, PORTER, LOPEZ, KEBREAB, STRATHE, DUMAS, DIJKSTRA and FRANCE2010). Many models have been made more mechanistic by adding biologically significant parameters to an empirical infrastructure. In this way, many models have been derived from each other.
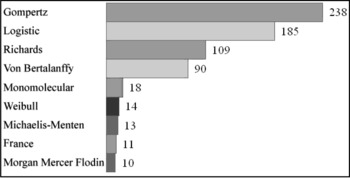
As a result of the survey carried out in four different categories on the ‘Web of Science’ database by Thomson Reuters (agriculture dairy animal science, veterinary science, agriculture multidisciplinary, and mathematical computational biology) and covering the years from 1970 to 2016, it was determined that Gompertz was the most commonly used growth model in the publications on these subjects ( Figure 1 ).
Numbers of growth curve models according to database of Web of Science.

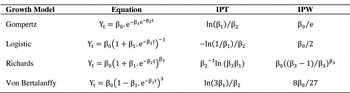
The non-linear regression models which are most widely used to model growth in the poultry are the three-parameter Gompertz, Logistic, and von Bertalanffy models and the four-parameter Richards functions. On the other hand, other models which are less mentioned in scientific studies are von Bertalanffy, Weibull, Monomolecular, France, Michaelis-Menten, and Morgan-Mercer-Flodin. The expressions of the Gompertz, Logistic, von Bertalanffy and Richards growth models and their coordinates of the point of inflection are presented in Table 1 .
Expressions and point of inflections of commonly used growth functions.

In the equations, ‘t’ denotes time, ‘y’ weight, ‘ß0’ the maximum body weight the animal is assumed to be able to reach, ‘ß1’ the biological constant about the shape of the curve, ‘ß2’ the biological constant about the growth rate and ‘ß3’ the shape parameter. These parameter models are special cases of the more flexible Richards function, which a variable point of inflection is specified by the shape parameter (ß3). The Logistic, Gompertz and von Bertalanffy functions have fixed growth forms with the point of inflection at about 50, 37 and 30% of the asymptote, respectively (Porter et al., Reference PORTER, KEBREAB, DARMANI KUHI, LOPEZ, STRATHE and FRANCE2010). It is possible to examine the studies on poultry by using growth models under three categories, namely ‘determination of the best-fitting model’, ‘a comparison of various application results with the growth models’, and ‘the genetic structure of the growth curve’.
Determination of the best-fitting growth model
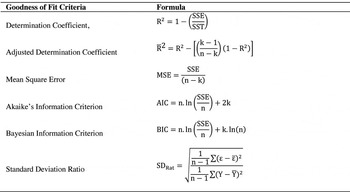
The goodness-of-fit criteria used widely for non-linear regression equations are presented in Table 2 (Narinç et al., 2010b; Karadas et al., Reference KARADAS, TARIQ, TARIQ and EYDURAN2017).
Some goodness of fit statistics.

SSE: sum of square errors, SST: total sum of squares, n: the number of observations, k: the number of parameters, ε: actual residual value, Y: actual yield value
There are a large number of studies which were performed to determine the best-fitting growth models in different poultry species or genotypic groups in the same species. In a pioneering study, Ricklefs (Reference RICKLEFS1967) determined that the best-fitting model was Gompertz for growth data of some birds. Sigmoid, Logistic, and polynomial models have been fitted to growth curves of chickens (Grossman and Bohren, Reference GROSSMAN and BOHREN1982). Tzeng and Becker (Reference TZENG and BECKER1981) analysed the growth data of male chickens from a purebred sire line using Gompertz, Logistic and von Bertalanffy functions. They reported that Gompertz was the best-fitting model. Having carried out a similar study, Anthony et al. (Reference ANTHONY, NESTOR and BACON1986) reported, as a result of their analyses with the growth data of the quail lines treated with divergent selection, that the best-fitting model for the line with decreased weight was Logistic and that the best-fitting model for the line with increased weight was Gompertz. Having analysed the growth data of turkeys selected for increased body weight and its randombred control line by means of Gompertz, Logistic and von Bertalanffy, Anthony et al. (Reference ANTHONY, EMMERSON and NESTOR1991a) reported that the best-fitting model was Gompertz. Akbaş and Oğuz (Reference AKBAŞ and OĞUZ1998), who analysed the growth patterns of Japanese quail lines selected for low and high body weight, reported that the best-fitting model was Gompertz. Maruyama et al. (Reference MARUYAMA, BACON and NESTOR1998) analysed the growth data of male and female turkeys of two genetic lines (a fast-growing line and a randombred control line) by means of the Logistic, Gompertz, von Bertalanffy, Richards, Weibull, and Morgan-Mercer-Flodin functions. In a study by Yakupoglu and Atil (Reference YAKUPOGLU and ATIL2001), the values of weekly body weight in Cobb and Hubbard commercial broiler flocks were analysed using Gompertz and von Bertalanffy functions, and they reported that the Gompertz model explained outcomes better than von Bertalanffy.
Aggrey (Reference AGGREY2002) compared three non-linear models (Richards, Logistic, and Gompertz) and a spline linear regression model for describing chicken growth curves. The spline model predicted the hatching weight better than the Gompertz model; however, the spline model had the poorest fit to the data compared with the non-linear models. Narushin and Takma (Reference NARUSHIN and TAKMA2003) carried out a study to determine the best predictive model for the accurate description of the average flock growth of laying hens (Shaver white laying hen line) using Logistic, Gompertz, von Bertalanffy, Richards, Weibull and Morgan-Mercer-Flodin functions, polynomial regression and Narushin-Takma models. The researchers found that the Narushin-Takma models they had developed themselves had functions which well-defined both growth data and egg yields. However, these empirical models with no biologically significant parameters were not used much in the studies carried out to model growth in the poultry. Having analysed the growth data of meat and egg strains of chicken by using the Gompertz, Logistic, Lopez, Richards, France, and von Bertalanffy models, Darmani Kuhi et al. (Reference DARMANI KUHI, KEBREAB, LOPEZ and FRANCE2003) reported that the Richards model was better than the others according to various goodness-of-fit criteria. Darmani Kuhi et al. (Reference DARMANI KUHI, KEBREAB, LOPEZ and FRANCE2003) stated that it would be more useful to use flexible models like Richards instead of models with a fixed point of inflection such as Gompertz and Logistic. Growth curve parameters were estimated for large white turkey flock by Sengul and Kiraz (Reference SENGUL and KIRAZ2005) with four different non-linear models (Gompertz, Logistic, Morgan-Mercer-Flodin, and Richards). They reported that Gompertz, Logistic and Richards models were more suitable models for growth data of large white turkey. Flexible non-linear models were evaluated statistically for their suitability in predicting weights of carcass parts by Zuidhof (Reference ZUIDHOF2005). The analysis employed four sigmoidal (S) models (Gompertz, modified Gompertz, Richards, and Lopez) describing carcass part weight as a function of age, as well as three diminishing returns models (Lopez, Mitscherlich, and log linear), and a log-linear proportional yield model, which described carcass part yield and weight. Zuidhof (Reference ZUIDHOF2005) reported that the sigmoidal models with a flexible point of inflection were better able to predict carcass part weights than the Gompertz model with a fixed point of inflection and the diminishing returns models. In a study carried out to model two sets of growth data from the literature, male broiler body weight at 168 and 170 days of age were used (Roush and Branton, Reference ROUSH and BRANTON2005). Researchers analysed growth data using two forms of Logistic model, two forms of Gompertz model, and the Saturated Kinetic models via the non-linear regression and the genetic algorithm approaches. The genetic algorithm approach was found to successfully determine the coefficients of growth equations (Roush and Branton, Reference ROUSH and BRANTON2005). Roush et al. (Reference ROUSH, DOZIER III and BRANTON2006), published the findings of the first use of the neural network model in poultry (growth data of male chicks from Ross x Ross 308) in order to estimate growth curve parameters. A comparison was made for the Gompertz function between the non-linear regression and neural network methodologies. Accuracy of the models was determined by mean square error, mean absolute deviation, mean absolute percentage error, and bias. When measured by bias, the Gompertz equation underestimated values, whereas the genetic algorithm produced little or no overestimation of the observed body weight responses (Roush et al., Reference ROUSH, DOZIER III and BRANTON2006). Nahashon et al. (Reference NAHASHON, AGGREY, ADEFOPE and AMENYENU2006a) compared two non-linear mathematical functions (Gompertz and Logistic) using weekly body weight data of the French guinea fowl. The Gompertz model was found to be better than the Logistic model for growth patterns in French guinea fowl. Nahashon et al. (Reference NAHASHON, AGGREY, ADEFOPE, AMENYENU and WRIGHT2006b) compared Richards, Gompertz, and Logistic functions for describing the growth of the pearl gray Guinea fowl using weekly live weight data from hatch to 22 weeks of age. It was determined that the Logistic model was not compatible with the data of pearl gray guinea fowl compared with the Gompertz and Richards models. In another study by Norris et al. (Reference NORRIS, NGAMBI, BENYI, MAKGAHLELA, SHIMELIS and NESAMVUNI2007), the Gompertz, Logistic and Richards models were compared for the live weight of indigenous Venda and Naked Neck chickens and analyses was carried out to determine the existence of differences in the growth patterns of these breeds. The Gompertz model was most suitable for explaining the growth of the chickens. Ahmadi and Mottaghitalab (2007) evolved three growth models out of a family of flexible curve ideas, the so called hyperbolastic models. The researchers reported that the greater flexibility of a hyperbolastic model and Richards function may lead to more accurate prediction and better fit to the broiler growth data than Gompertz. Balcıoğlu et al. (2009) compared the growth models (Gompertz, Bertalanffy, Logistic functions) using data from chukar partridges (Alectoris chukar). According to the goodness-of-fit criteria, the Gompertz model was found to be the best to determine the growth pattern of partridges. In another study, three flexible growth functions (Von Bertalanffy, Richards, and Morgan) were compared with the Gompertz function for growth profiles of turkey hens from commercial flocks (Porter et al., Reference PORTER, KEBREAB, DARMANI KUHI, LOPEZ, STRATHE and FRANCE2010). The results showed that the fixed point of inflection of the Gompertz equation can be a limitation and that the relationship between body weight and age in turkeys was best described using flexible growth functions. The Morgan equation provided the best fit to the data set and was used for characterising growth profiles of turkey hens. Four non-linear models (Gompertz, Logistic, Richards, and Weibull) and a spline linear regression model were evaluated with regard to their ability to describe the growth pattern of male mule duck (Vitezica et al., Reference VITEZICA, MARIE-ETANCELIN, BERNADET, FERNANDEZ and ROBERT-GRANIE2010). Furthermore, fixed and mixed effects models were compared to analyse growth, and of the non-linear models, the mixed effects Weibull model had the best overall fit, with the mixed effects spline regression model being the second best model. Narinç et al. (2010b) compared ten growth functions (Gompertz, Richards, Logistic, Bertalanffy, Brody, Negative Exponential, Morgan-Mercer-Flodin and three Hyperbolastic models) for growth data of a randombred Japanese quail flock. The Gompertz model was found to be the best for Japanese quail among all the candidate models according to the goodness-of-fit criteria. Tompić et al. (Reference TOMPIĆ, DOBŠA, LEGEN, TOMPIĆ and MEDIĆ2011) compared three non-linear growth functions (Logistic, Gompertz, and Richards) and three polynomial functions (linear, second-order, and third-order) for describing the growth profiles of Ross 308 broiler breeder flocks from hatch to 35 weeks of age.
The third-order polynomial function gave the optimal results for body weight data of Ross 308 parents, when the Richards model was the best fitted function among the non-linear models. Ramos et al. (Reference RAMOS, CAETANO, SAVEGNAGO, NUNES, RAMOS and MUNARI2013) investigated the most appropriate growth model for the body weights of ostriches in a Brazilian population. Two non-linear growth functions (Gompertz and Logistic) and a third-order polynomial function were utilised. The results of this study showed that the non-linear models were more compatible for describing ostrich growth. In another study (Rizzi et al., Reference RIZZI, CONTIERO and CASSANDRO2013), the linear and three non-linear models (Gompertz, Logistic and Richards) were compared for growth patterns of five local Italian chicken lines. Researchers reported that Richards model was determined to be the most suitable for explaining the differences of growth patterns of the local lines (Rizzi et al., Reference RIZZI, CONTIERO and CASSANDRO2013). Zhao et al. (Reference ZHAO, LI, HUANG, LI, WANG and XUE2015) compared three growth functions (Logistics, Gompertz, and von Bertalanfy) and evaluated the relationship between body weight and age in growing three types of indigenous chicken in China (Shaobo, Huaixiang, and Youxi). The authors reported that the Gompertz model was the best due to less bias.
A comparison of growth in poultry species or in various experimental groups
One of the studies in which growth samples were compared was performed by Anthony et al. (Reference ANTHONY, EMMERSON, NESTOR and BACON1991b), where quail, chicken and turkey species were used, and the parameters of the Gompertz model gave the best model according to some goodness-of-fit criteria. The effects of selection on the point of inflection in the species concerned were compared in the same study. Once the growth samples in chicken, turkey, duck, and goose species were analysed by using the Richards function, Knizetova et al. (Reference KNIZETOVA, HYANEK, HYANKOVA and BELICEK1995) reported that the ages at the points of inflection were 47.7, 74.0, 25.5, and 21.1 days, respectively and stated that there were differences among the species in terms of other parameters as well. In the studies performed by Knizetova et al. (Reference KNIZETOVA, HYANEK, KNIZE and ROUBICEK1991a; Reference KNIZETOVA, HYANEK, KNIZE and PROCHAZKOVA1991b; Reference KNIZETOVA, HYANEK and VESELSKY1994), the growth samples in eight broiler, nine duck, and three goose lines were analysed by using the Richards function, and growth differences among the lines and between the sexes were presented. In addition to these studies, there are others where the growth of different lines or genetic groups in different poultry species were compared with the growth curves. In the studies where the Gompertz model was used Scheuermann et al. (Reference SCHEUERMANN, BILGILI, HESS and MULVANEY2003) used data from a total of eight broiler lines and crosses; Marcato et al. (Reference MARCATO, SAKOMURA, MUNARI, FERNANDES, KAWAUCHI and BONATO2008) analysed two commercial broiler lines (Cobb and Ross); and Sakomura et al. (Reference SAKOMURA, GOUS, MARCATO and FERNANDES2011) compared the growth of 56-day major body components of two commercial broiler lines (Cobb and Ross). Pis (Reference PIS2012) analysed the growth patterns of the grey partridge (Perdix perdix) and chukar (Alectoris chukar) from hatch to 120 days of age. The growth rate and development of body mass, wing, tarsus, and bill length were measured and fitted by Gompertz function. The growth of body weight, breast weight, and leg weight in the male broiler chickens of two commercial lines were analysed using the Richards function by Goliomytis et al. (Reference GOLIOMYTIS, PANOPOULOU and ROGDAKIS2003). Sezer and Tarhan (Reference SEZER and TARHAN2005) presented the growth curves in three meat type quail lines and Ersoy et al. (Reference ERSOY, MENDEŞ and AKTAN2006) revealed the growth differences by sex in bronze turkeys using the Richards function.
Individual phenotypic selection for high and low body weights at four weeks of age was conducted for a long term in Japanese quail under two selection environments (Marks, Reference MARKS1978).
The growth patterns of four experimental lines have been analysed using the Logistic function. Marks (Reference MARKS1978) reported that growth curve parameters were changed by selection. Selection for high body weight increased the relative growth rate and, the inflection point was shifted to a younger age (Marks, Reference MARKS1978). The growth patterns of a line of turkeys selected for increased body weight and its randombred control line were compared via the Gompertz growth model (Anthony et al., Reference ANTHONY, EMMERSON, NESTOR and BACON1991b). It was concluded that the selection line had a higher slope at inflection point and an asymptotic body weight than the control line. The age at point of inflection and β0 parameter were achieved later for the control flock. Likewise, there are other studies in which the differences among the growth samples of different lines obtained via selection experiments were presented by using growth functions. Akbaş and Oğuz (Reference AKBAŞ and OĞUZ1998) compared Gompertz, Logistic and von Bertalanffy for the growth patterns of a long term selected line and its control line in Japanese quail. They reported that the mature weight parameter (β0) of the birds increased by 15% as a result of five-generation selection in order to increase body weight at five weeks of age. A similar study was performed by Rezvannejad et al. (Reference REZVANNEJAD, PAKDEL, MIRAEE ASHTIANEE, MEHRABANI YEGANEH and YAGHOOBI2013) using divergent lines of Japanese quail and their crosses. They utilised Gompertz, Logistic, and Richards functions and reported that the Logistic model described the growth patterns of Japanese quail and their crosses better than other models. Mignon-Grasteau et al. (Reference MIGNON-GRASTEAU, PILES, VARONA, DE ROCHAMBEAU, POIVEY, BLASCO and BEAUMONT2000) used the growth data of five meat type chicken lines to investigate the effects of selection on the parameters of the Gompertz model. Having examined growth in four selected duck lines, Maruyama et al. (Reference MARUYAMA, VINYARD, AKBAR, SHAFER and TURK2001) determined the differences in the traits of adult weight, age at the point of inflection and growth rate among the lines with the Weibull growth function. Aggrey et al. (Reference AGGREY, ANKRA-BADU and MARKS2003) examined the growth samples of females and males in two lines and a control line obtained as a result of long-term divergent selection in Japanese quail by using the Richards function. The parameter of mature weight (β0) was reported to have increased by 104% in males of the line with increased weight as a result of 30-generation selection in quail (Aggrey et al., Reference AGGREY, ANKRA-BADU and MARKS2003). It was also stated by other researchers that the variations of weight resulting from short-term selection in quail populations affected the parameters of Richards (Hyankova et al., Reference HYANKOVA, KNIZETOVA, DEDKOVA and HORT2001; Beiki et al., Reference BEIKI, PAKDEL, MORADI-SHAHRBABAK and MEHRBAN2013) and Gompertz (Anthony et al., Reference ANTHONY, NESTOR and BACON1986; Balcıoğlu et al., 2005; Alkan et al., Reference ALKAN, MENDES, KARABAG and BALCIOGLU2009) growth curves.
There are studies in which the effects of various environmental (feeding or management) applications applied in different poultry species have been examined using growth curves. Having raised two different turkey genotypes (Nicholas and British United Turkeys) under two lighting schedules and two feeding schedules, Lilburn et al. (Reference LILBURN, RENNER and ANTHONY1992; 1993) compared the growth samples of the experimental groups by means of the Gompertz model. It was concluded that the slope of the growth curve was significantly less in British United Turkeys, but the weight and age at the point of inflection were increased compared with Nicholas toms. There were no significant diet effects on any growth curve parameters (Lilburn et al., 1993). In research where they used a commercial broiler line and two domestic genotypes (Barred Plymouth Rock and Jærhøn), Ali and Brenoe (Reference ALI and BRENOE2002) applied feed restriction and ad libitum feeding schedules and analysed the growth samples of the experimental groups by means of the Gompertz model. In work by Schinckel et al. (Reference SCHINCKEL, ADEOLA and EINSTEIN2005), an analysis was made by means of the Weibull model and non-linear mixed effects by using the weekly body weight data of the ducks fed with six different diets. Having applied two different feed restriction schedules in Ross 308 broilers, Mendes et al. (Reference MENDES, DINCER and ARSLAN2007) examined the differences between the values of body mass index of the experimental groups and the control group chicks fed ad libitum by means of the Gompertz growth model. According to the maximal week increment values estimated with the Gompertz model, they put forward that fat deposition would be higher in the chicks fed ad libitum. Alkan et al. (Reference ALKAN, NARİNÇ, KARSLI, KARABAĞ and BALCIOĞLU2012), who applied a high temperature during the embryonic period to provide the Japanese quail flock with the ability to cope with the heat stress, compared the growth samples of treatment groups by means of the Gompertz model. It was determined that the thermal manipulation treatment created a difference in the growth curves of the quail. It was found that thermal manipulation in the early period caused a lower mature weight and led to an increase in the rate of maturation. On the other hand, it was observed that thermal manipulation in the later period did not lead to any difference in the growth parameters compared to the control group.
There are few studies that have been performed with respect to analysis in slow-growing broilers managed in alternative rearing systems. Santos et al. (Reference SANTOS, SAKOMURA, FREITAS, FORTES and CARRILHO2005), Narinç et al. (2010c), and Eleroğlu et al. (Reference ELEROĞLU, YILDIRIM, ŞEKEROĞLU, ÇOKSÖYLER and DUMAN2014) performed analyses for growth data of slow-growing broiler lines reared in indoors, semi-extensive and organic systems, respectively. N'Dri et al. (Reference N'DRI, MIGNON-GRASTEAU, SELLIER, TIXIER-BOICHARD and BEAUMONT2006) estimated parameters of the Gompertz function for slow-growing broilers reared under the label rouge system. Dottavio et al. (Reference DOTTAVIO, ÁLVAREZ, CANET, FONT and DI MASSO2007) and Dourado et al. (Reference DOURADO, SAKOMURA, NASCIMENTO, DORIGAM, MARCATO and FERNANDES2009) used the Gompertz model to examine the growth of slow-growing broilers (SASSO and ISA Label) reared in the free range system.
Genetic parameter estimates for growth curves
The number of studies with estimated genetic parameters for growth models in poultry is rather limited. This is mainly because body weights at fixed ages were used as the selection criteria in almost all the genetic improvement studies on poultry growth. There is no selection study where parameters such as the growth curve parameters or the point of inflection are used in the poultry.
As a result of the analyses made for the growth curves of broilers by Grossman and Bohren (Reference GROSSMAN and BOHREN1985) and Barbato (Reference BARBATO1991), it was revealed that the main parameters were traits with a high heritability. In another study in chickens (Mignon-Grasteau et al., Reference MIGNON-GRASTEAU, BEAUMONT, LE BIHAN-DUVAL, POIVEY, DE ROCHAMBEAU and RICHARD1999), the heritabilities of the Gompertz growth curve parameters were found to be moderate to high and ranged from 0.31 to 0.54. Mignon-Grasteau et al. (Reference MIGNON-GRASTEAU, PILES, VARONA, DE ROCHAMBEAU, POIVEY, BLASCO and BEAUMONT2000) carried out Gibbs sampling estimations for the genetic parameter estimates of the Gompertz growth curve parameters on 10,671 male and female chickens originating from five lines. It was reported that the heritabilities were high for all three parameters (ranging from 0.43 to 0.60). The genetic correlation of β0 with β1 was highly positive, whereas the genetic correlations of β2 and β0 or β1 were estimated as moderately negative. N'Dri et al. (Reference N'DRI, MIGNON-GRASTEAU, SELLIER, TIXIER-BOICHARD and BEAUMONT2006) reported genetic relationships among feed conversion ratio, using Gompertz growth curve parameters and carcass composition traits for 1,061 slow-growing chickens. The growth curve parameters were found moderately heritable (0.25 to 0.34). Genetic correlations between growth curve parameters and either feed conversion ratio or residual feed consumption were estimated to be low to moderate (0.31 to 0.51).
There are some studies for genetic parameter estimates of growth curve parameters in Japanese quail. But the researchers used only Gompertz function in these studies. Heritability estimates for the mature weight parameter (β0) were found mostly high (from 0.38 to 0.60) by Gebhardt-Henrich and Marks (Reference GEBHARDT-HENRICH and MARKS1993), Akbaş and Oğuz (Reference AKBAŞ and OĞUZ1998), and Narinç et al. (2010a; 2014). However, the β0 parameter is a lower heritable trait according to Akbaş and Yaylak (Reference AKBAŞ and YAYLAK2000), they estimated a low heritability (0.18) for this trait from the Gompertz model. For parameter β1, the heritability was estimated as 0.21 by Narinç et al. (2010a). In parallel with this, its heritability was low to moderate levels in the other studies (Akbaş and Oğuz, Reference AKBAŞ and OĞUZ1998; Akbaş and Yaylak, Reference AKBAŞ and YAYLAK2000). The heritability for the parameter of instantaneous growth rate (β2) was estimated as 0.38 by Akbaş and Oğuz (Reference AKBAŞ and OĞUZ1998), and 0.32 by Akbaş and Yaylak (Reference AKBAŞ and YAYLAK2000), and it has been reported that the heritability estimations of the traits of age and weight at the point of inflection were also at low to moderate levels. Similar results were also reported by Narinç et al. (2010a), who estimated the heritabilities for the age and weight at the point of inflection as 0.08 and 0.36, respectively.
Aslam et al. (Reference ASLAM, BASTIAANSEN, CROOIJMANS, DUCRO, VEREIJKEN and GROENEN2011), analysed the growth data of two commercial turkey parent flocks by using the Logistic function, and reported that the heritability estimated for parameter β0 was 0.30, while the other parameters had low levels (0.05-0.11). Genetic correlations between the growth curve parameters and various slaughter-carcass traits and meat quality traits were estimated in the same research.
Conclusions
For many years researchers have used models to analyse growth in poultry. Most of the models used are of sigmoidal structure, while some of them have fixed or flexible structures in terms of point of inflection. In a recent study (Darmani Kuhi et al., Reference DARMANI KUHI, PORTER, LOPEZ, KEBREAB, STRATHE, DUMAS, DIJKSTRA and FRANCE2010), it was stated that the equations with a fixed point of inflection such as the Gompertz and Logistic may cause limitations, whereas the use of the models with a flexible inflection point, such as Richards, can give better results. This view is widely held; however, Gompertz and Logistic have been the two most used models in the studies performed so far. In this review, the studies concerned have been summarised under the titles ‘determination of the best-fitting growth model’, ‘a comparison of the growth of poultry species or various experimental groups’, and ‘genetic parameter estimates for growth curve parameters’. When the variation of the studies by year is examined, it is possible to state that the studies to determine the best-fitting model for different poultry species have decreased. Furthermore, there is a need for studies to transform the existing growth models into a more mechanistic form. It has been seen that there was an increase in the studies concerned upon the use of different algorithms (e.g. artificial neural networks, data mining, and the Bayesian framework) in growth modelling particularly for the last decade, and there are only a limited number of published studies where the methods concerned are used for growth in poultry. It is estimated that there will be an increase in the use of non-linear mixed effects models in the studies to be performed to compare the growth of different groups (e.g. sex, genotype, and various experiments). It is necessary to have studies on the utilisation of growth curves in the inheritance of growth curve parameters and genetic-genomic selection studies in different poultry species.