I. INTRODUCTION
It is well known that significant improvements can be achieved in properties such as hardness, strength, and wear resistance for electrodeposited nickel when its grain size is reduced to the nanocrystalline regime (e.g., Refs. Reference Safranek1–Reference Erb, Aust, Palumbo and Koch5). However, nanocrystalline metals generally show limited ductility in comparison with their conventional coarse-grained counterparts, regardless of their synthesis method.Reference Kumar, Van Swygenhoven and Suresh6,Reference Koch7 Often the low ductility results from early onset of localized deformation, e.g., necking and/or shear bands, a phenomenon due to the lack of sufficient strain hardening capacity required to sustain uniform plastic deformation.Reference Ebrahimi, Zhai and Kong8–Reference Ma10
Indeed, considerably reduced strain hardening capacity has been observed in nanocrystalline metals. For example, tensile test results showed that strain hardening decreased with decreasing grain size and even diminished to zero, i.e., perfectly plastic deformation, at very small grain size for nanocrystalline Ni and Zn (e.g., Refs. Reference Wang, Wang, Aust and Erb4 and Reference Koch11). Moreover, little or no strain hardening was observed after cold rolling up to 76% of thickness reduction at room temperature for nanocrystalline Ni with an initial grain size of 30–40 nm.Reference Kulovits, Wao and Wiezovek12 While low strain hardening was reported in most studies on nanocrystalline metals as per tensile testing, it was found in an investigation that deformation by rolling of nanocrystalline Ni (20 nm grain size) at cryogenic temperature induced significant strain hardening.Reference Wu, Zhu, Wei and Wei13 This discrepancy in the reported strain hardening behavior manifests the complexity of plastic deformation mechanisms for nanocrystalline metals in general, whereby multiple factors including average grain size, grain size distribution, temperature, and loading conditions can play significant roles during deformation. Despite the substantial progress through many experimental and simulation studies in recent years, the issue of deformation mechanisms as well as strain hardening is not fully understood and still a subject of great interest for nanocrystalline metals (e.g., Refs. Reference Koch7 and Reference Meyers, Mishra and Benson14).
In this study, the strain hardening behavior was investigated through a multiaxial indentation loading, a condition that is different from those widely used in previous studies on nanocrystalline materials, e.g., uniaxial tensile loading and compressional rolling. Examination was performed on nanocrystalline Ni electrodeposits with average grain sizes less than 30 nm, a size range where multiple deformation processes are expected to operate during plastic deformation.Reference Schiotz, Di Tolla and Jacobson15,Reference Van Swygenhoven16 A direct comparison between the strain hardening behavior of nanocrystalline Ni and well-annealed coarse-grained Ni was carried out and the plastic deformation zone size as well as deformation mechanisms under indentation loading were explored.
II. EXPERIMENTAL PROCEDURES
High purity nanocrystalline nickel (>99.9%) samples with different average grain sizes and a minimum thickness of 1 mm were synthesized using the electrodeposition method at Integran Technologies Inc (Mississauga, Ontario).Reference Erb, Aust, Palumbo and Koch5 Fully annealed coarse-grained polycrystalline Ni was obtained from commercially available Ni 200 sheets. The microstructures of the materials were analyzed using both optical and transmission electron microscopy (TEM). All samples were locally deformed through large hardness indentations on each sample surface using a Rockwell scale D macro indenter (120° diamond cone) at a load of 100 kgf.17 As a result, a deformation zone was generated over a certain distance below the indentation tip in the form of a strain gradient. Then, cross-sections of each Rockwell indentation were carefully prepared through grinding and polishing for hardness profile measurements. To minimize and/or remove the artificially introduced surface deformation, standard metallographic procedures were strictly followed, using progressively finer polishing media.Reference Samuels18 Extra care was taken during the final stage of surface polishing conducted with the 0.05 μm alumina suspension. Two benchmark samples, the annealed coarse-grained commercial Ni (soft and high strain hardening) and the as-deposited nanocrystalline Ni, were used to examine the effectiveness of the preparation procedure in removing residual surface deformation. For both samples, the measured hardness values were essentially the same before and after the preparation, suggesting that the preparation procedure introduced little surface deformation and had negligible contribution to strain hardening.
To investigate the strain hardening behavior, micro-hardness profiles were generated as a function of distance away from the Rockwell indentation tip region, i.e., along the strain gradient shown in Fig. 1, using a Vickers micro-hardness. As per the ASTM standard for hardness testing, the indentations were spaced apart at least 2.5 times the indentation width to minimize hardening effects between neighboring Vickers indents.19 Vickers micro-hardness was tested at 100 g load with 10 s loading time.
Cross section through a Rockwell indentation and plastic deformation zone (pink area).

III. RESULTS AND DISCUSSION
A. Microstructure and average bulk hardness
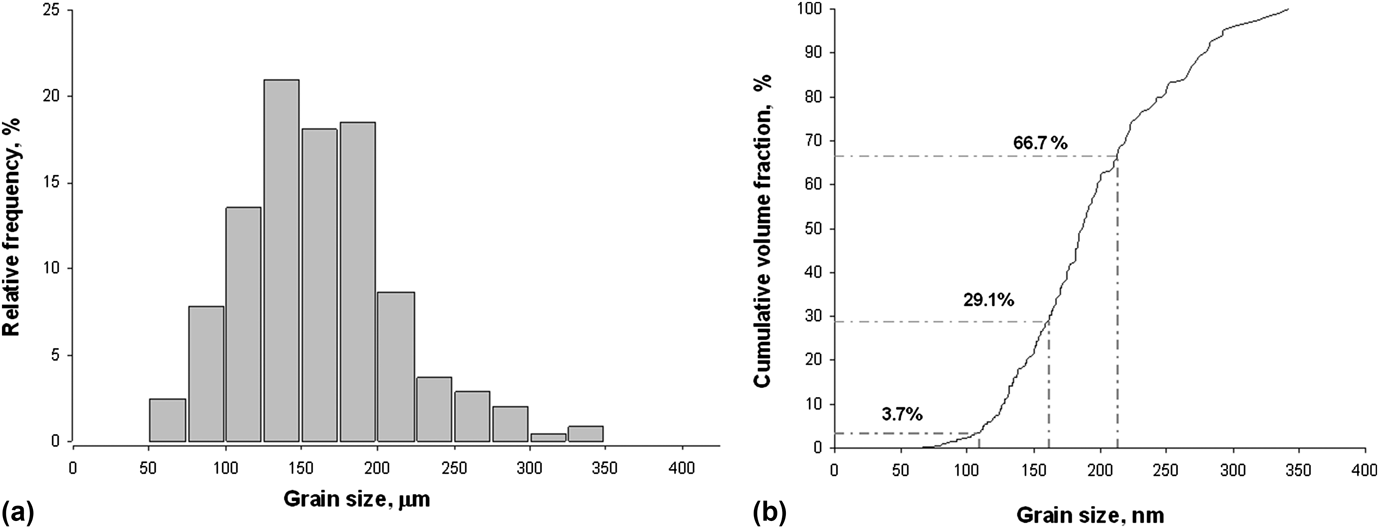
Figure 2 shows a representative microstructure of the fully annealed coarse-grained nickel sample, Ni 1. Overall, the material consists of grains that are equi-axed in shape and separated by well defined grain boundaries. A detailed analysis was carried out on a series of optical micrographs, and a total of 340 grain sizes were measured. The results are summarized in Fig. 3 in the form of grain size distribution [Fig. 3(a)] and cumulative volume fraction [Fig. 3(b)] graph.
Optical micrograph for coarse-grained nickel, Ni 1.
Grain size distribution histogram (a) and cumulative volume fraction (b) as a function of grain size for coarse-grained Ni, Ni 1.
For the coarse-grained Ni 1, the grain size distribution is close to log-normal, with an average grain size of 161 µm and a SD of ±52 µm [Fig. 3(a)]. Regarding material properties, information on entity volumes as shown in cumulative volume fraction graph is usually more relevant than grain size distribution histograms. A widely used approach in estimating various materials properties, the rule-of-mixture, is based upon individual component volume fractions. The cumulative grain volume fraction of this sample is shown in Fig. 3(b), providing structural information quantitatively different and supplementary to the grain size (number) distribution in Fig. 3(a).
It shows that the coarse-grained Ni 1 comprises almost entirely of the grains with size larger than 100 µm in volume with negligible volume amount (less than 2%) of grains smaller than 100 µm, although the latter account for approximately 10% in number counts (Fig. 3). In addition, the grains within 1 SD of the average sizes, 109–213 µm, occupy a little over half of the total volume, 53%, not as predominant as suggested in the number counts (∼70%). This illustrates the complementary nature of the grain size number statistics [Fig. 3(a)] and cumulative volume fractions [Fig. 3(b)] in describing the microstructure of materials.
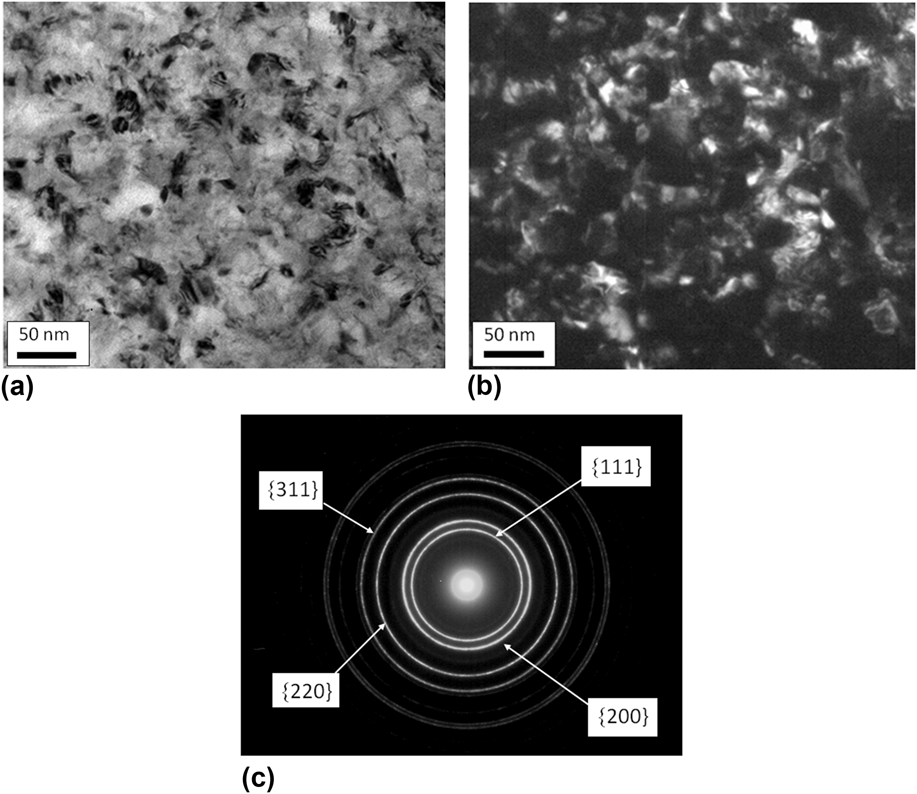
In the case of the two nanocrystalline nickel samples, the microstructures were examined using TEM. Figure 4 shows examples of bright field and dark field TEM images along with the corresponding selected area diffraction pattern (SADP) for Ni 3 (grain size 19 nm). The nano-sized grains in the sample are largely equi-axed with small aspect ratio [Figs. 4(a) and 4(b)].
Bright field TEM image (a), dark field TEM image (b) and SADP (c) of the 19 nm nickel, Ni 3.
The electron diffraction pattern is composed of multiple rings of uniform intensity, indicating a fine and not highly textured grain structure with a sufficient number of grains in each diffracting orientation [Fig. 4(c)]. All the diffraction rings were indexed to belong to the fcc nickel lattice, and the indices of the first four rings are labeled in Fig. 4(c). Essentially the same features were observed in the microstructure of the other nanocrystalline Ni sample (grain size 29 nm), e.g., fine grains with equi-axed shape without strong crystallographic texture.
Grain size analysis was performed on multiple dark field images, and approximately 400 grains were measured for each nanocrystalline Ni sample. Figure 5 shows the analysis results in the same fashion as for the coarse-grained Ni.
Grain size distribution histograms (a) and (c), and cumulative volume fractions (b) and (d) as a function of grain size for the nickel samples with 29 and 19 nm grain size, respectively.
Similar to the coarse-grained Ni, both nanocrystalline Ni samples display log-normal grain size distributions with a longer right side tails. The average grain sizes and SDs were determined to be 29 ± 12 nm and 19 ± 7 nm, respectively [Figs. 5(a) and 5(c)]. Apparently, the size distribution appears to be tighter and more grains fall within 1 SD of the average value for the 19 nm Ni. In addition, there are some differences in the cumulative volume fraction values between the two samples. For instance, the grains within 1 SD of the average grain size, 17–41 nm, comprise less than half of the sample volume, ∼41%, for the 29 nm Ni, while in the 19 nm Ni, approximately 51% of the total volume of the material consists of grains with sizes within 1 SD (12–26 nm) [Figs. 5(b) and 5(d)]. Note that Fig. 5 demonstrates again the benefit of using cumulative volume fraction. In the case of the 29 nm, the total number count for the grains larger than 50 nm appears to be small, about 6% [Fig. 5(a)], while the corresponding volume fraction of material in that grain size range accounts for more than 40% [Fig. 5(b)], an important piece of information that can be easily overlooked in the grain size distribution [Fig. 5(a)]. In contrast, no grains larger than 50 nm were found in the 19 nm Ni. This difference is of particular importance because it may have a significant effect on the materials strain hardening behavior as will be discussed in Sec. III. D.
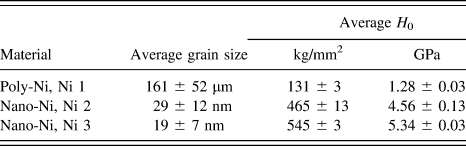
The average bulk hardness was measured according to ASTM E384 standard for Vickers micro-hardness measurements and a minimum of 10 hardness measurements were made on each sample.19Table I summarizes the values of average hardness and the grain sizes of all samples used in the current study.
Average grain sizes and Vickers microhardness of nickel specimens.
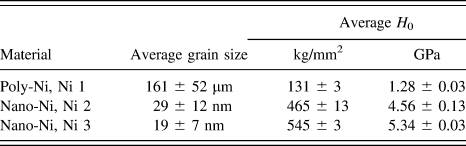
Hardness values follow the general trend of grain size strengthening, displaying higher hardness with finer grain size according to the Hall–Petch relationship. For example, the coarse-grained Ni sample with an average grain size of 161 µm exhibits a microhardness of 131 kg/mm2. As grain size decreases to 19 nm, a substantial hardness increase is observed to 545 kg/mm2, more than a 4-fold increase compared with the coarse-grained Ni. Using the hardness values of the three samples, the line slope, k HP, in the Hall–Petch relationship was determined to be 18 GPa nm0.5, which is within the value range reported for electrodeposited Ni and Ni based alloys covering large grain size range. For instance, the slope was estimated in other studies to be approximately 18 and 21 GPa nm0.5 for the electrodeposited Ni with grain size from 11 nm to 100 µm,Reference El-Sherik, Erb, Palumbo and Aust3 and 12 nm to 12 µm,Reference Hughes, Smith, Pande, Johnson and Armstrong2 respectively. In a recent study on electrodeposited Ni and Ni–Fe alloys with average grain size range from 10 to 81 nm, the value of k HP was determined to be 24 GPa nm0.5.Reference Giallonardo, Erb, Aust and Palumbo20
B. Strain hardening behavior
To investigate strain hardening in these materials, a series of microhardness measurements were carried out across the deformation zone and along the strain gradient introduced by the Rockwell D hardness indenter. Examples of cross sections with a Rockwell indentation tip region at the top, and the Vickers micro-hardness indentation profiles below the tip are shown in Fig. 6 for the coarse-grained Ni (Ni 1) and the nanocrystalline Ni with grain sizes at 29 nm Ni (Ni 2) and 19 nm (Ni 3), respectively. Note that the micrograph for the coarse-grained material was taken at a lower magnification.
Optical micrographs of Vickers micro-hardness indentations under the Rockwell D plastic zone of: (a) coarse-grained Ni 1 and (b) nanocrystalline Ni 2 (29 nm) and (c) nanocrystalline Ni 3 (19 nm). The red dotted line indicates the approximate location of the plastic deformation zone border.
Most plastic deformation occurred closest to the edges of the Rockwell indentation tips, the plastic deformation core. As the distance from the tip increases, local strain gradually diminishes and approaches zero at the border between the deformation zone and the plastically undeformed material, i.e., there is a strain gradient as a function of the distance away from the Rockwell indentation tip. Hardness profiles can be visually assessed through the Vickers microhardness indentation sizes. For the coarse-grained Ni, the indentation size increases gradually with increasing distance away from the Rockwell deformation core [Fig. 6(a)]. Since the load in the Vickers hardness measurements was kept constant (100 g), the indentation size increase results primarily from the local hardness decrease. This softening trend correlates with a continuous decrease of strain along the strain gradient. In comparison, the two nanocrystalline Ni samples exhibit very different behavior. Generally much smaller variations were observed among the indentation sizes across the measured regions [Figs. 6(b) and 6(c)], suggesting that the hardness is not very sensitive to the location within the plastic deformation zone for the two nanocrystalline Ni samples. This visual examination corresponds well with the quantitative hardness profiles summarized in Fig. 7.
Comparison of Vickers micro-hardness within the plastic zone for coarse-grained and nanocrystalline Ni samples, (a) measured hardness values and (b) normalized hardness. The red dotted lines and black dashed-dotted lines in (a) are the bulk average hardness values (H 0 in Table I) and the associated 1 SD range for each material, respectively.
For the coarse-grained Ni 1, the maximum Vickers hardness is 258 kg/mm2 at the location immediately adjacent to the Rockwell indentation tip, the deformation core. The Vickers hardness value decreases gradually with increasing distance away from the core and approaches the average bulk hardness of ∼131 kg/mm2 at the end of hardness profile, approximately 1200 µm away from the Rockwell tip [Fig. 7(a)]. This hardness profile reveals a strain gradient over a large distance, i.e., a large plastic deformation region extending over several grain diameters. Moreover, the significant change in hardness embodies the classic case of strain hardening for conventional coarse-grained materials.
In contrast, both nanocrystalline Ni samples, Ni 2 and Ni 3, displayed significantly reduced strain hardening. However, the extent of reduction is different between Ni 2 and Ni 3. For the 29 nm Ni 2, the hardness of the near-tip location has a value of 485 kg/mm2. At a distance of approximately 200 µm and beyond, the local hardness is essentially constant within 1 SD value range of the bulk average hardness, 465 ± 13 kg/mm2 [Fig. 7(a)]. For the 19 nm Ni 3, strain hardening was hardly discernable; variation of the measured hardness values was insignificant with respect to the statistical range of the bulk average hardness of 545 ± 3 kg/mm2 across the entire profile [Fig. 7(a)]. Overall, both nanocrystalline Ni samples displayed very limited or no strain hardening capacity in comparison with the coarse-grained counterpart.
The differences in strain hardening capacity between coarse-grained and nanocrystalline Ni samples can be more clearly demonstrated using hardness values at a distance x from the Rockwell indentation (H x) normalized to the corresponding average bulk values (H 0 in Table I) as shown in Fig. 7(b). It can be seen that strain hardening can lead to approximately 2-fold increase of hardness for the coarse-grained Ni, evidence of high strain hardening capacity. Substantial reduction in strain hardening is demonstrated in terms of nearly horizontal lines for the two nanocrystalline Ni samples. Moreover, the strain hardening decreases further at smaller grain sizes, continuing a trend recently reported for electrodeposited nanocrystalline nickel with a grain size of 100 nm Ni.Reference Tang, Erb and Brooks21 This trend can likely be attributed to the underlying deformation mechanisms, which will be discussed in Sec. III. D.
Some discussion is necessary to address possible indentation size effects (ISE) on microhardness values, since all measurements were made at the same load of 100 g and the hardness reading varied only with the indentation size in the current study. Previous experimental and theoretical studies have shown that the extent of ISE is closely related to grain size for polycrystalline materials (e.g., Refs. Reference Conrad, Feuerstein and Rice22–Reference Hou and Jennett26). Negligible ISE was predicted and observed in materials with grain sizes ranging from a few micrometers down to 10 nm, when the indentation size in terms of the ratio of indentation radius, a, over grain size, d, was sufficiently large (higher than 10).Reference Hou and Jennett26,Reference Hou, Jennett and Parlinska-Wojtan27 For the 19 and 29 nm Ni materials in the current study, all the indentations generated during the hardness measurements exhibited indentation radius, a, larger than 9 μm as per the indenter geometry function, which is equivalent to the ratio of a/d more than 300, well above the reported threshold value of 10 for the negligible ISE contribution (less than 1%).Reference Hou and Jennett26,Reference Hou, Jennett and Parlinska-Wojtan27
In the case of the 161 μm Ni, the ratio of a/d was lower than 10 and noticeable ISE could be expected, which may be quantitatively assessed based on a model developed from dislocation slip distance theory.Reference Conrad, Feuerstein and Rice22,Reference Dunstan, Ehrler, Bossis, Joly, P’ng and Bushby24 According to the model, the correlation among measured hardness, H, and contributions from the ISE and materials microstructure can be summarized by a Hall–Petch type equationReference Hou and Jennett26:
 $$H = {H_0} + \sqrt {{{{k_1}} \over a} + {{{k_2}} \over d} + {k_3}\sqrt \rho } \quad ,$$
where H 0 is the hardness corresponding to material yield stress, and a, d, and ρ are indentation radius, grain size, and dislocation density, respectively. The constant k 1 is the indenter geometry factor expected to vary between 0.5 and 1 GPa2 μm, while constant k 2 is closely associated with the Hall–Petch slope, k HP, obtained through uni-axial mechanical testing, and k 3 is a scaling constant without much physical significance.Reference Hou and Jennett26 To estimate the ISE contribution, Eq. (1) can be further simplified by introducing two factors, the indentation size factor F a and the structural size factor F s that combines the effects of grain size and dislocation density, i.e., d and ρ:
 $${F_{\rm{a}}} = {{{k_1}} \over a}\quad ,$$
 $${F_{\rm{s}}} = {{{k_2}} \over d} + {k_3}\sqrt \rho \quad .$$
Thus,
 $$H = {H_0} + \sqrt {{F_{\rm{a}}} + {F_{\rm{s}}}} \quad .$$
Conceptually, hardness free of the ISE would be obtained at a = ∞ (or F a= 0), i.e., very large indentations. Then, the hardness contribution due to the ISE, ΔH ISE, can be defined as the difference between hardness with and without the ISE,
 $$\Delta {H_{{\rm{ISE}}}} = \sqrt {{F_{\rm{a}}} + {F_{\rm{s}}}} - \sqrt {{F_{\rm{s}}}} \quad .$$
Combining Eqs. (4) and (5) gives
 $$\Delta {H_{{\rm{ISE}}}} = \left( {H - {H_0}} \right) - \sqrt {{{\left( {H - {H_0}} \right)}^2} - {F_{\rm{a}}}} \quad .$$
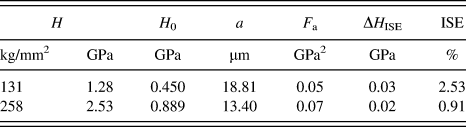
Note that H 0 values are sensitive to processing history, e.g., different in the annealed state than in the strain hardened state. For the 161 μm Ni, the annealed state H 0 can be obtained using the tensile yield stress of annealed commercially pure Ni, σy = 150 MPa,Reference Gale and Totemeier28 and the Taylor relationship, i.e., H 0 = 3σy= 450 MPa. In the case of the strain hardened state, the H 0 may be estimated through an assumption that the H 0 increases proportionally as the increase of the measured hardness, H, with respect to the annealed state. For instance, the measured hardness values are 131 (Table I) and 258 kg/mm2 [Fig. 7(a)] in the annealed and strain hardened state for the 161 μm Ni, respectively. Based on the assumed proportionality, it yields the H 0 for the strain hardened Ni as 450 × 258/131 = 889 MPa. The maximized indentation size factor, F a, can be estimated by assuming upper limit value of k 1 =1 GPa2 μm and applying the indenter geometry function for a value. Thus, ΔH ISE can be readily determined as a function of measured hardness, H, according to Eq. (6) and the results are summarized in Table II for the 161 μm Ni at the average hardness (Table I) and peak hardness [Fig. 7(a)] of 131 and 258 kg/mm2, respectively.
Contribution of ISE to the 161 μm Ni sample hardness.
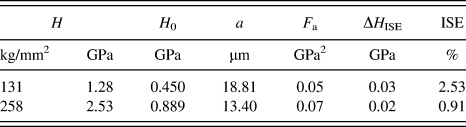
It can be seen that the contribution of the ISE exhibits same magnitude as the SD of the microhardness measurement, less than 3% of the 161 μm Ni sample hardness (Table I). In other words, it is the sample microstructure that contributed predominantly to the measured hardness profiles for both the nanocrystalline and coarse-grained Ni materials in the current study. Specifically, the hardness profiles can be directly attributed to the variations of local dislocation density level according to Eq. (1) because sample grain size is not expected to change significantly during the hardness measurements, revealing the classic correlation between strain hardening and dislocation interaction.
C. Plastic deformation zone size under Rockwell indentations
Deformation zone size under indentation loading has been a subject of experimental investigation for decades (e.g., Refs. Reference Tabor29–Reference Chaudhri32). Among these studies, the definition of the plastic deformation zone size can vary from one to another. To facilitate comparison, the plastic deformation zone size is defined as z/h in the current study,Reference Revankar33 where z is the distance from the sample surface to the plastic deformation zone border and h is the indentation depth. This definition is in accordance with the convention in hardness measurements, whereby indentation depth is used as reference unit, and the minimum sample thickness is recommended to be 10 times the indentation depth value or 10h to minimize plastic zone effects.Reference Revankar33
Comprehensive finite element simulations have shown that the plastic deformation zone size under indentation has a strong dependence on the extent of material strain hardening (e.g., Refs. Reference Hill, Storakers and Zdunek34–Reference Mata, Casals and Alcala36). According to one analysis, the zone size could be tripled when the strain hardening index increases from 0 to 0.4 for a material with a given strength.Reference Mata, Casals and Alcala36 Hence, the zone size for both nanocrystalline Ni materials is expected to be closer to materials having low strain hardening, e.g., cold-worked materials, while the coarse-grained Ni can be better compared with high strain hardening materials.
High strain hardening materials are usually associated with fully annealed materials. An early study showed the zone size of fully annealed brass to be 15 and 12 under spherical and Vickers indenter, respectively.Reference Samuels and Mulhearn37 Furthermore, the zone size was found to depend on sample size and/or thickness. For instance, the zone size increased from 12 to 18 for fully annealed brass when the sample thickness was reduced from large or semi-infinite to a value comparable to the zone size under Vickers indenter.Reference Samuels and Mulhearn37 In another study, the zone size of fully annealed Cu was found to be approximately 18, using a spherical indenter.Reference Chaudhri32 Using this value range of 12–18, the plastic deformation zone size is expected to be 2.5–3.8 mm based on the Rockwell indentation depth (h) of 213 µm measured from the cross-sectional micrograph for the fully annealed coarse-grained Ni in this study. This estimated zone size goes beyond the region that was investigated (Fig. 7]) during the hardness profile measurements for the sample. Close examination revealed that there is still some measurable strain hardening at the end of the hardness trace, i.e., 1200 µm below the Rockwell indentation tip, as shown in Fig. 7(b). This suggests that the location of 1200 µm below the tip may still be within the deformation zone. On the other hand, another studyReference Chaudhri32 showed that for fully annealed Cu, most strain hardening is concentrated in the first half of the deformation zone; the normalized hardness decreased from the maximum of 2.1 down to 1.1 in the middle of deformation zone, specifically at the depth of 9h below the surface. It took the other half of the deformation zone for the strain hardening to diminish from 1.1 to 1.0 at a depth of 18h, the border of the deformation zone (z).Reference Chaudhri32 For the coarse-grained Ni in this study, a similar maximum strain hardening of approximately 2 was observed immediately adjacent to the Rockwell indentation tip [Fig. 7(b)]. The strain hardening decreased to 1.1 at approximately 1000 µm, i.e. at the depth of 5.7h. Assuming the same hardening behavior as in the case of fully annealed Cu, the location of 5.7h is expected to be half way across the deformation zone, and thus the zone border can be estimated to be at 11.4h or 2.4 mm below the sample surface. This zone size of 11.4 for the coarse-grained Ni is actually in line with the reported range of 12–18 for high strain hardening materials.Reference Chaudhri32,Reference Samuels and Mulhearn37
Regarding low strain hardening materials, one early study showed that the zone size of 25% cold-rolled Cu and steel increased with the angle of cone indenters. Under a 120° cone indenter, the same type as the Rockwell D indenter used in this study, both cold-rolled Cu and steel displayed a zone size, z/h, of approximately 3.5.Reference Dugdale38 In another study, cold-drawn mild steel exhibited a zone size of 3.5 and 4.5 under Vickers and spherical indenters, respectively.Reference Chaudhri39 A similar value for the zone size (z/h), 3.8, was obtained in a recent simulation under a 120° cone indenter for a hypothetical material having strain hardening index of 0.1.Reference Cheng and Li40 In the current study, the indentation depth, h, for the limited strain hardening sample, the 29 nm Ni 2, was determined to be approximately 54 µm based on cross-section micrograph measurements. Using the reported zone size range of 3.5–4.5, the border of the plastic deformation zone, z, is expected to be somewhere between 189 and 243 µm below the sample surface, which is practically the case for Ni 2. As mentioned in the Sec. III. B, the local values of hardness exhibited essentially the bulk value at the distance of approximately 200 µm below the Rockwell indentation tip. With the addition of the indentation depth (h) of 54 µm for the Rockwell indentation, a value of 254 µm is obtained as the zone border (z) for Ni 2, since z is defined as the distance below the sample surface. In other words, the plastic deformation zone size, z/h, is approximately 4.7 for the 29 nm Ni, which is very close to the upper bound of the reported zone size range of 3.5–4.5 from previous studies on low strain hardening materials. Note that for clarity, only one trace of measurements is shown in Fig. 7. More traces of measurements were performed on all samples. The location of the zone border is schematically indicated as a dotted line in Fig. 6(b).
For the other nanocrystalline nickel material, the 19 nm Ni 3, the plastic deformation zone is even more difficult to estimate based on the microhardness profile due to the lack of discernible strain hardening even with more measurements in the region close to the indentation tip (Fig. 7). It is possible that the Vickers hardness indenter used in the profile measurement does not have sufficient spatial resolution to resolve very small regions of strain hardening, if any, for this material. Testing methods with smaller indentation size, e.g., nanoindentation, may provide better resolution and are therefore recommended for future studies on the deformation zone size of very low strain hardening materials.
In short, strain hardening was clearly observed in the plastic deformation zone under the Rockwell indentation for coarse-grained Ni. The 29 nm nanocrystalline Ni sample exhibited a rather limited zone size similar to those observed in coarse-grained materials with reduced or limited strain hardening capacity. Lacking sufficient hardening, the zone size cannot be determined using the hardness profile approach for the 19 nm nanocrystalline Ni sample.
D. Deformation mechanisms and loading mode
Limited or no strain hardening has been reported in numerous previous studies using other deformation methods for ultrafine grained and nanocrystalline copper and nickel in contrast to high level of strain hardening in the coarse-grained counterparts (e.g., Refs. Reference Wang, Wang, Aust and Erb4 and Reference Thompson41–Reference Franek, Kratochvil, Saxlova and Sedlacek44). The significantly reduced strain hardening likely results from the inability to generate high dislocation interaction and densities during deformation.
For coarse-grained polycrystals (grain size above 1 µm), it is well-established that plastic deformation takes place through mechanisms dominated by dislocation interactions in grain interiors, i.e., dislocation-mediated (DM) mechanisms; dislocation density increases as deformation intensifies, leading to substantial strain hardening (e.g., Refs. Reference Taylor45–Reference Hertzberg47). DM mechanisms explain the significant strain hardening observed in the coarse-grained Ni sample of this study, whereby all grains have sizes greater than 50 µm and more than 96% of the sample volume is occupied by grains with sizes above 100 µm as shown in Figs. 2 and 3. Generally, the stress required for dislocation activities, e.g., Frank–Read type of dislocation bowing out, is proportional to μb/L, where μ and b are respectively material shear modulus and Burgers vector, and L is the distance of dislocation pinning points, usually smaller than grain size.Reference Hirth and Lothe48 As grain size of the material decreases down to the nanocrystalline range, dislocation-based mechanisms may no longer operate as the dominant processes during plastic deformation because the space confinement in nanometer grains can result in the stress surpassing fracture strength (e.g., Ref. Reference Legros, Elliott, Rittner, Weertman and Hemker49). It has been shown that dislocation-based deformation mechanisms become less important; instead grain boundary controlled (GBC) mechanisms, e.g., grain boundary sliding and grain rotation, gain significance and may account for significant amounts of deformation at grain sizes below 30 nm (e.g., Refs. Reference Meyers, Mishra and Benson14 and Reference Hahn, Mondal and Padmanabhan50). Moreover, dislocation activity in grain interiors disappears at grain sizes smaller than 10 nm and deformation is completely controlled by mechanisms associated with grain boundaries (e.g., Refs. Reference Van Swygenhoven, Spaczer and Caro51 and Reference Conrad52). Hence, as grain size decreases, a gradual transition from DM to GBC mechanisms should occur before GBC mechanisms dominate completely. The specific values of the grain size range in which this transition takes place likely depends on the type of nanocrystalline materials. No significant change in dislocation density is expected during the two stages of deformation, i.e., transition to and the dominance of GBC mechanisms. Molecular dynamics simulations have shown that due to space confinement in the fine grain size, dislocations generated during deformation migrate through the grain interior with most of them eventually being absorbed into grain boundaries before having an opportunity to interact with each other (e.g., Refs. Reference Van Swygenhoven, Spaczer, Farkas and Caro53–Reference Yamakov, Wolf, Phillpot, Mukherjee and Gleiter55). It is important to note that the dislocation density in nanocrystalline nickel produced by the electrodeposition method was found to be rather low in the as-electrodeposited state.Reference Giallonardo, Avramovic-Cingara, Palumbo and Erb56–Reference Wu, Ma and Zhu58 An obvious consequence of this is a low storage capacity for dislocations, i.e., low dislocation density/interaction in grain interiors, resulting in low strain hardening. Further grain size reduction leads to the dominance of GBC mechanisms, whereby plastic flow requires little involvement of dislocation activity, thus insignificant strain hardening.Reference Van Swygenhoven, Spaczer, Farkas and Caro53,Reference Van Swygenhoven, Derlet and Hasnaoui54
Specifically for nanocrystalline Ni with an average grain size of 30 nm, experimental measurements of the activation volume for dislocation migration suggested very few obstacles for mobile dislocations migrating through the grain interior,Reference Wang, Hamza and Ma59 and the dominance of GBC mechanisms was observed in an in situ TEM tensile study on a 10 nm nickel sample.Reference Shan, Stach, Wiezorek, Knapp, Follstaedt and Mao60 Regarding the grain size range for the transition of deformation mechanisms in Ni, important clues can be found in a review of data on the strain rate sensitivity (SRS), a parameter closely associated with the underlying mechanisms.Reference Gu, Lian, Jiang and Zheng61 Over a wide grain size range from 10 nm to 100 μm, a clear trend was observed with high consistency based upon extensive data obtained through different testing methods, e.g., tensile tests at different stain rates, stress relaxation,Reference Wang and Ma62 and strain rate jump tests.Reference Dalla Torre, Spatig, Schaublin and Victoria63 A steep increase in the SRS values up to 0.03 occurred in the grain size range between 10 and 50 nm, while the SRS values showed little variation and remained below 0.005 in the broad 50 nm–100 μm range,Reference Dalla Torre, Spatig, Schaublin and Victoria63 essentially the same value as the reported 0.001–0.004 range for coarse-grained Ni.Reference Dalla Torre, Van Swygenhoven and Victoria9 This is in agreement with a simulation study on Ni, whereby a transition in the deformation mechanism from grain-interior shearing to grain-boundary shearing was observed as grain size decreased from 50 to 10 nm.Reference Wei, Su and Anand64 These observations may help understand the subtle differences in the strain hardening behavior for the two nanocrystalline Ni materials in the current study, in particular when the cumulative volume fractions of grain sizes are considered [Figs. 5(b) and 5(d)].
For the 29 nm Ni 2, grains may be categorized into two groups according to their sizes, Group 1 of 50–100 nm and Group 2 of smaller than 50 nm. Despite small in number count (less than 7%), grains in Group 1 (50–100 nm) occupy about 40% of the total sample volume [Fig. 5(b)]. Deformation in these grains is expected to be dominated by DM mechanisms, and dislocation density in these large grains can reach a level, which leads to evident strain hardening. On the other hand, Group 2 consists of grains with sizes of 10–50 nm, occupying approximately 60% of the sample volume. This is the grain size range where the transition from DM to GBC mechanisms takes place and for which grain boundaries acting as dislocation sources and sinks have been observed (e.g., Ref. Reference Meyers, Mishra and Benson14). Therefore, low dislocation generation and thus significantly reduced strain hardening are expected during the deformation of the grains in this group. Combined, the hardening of the large grains (∼40% in volume) and the insignificant hardening of the small grains (∼60% in volume) account for the noticeable yet overall reduced hardening for the 29 nm Ni sample compared with the coarse-grained Ni material.
Similarly, the grains in the 19 nm Ni 3 material may also be classified into two groups, Group 1 of 10–50 nm and Group 2 of smaller than 10 nm [Fig. 5(d)]. Note that the absence of grains with sizes greater than 50 nm is a key difference in the microstructure in comparison with the 29 nm Ni 2. As a result, deformation in the Ni 3 is governed either by the transition from DM to GBC mechanisms in the regions occupied by the 10–50 nm grains (Group 1) or through the dominance of GBC mechanisms in the regions filled with very small grains (less than 10 nm, Group 2). Both groups of grains share a common feature during deformation: insignificant dislocation generation/interaction, therefore leading to the overall negligible level of strain hardening for the 19 nm Ni 3.
Loading conditions may have an influence on the hardening behavior. To explore this aspect, uniaxial tensile tests were performed according to ASTM E 8M at a strain rate of 5 × 10⁻³ s−1 on specimens sectioned from the same batch of 29 nm Ni. To ensure reliable measurements, the specimens were prepared into a standard dog-bone shape with a dimension of 50 mm overall length, 16 mm gauge length, and 1.8 mm gauge width as well as 0.5 mm in thickness. A typical strain–stress curve is shown in Fig. 8.
Room temperature uniaxial tensile stress–strain curve for the 29 nm Ni at a strain rate of 5 × 10⁻³ s−1.
Here the key values obtained from the test are the (true) yield stress and strain, σy = 890 MPa, the (true) ultimate tensile strength (UTS) and strain, σuts = 1487 MPa and εu = 4.5% as well as (true) strain at fracture, εf = 8.0%. Using Holloman's power law, the corresponding hardening index was determined to be 0.20, which is clearly lower than the value for annealed coarse-grained nickel, e.g., 0.43 (grain size = 95 μm).Reference Srinivas, Malakndaiah and Rama Rao65 It is evident that the nanocrystalline Ni has reduced strain hardening in uniaxial tensile testing compared with coarse-grained nickel, in agreement with the observation as per hardness profile approach for the case of multiaxial indentation.
On the other hand, the increase from σy to σuts suggests that there is still strain hardening in nanocrystalline nickel as high as a factor of 1.6 (σuts/σy). This is much greater than the maximum hardening value, approximately 1.04 [Fig. 7(b)], measured as per hardness profile approach for the same material. To better understand the discrepancy in the hardening magnitude, analysis on the strain field under the multiaxial indentation can provide valuable insight.
Numerous experimental and Finite Element Modeling (FEM) studies have been done to map out quantitatively the strain field underneath indentations of various shapes (e.g., Refs. Reference Williams and O’Neill30–Reference Chaudhri32 and Reference Mata, Anglada and Alcala35–Reference Cheng and Li40). Generally, materials with higher hardening index exhibit both larger strain field and more intense deformation at a given indentation condition. For the conical indentation, the same type as in Rockwell D, recent FEM studies (e.g., Refs. Reference Mata, Anglada and Alcala35 and Reference Mata, Casals and Alcala36) have shown that at the region beyond one indentation depth, 1h, away from the indentation tip, local plastic strain decreases with increasing distance away from the tip. Moreover, simulation of two materials with the same yield stress, σy = 400 MPa, but different Youngs moduli, E = 70 GPa and E = 200 GPa, indicated that the local strain at 1.6h away from the tip was 10% in the former, while the latter exhibited 13.2% local strain at 1.4h away from the tip. Note that both materials had a hardening index of 0.2, the same as that of the 29 nm Ni. This relevant information provides a quantitative basis to estimate the strain magnitude under the Rockwell D indentation for the 29 nm Ni.
In the corresponding hardness profile, the measurement point closest to the tip was at the location 64 μm or 1.2h away from the tip, given the Rockwell D indentation depth of 54 μm, or h = 54 μm. As a result, the local strain at this point is estimated to be more than 10%. This suggests that the measured region in the hardness profile [Fig. 7(a)] covered a strain gradient from zero up to more than 10% for the 29 nm Ni sample. This strain range is clearly wider than that of the uniaxial tensile testing (Fig. 8), and the sample is expected to undergo similar magnitude of strain hardening, i.e., a factor of 1.6 hardening. Therefore, it is unlikely that the observed reduced magnitude of hardening, a factor of 1.04, resulted from insufficient strain under the Rockwell indentation. Rather, it may be attributed to the nature of hardness measurement on nanocrystalline materials. Clearly, further FEM analysis should address this issue.
Earlier studies on nanocrystalline materials both through experimental as well as modeling efforts (e.g., Refs. Reference Sanders, Youngdahl and Weertman66–Reference Carlton and Ferreira75) have attempted to relate hardness, H, to yield strength, σy, through a relationship in the form of H = 3σy. This means that for the 29 nm nickel investigated in the current study a yield strength of 4.56 GPa/3 = 1.52 GPa should have been expected from the hardness measurements. Yet the tensile curve clearly shows that the material begins to yield at 0.89 GPa and shows considerable hardening between σy (=0.89 GPa) and σuts (=1.487 GPa). On the other hand, Brooks et al.Reference Brooks, Lin, Palumbo, Hibbard and Erb76 pointed out that the relationship of H = 3σuts is a much better one for electrodeposited nanomaterials provided that the material is sufficiently ductile to sustain tensile deformation before the onset of necking instability. For the nanocrystalline material tested in uniaxial tension here this is clearly the case. The predicted hardness from the tensile results is H = 3 × 1.487 GPa = 4.46 GPa, which is very close to the measured value of 4.56 GPa (Table I).
Since hardness seems to be indeed a measure of UTS rather than yield strength even in nanomaterials that do show work hardening, it would be interesting to compare hardness and tensile strength data for nanomaterials that have gone through considerable prior deformation (e.g., by rolling) before hardness and tensile testing. The prediction based on the results of the current hardness profile study on the nanocrystalline materials is that the UTS of such materials should not vary much with increasing prior deformation. In a previous study, hardness values determined on cold rolled nanomaterial made by electrodeposition seem to suggest little effect of cold rolling deformation on hardness.Reference Kulovits, Wao and Wiezovek12 However, no corresponding tensile data were presented so far. Our future work will address this prediction.
IV. SUMMARY
The strain hardening of electrodeposited nanocrystalline nickel (grain sizes: 29 and 19 nm), together with fully annealed coarse-grained nickel (grain size: 161 µm), was studied through multiaxial loading using Rockwell D hardness indentation to generate strain gradients. The strain hardening was examined on the indentation cross section as per a hardness profile approach along a path away from the indentation tip. Conventional strain hardening was observed in the coarse-grained nickel; the hardness increased consistently with imposed strain up to a value approximately twice that of the deformation-free area. The hardening can be attributed to dislocation interactions during deformation, i.e. the dominance of dislocation mediated deformation mechanism. In contrast, the nanocrystalline nickel exhibited very limited hardness change along the strain gradient, showing a low sensitivity to the amount of deformation, i.e., significantly reduced dislocation activity. Moreover, the 19 nm Ni displayed even less strain hardening than the 29 nm Ni, suggesting that both the dislocation mediated and GBC mechanisms are operative during the deformation in the nanocrystalline Ni materials, and the significance of the latter increases with decreasing grain sizes. This study also discussed the importance and advantage of using cumulative volume fractions as a structural characterization of nanocrystalline materials in addition to grain size distributions for the understanding and interpretation of their mechanical properties as well as underlying deformation mechanisms.
In addition, the plastic deformation zone sizes under conical Rockwell indentations were analyzed based on the measured hardness profiles. The 29 nm nanocrystalline Ni sample exhibited a zone size similar to those found in coarse-grained materials with reduced or limited strain hardening capacity, while the fully-annealed coarse-grained Ni sample revealed a zone size in line with the reported value range for high strain hardening materials. It is also shown that the microhardness-indentation size effect are negligible in both the nanocrystalline and coarse-grained materials used in this study.
ACKNOWLEDGMENTS
The authors would like to acknowledge the financial support by the Natural Sciences and Engineering Research Council of Canada (NSERC) and the Ontario Research Fund (ORF).