I. INTRODUCTION
The application of electric current during a phase transformation can cause the additional Joule heating, the instant stress, and the change of the free energy. Up to now, lots of investigations have been carried out on the effect of electric current on phase transformation.
Dolinsky and Elperin proposed that an electric current affected the dynamics of phase transition due to the following three mechanismsReference Dolinsky and Elperin1: One was associated with a Joule heating of the system. The other was associated with a change of thermodynamic pressure in the conductor. The third one was associated with a change in the configuration of an electric current due to the difference in electric conductivities between the nucleus of a new phase and the host medium.
Conrad reported that the influence of an electric current on solid state phase transformations in metals and alloys could be includedReference Conrad2: (i) precipitation of substitutional and interstitial solutes, (ii) interfacial reactions leading to intermetallic compound formation, (iii) recrystallization and grain growth. They proposed that electric current pulses (ECP) enhanced the recrystallization rate of cold worked metals and retarded subsequent grain growth.
Qin and Zhou further found that passing an electric current could produce a one-order-of-magnitude decrease in the casting grain size.Reference Qin and Zhou3 Subsequently, Zhou et al. and Wang et al. proposed that the application of a high current density ECP could enhance the phase transformation nucleation rate by dramatically reducing the diffusion activation energy.Reference Zhou, Zhang, Guo and He4,Reference Wang, Guo, Wang, Wu and Wang5 Zhu et al. and Tang et al. also proposed that the current density of ECP played important roles in significantly accelerating the diffusional phase transformations.Reference Zhu, To, Lee, Liu, Jiang and Tang6,Reference Jiang, Tang, Shek, Zhu and Xu7
Up to now, though lots of studies have been carried on the effect of electric current on solid state phase transformation in metals, our understanding of the mechanisms responsible for the influence of electric current is still very incomplete. Especially, the effect of current direction (CD) on the process of phase transformation has seldom been considered.
Conrad proposed that the extent and direction of the electric current effects depended on composition and prior treatment of the material and on the density and frequency of the current.Reference Conrad2 Dai et al. proposed that the recrystallized nuclei preferred to form along the CD when ECP was applied to a cold-rolled (CR) Fe–3%Si steel with the CD either parallel to the rolling direction (RD) or perpendicular to the RD.Reference Dai, Wang, Zhao and Zhao8 Wang et al. investigated the effect of electric CD on recrystallization rate and texture, and they proposed that due to the different driving forces for recrystallization when there was an angle between the electric CD and the RD,Reference Wang, Dai, Ma and Zhao9,Reference Wang, Zan, Wu, Gromov, Dai, Liu and Zhao10 the different nucleation rates would be obtained. As known, the nucleation and growth of grains carry out not only in the course of recrystallization but in the phase transformation process, therefore, it is possible that there also is a significant effect of CD on the phase transformation process.
In this work, some examples of experiments are given to illustrate the effect of CD on the nucleation rate of phase transformation in a Cu–Zn alloy. The samples are prepared by changing the angles with 0°, 15°, 30°, 45°, 60°, 75°, and 90° between the CD and RD, and the relative mechanism is profoundly discussed.
II. EXPERIMENTAL DETAILS
The flat samples to be used in the ECP treatment were cut from a 40% CR commercial Cu–Zn alloy sheet (Cu 63.4 mass%, Zn 36.6 mass%). By using electrospark discharge technique, dog-bone-shaped samples with 10.0 mm gage length, 5.0 mm width, and 1.0 mm thick were prepared, and the sizes of the two ends were much larger than that of the gage part. Before ECP, the samples were without any heat treating. During an alternating ECP treatment, the two ends of each sample were put into copper electrodes. Due to the excellent electrical conduction and thermal conduction of the copper, the temperature rise of the two ends was very small and could be regarded as room temperature. Thus, compared with the cooling effect of the two cool ends, a higher cooling rate could be obtained in the gage part of sample during cooling. To investigate the effect of electric CD on nucleation rate, the samples were divided according to the angle between the CD and the RD from 0° to 90° with an interval of 15°, including 0°, 15°, 30°, 45°, 60°, 75°, and 90°. To make the caused Joule heat identical, a single ECP with the same current density was exerted upon the samples (ECPed samples), respectively. The ECP treatment was performed by the discharge of capacitor banks under ambient condition, and its waveform was detected to be a damped oscillation wave using a Rogowski coil and a TDS3012 digital storage oscilloscope (Tektronix, Beaverton, Oregon). To observe structural change caused by ECP, electron micrographs of the middle parts of samples were taken with a JSM-7001F (JEOL, Akishima, Japan) field emission scanning electron microscope equipped with an electron backscattered diffraction (EBSD).
To remove the residual deformation in the surface layer of specimens for good EBSD patterns, all the surfaces were mechanically ground and polished, and the electro-polishing was subsequently carried out for the flat surfaces in a solution of 47.4% water (H2O), 23.7% ethanol (C2H5OH), 23.7% phosphoric acid (H3PO4), 4.7% isopropyl alcohol [(CH3)CHOH], and 0.5% carbamide (CH4N2O) in volume ratio at room temperature. The EBSD data were analyzed by the HKL's Channel 5 software. The “beam-controlled” mode was applied with a step size of 0.2 μm.
III. RESULTS
A. Microstructure evolution induced by ECP
Figure 1 shows the inverse pole figure (IPF) components for β phase obtained by EBSD images of samples, among which the colored one represents the different orientations of β phase and the gray one is α phase. In the CR sample A [Fig. 1(a)], the irregular shaped β phase randomly distributes at the triple junctions. The average grain size of α phase is about 35 μm. The composition of α phase is found to be 61.24 wt% Cu–38.76 wt% Zn, while that of the β phase is 54.65 wt% Cu–45.35 wt% Zn by energy dispersive spectroscopy (EDS) analysis.
The IPF components obtained by EBSD phase mapping for characterizing the α phase (marked by gray) and the β phase (marked by color) for the samples treated before and after ECP (a) as CR,Reference Wang, Dai, Wang, Tian and Zhao11 (b) 0°, (c) 15°,Reference Wang, Dai, Wang, Tian and Zhao11 (d) 30°, (e) 45°, (f) 60°, (g) 75°, and (h) 90°. The investigated surfaces (the longitudinal section) contain the CD and normal direction. The white dots represent the original α grain boundaries.

Compared with the CR one, the grain sizes of α phase in ECPed samples become smaller. For the 0°, 45°, 90° ECPed samples, the shape of β phase becomes much smoother, but even in the deformed bands without the formation of refined β phase. While for samples with the angles of 15°, 30°, 60°, 75°, it can be found that lots of refined β phases formed by consuming the original α phases distribute both along the grain boundaries and inter the α grains, especially lots of β phases preferentially form from the deformed bands. As an example for 15° samples [Fig. 1(c)], the microstructure of α phase is disposed by new formed β phase, EDS analysis shows that the composition of the α phase is 57.90 wt% Cu–42.10 wt% Zn, and that of β phase is 55.29 wt% Cu–44.71 wt% Zn, which means that the diffusion between α phase and β phase is strong during the ECP treatment. From Fig. 1, by averaging the possible displacement between the new formed refined β phase and the adjacent α phase boundaries, it can be deduced that the average displacement of the atoms is no less than 12 μm. In addition, worthy to be noted that there exists an orientation relationship between α phase and the new formed β phase, as proposed in Ref. Reference Wang, Dai, Wang, Tian and Zhao11 that the colored β grains are all belong to the β phase variants with different orientations but rotated with a family of equivalent rotation axes  $\left\langle {114} \right\rangle$ with a misorientation angle of 44.3 ± 1.5° which is close to the K-S relationship.
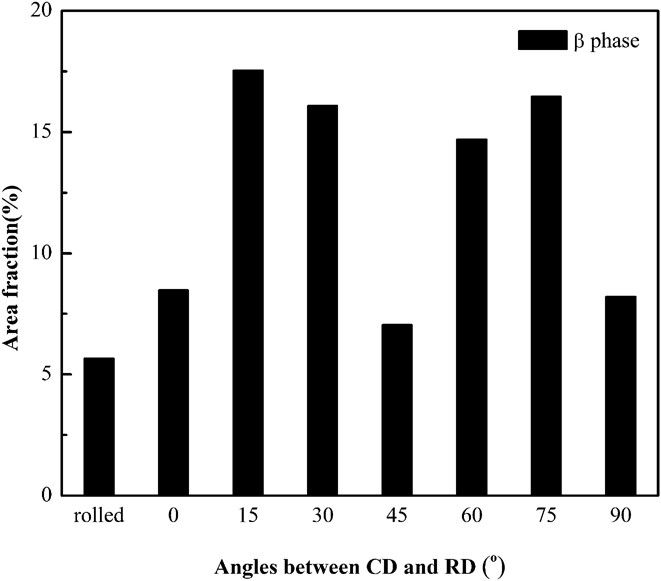
Figure 2 illustrates the average percentage of β phase in the samples treated before and after ECP treatment. If the average percentage of the β phase is assumed to be of an inverse Gaussian distribution, its saddle point is at 7.0% for the 45° samples. The different content of β phase can be seen according to the different angles between the CD and the RD, 5.6, 8.4, 17.5, 16.1, 7.0, 14.7, 16.4, and 8.2% for the as-received samples, the 0°, 15°, 30°, 45°, 60°, 75°, 90° ECPed samples, respectively. Clearly, the content of β phase in all ECPed samples is higher than that in the original CR one, which is agreed with the above mentioned that the diffusion between α phase and β phase is strong during ECP treatment.
Area fraction of β phase in the samples treated before and after ECP.
B. Anisotropic mechanical properties of samples
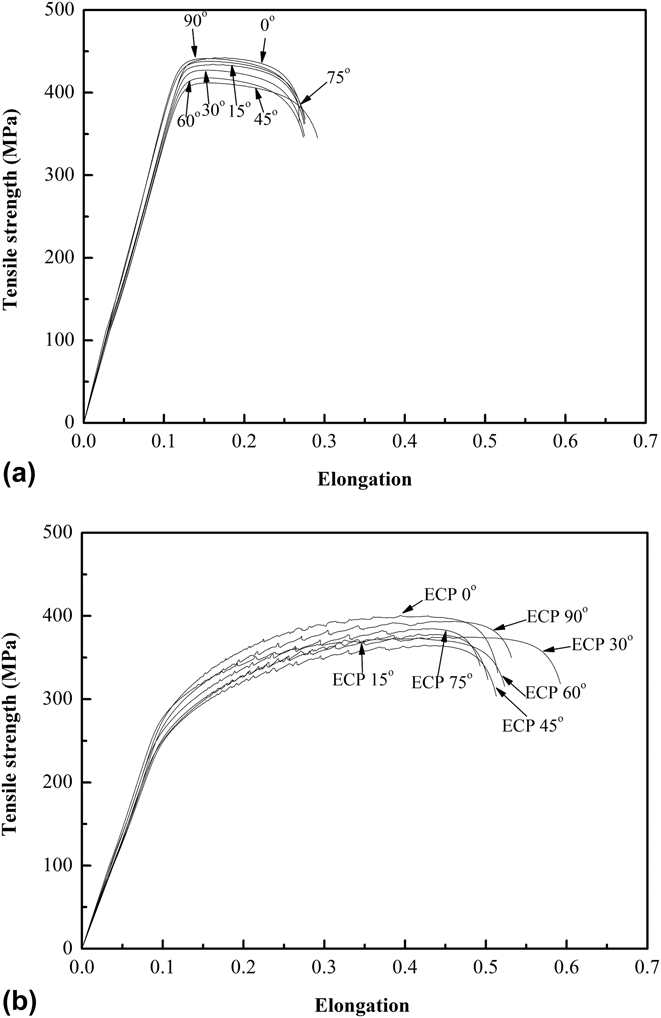
Figure 3 shows the tensile stress–strain curves tested at room temperature for the samples treated before and after ECP treatment. Three samples are tested for each group, in which the values of the strength and the elongation-to-failure are respectively scattered within ±6 MPa and ±3%; the tensile curves shown in Fig. 3 are selected near the average values. Figure 3(a) shows the stress–strain curves of the original rolled samples. It can be found that the tensile strength varies within the range between 410 and 443 MPa and the elongation fluctuates between 27 and 29%. Therein, the tensile strength of the 45° samples is the lowest one, and the almost identical strength for the 0° and 90° samples. Figure 3(b) shows the stress–strain curves of the ECPed samples. The tensile strength varies within the range between 365 and 400 MPa and the elongation varying between 50 and 60%. Compared with the rolled one, an obvious decrease of the flow stress can be found due to the application of ECP treatment, the ultimate tensile decreased averagely about 11%, while the elongation-to-failure with an improved over than 80%.
Mechanical properties of the samples treated before and after ECP (a) samples before ECP treatment, (b) treated after ECP.
To clear the effect of ECP on the mechanical properties, the change of the tensile strength (Δσ) and the elongation-to-failure (Δδ) for the samples with different angles between CD and RD is calculated as following:
 $$\eqalign{ & \Delta \sigma = {{{\sigma _{{\rm{ECP}}}} - {\sigma _{{\rm{CR}}}}} \over {{\sigma _{{\rm{CR}}}}}} \times 100\% \quad , \cr & \Delta \delta = {{{\delta _{{\rm{ECP}}}} - {\delta _{{\rm{CR}}}}} \over {{\delta _{{\rm{CR}}}}}} \times 100\% \quad , \cr}$$
where σECP and δECP are the tensile strength and the elongation-to-failure of the ECP treated samples, respectively; σCR and δCR are the original mechanical properties for the CR samples, respectively. According to Eq. (1), the ultimate tensile strength of the ECPed samples decreased about 9, 13, 13, 11, 13, 12, and 9%, while the elongation-to-failure increased approximately 87, 83, 116, 76, 91, 79, and 93%, respectively for the samples treated before and after ECP treatment with different angles from 0° to 90°.
As an important parameter to evaluate the material anisotropic properties, the ratio between the ultimate tensile strength σ0 for samples with CD//RD (or the elongation-to-failure, δ0) and that of the σ(δ) for samples with 15°, 30°, 45°, 60°, 75°, and 90°. From Table I, the original ratio (σ0/σangle, the subscript “angle” represents 15°, 30°, 45°, 60°, 75°, and 90°) is 1.02, 1.03, 1.08, 1.05, 1.00, and 1.00, respectively, for the original CR samples. While treated after ECP, the ratio (σ0ECP/σangleECP, the subscript “angle” represents 15°, 30°, 45°, 60°, 75°, and 90°) becomes 1.06, 1.07, 1.10, 1.07, 1.04, and 1.02, respectively, for the samples with different angles between CD and RD. To clarify the change of the anisotropic properties, the ratio change can be calculated as  ${{\left| {\left( {{{{\sigma _{0{\rm{ECP}}}}} \mathord{\left{\vphantom {{{\sigma _{0{\rm{ECP}}}}} {{\sigma _{90{\rm{ECP}}}}}}} \right\kern-\nulldelimiterspace}/ {{\sigma _{90{\rm{ECP}}}}}}} \right) - \left( {{{{\sigma _0}} \mathord{\left{\vphantom {{{\sigma _0}} {{\sigma _{90}}}}} \right\kern-\nulldelimiterspace}/ {{\sigma _{90}}}}} \right)} \right|} \mathord{\left{\vphantom {{\left| {\left( {{{{\sigma _{0{\rm{ECP}}}}} \mathord{\left{\vphantom {{{\sigma _{0{\rm{ECP}}}}} {{\sigma _{90{\rm{ECP}}}}}}} \right\kern-\nulldelimiterspace} {{\sigma _{90{\rm{ECP}}}}}}} \right) - \left( {{{{\sigma _0}} \mathord{\left{\vphantom {{{\sigma _0}} {{\sigma _{90}}}}} \right\kern-\nulldelimiterspace} {{\sigma _{90}}}}} \right)} \right|} {\left( {{{{\sigma _0}} \mathord{\left{\vphantom {{{\sigma _0}} {{\sigma _{90}}}}} \right\kern-\nulldelimiterspace} {{\sigma _{90}}}}} \right) = 2\% }}} \right\kern-\nulldelimiterspace} {\left( {{{{\sigma _0}} \mathord{\left{\vphantom {{{\sigma _0}} {{\sigma _{90}}}}} \right\kern-\nulldelimiterspace}/ {{\sigma _{90}}}}} \right) = 2\% }}$ (as listed in Table I), here just as an example for the ratio between the CD//RD and that of the CD⊥RD, which means that due to the application of ECP, the anisotropic becomes stronger.
The ratio between the ultimate tensile strength σ0 for samples with CD//RD and that of the σ for samples with 15°, 30°, 45°, 60°, 75°, and 90°.

σ0 = 443 MPa, σ15 = 435 MPa, σ30 = 426 MPa, σ45 = 410 MPa, σ60 = 420 MPa, σ75 = 443 MPa, σ90 = 443 MPa.
σ0ECP = 400 MPa, σ15ECP = 377 MPa, σ30ECP = 373 MPa, σ45ECP = 365 MPa, σ60ECP = 373 MPa, σ75ECP = 385 MPa, σ90ECP = 393 MPa.
IV. DISCUSSION
Phase transformations are determined by thermodynamics, namely whether the transformation can occur. In terms of the thermodyamics that limits phase stability, the minimum Gibbs free energy specifies which phase is stable under particular conditions. Since the application of ECP would input a high-energy into the materials, the ECP may modify the free energy of the system during current passing. The following is mainly to explain the effect of electric current on the thermodynamics of the phase transformation.
During the current passing, the course of temperature rise can be regarded as an adiabatic course due to a very short time, and the temperature rise can be obtained as following,Reference Conrad, Sprecher and Nabarro12
 $$\Delta T = {\left( {{C_{\rm{p}}}d} \right)^{-1}}\rho \int_0^\infty {{j^2}\left( t \right){\rm{d}}t\quad ,}$$
where C p = 378 J·kg−1·K−1 is the specific heat, the resistivity ρ = 0.062 × 10⁻⁶ Ω·m, the density of the specimen d = 8.40 g·cm−3, and j(t) is the current density at time t,  $\mathop \smallint \int_0^\infty {j^2}\left( t \right){\rm{d}}t = 4.1 \times {10^{16}}{\left( {{\rm{A}} \cdot {{\rm{m}}^{ - 2}}} \right)^2}\,{\rm{s}}$. Substituted the above values into Eq. (2), the temperature increment can be calculated as 664 K at room temperature 293 K. Obviously, the temperature of the electric-current-pulsed samples (957 K) is higher than that of the phase transformation temperature (953 K). In this work, there is no additional heating to the samples, and the temperature rise due to Joule heating is used to provide the temperature required by phase transformations. Combined with the EDS analysis, it is sure that a diffusive phase transformation is carried out during current passing.
During a diffusive phase transformation in a current system, a flux of atoms will be driven by a concentration gradient, and electric current and a temperature gradient. Because grain boundaries are the preferred nucleation sites during current passing, when there is an angle between the CD and RD, the different effects of the grain boundary resistivity should be considered. As proposed by Dolinsky and Elperin,Reference Dolinsky and Elperin13 the application of ECP was favor to the nucleation of product phase with higher conductivity during phase transformation. Therefore, during the current passing, the local temperature around the grain boundaries due to Joule heating will be different than that in the intergrain. As a result, an atom flow resulting from a temperature gradient (thermotransport) could occur. However, the thermotransport is generally a second-order effect compared with electromigration.Reference Hummel14 Furthermore, any temperature difference between the phases will disappear in a very short time during current passing, as that shown in Fig. 1. Therefore, the phenomenon in this work is unlikely to be explained in terms of a temperature gradient caused by the different grain boundary resistivity.
On the other hand, according to the equilibrium phase diagram, the Cu and Zn atoms will diffuse in opposite directions driven by the concentration gradient. Due to the application of ECP, the diffusion of the Cu and Zn atoms is also subjected to an electromigration wind force which may drive them along the electron flow direction. The atomic flux  $\phi$ in grain boundaries is commonly expressed by the Nernst–Einstein equationReference Hummel14
 $$\phi = {{NF} \over {kT}}D = {{NF} \over {kT}}{D_0}\exp \left( { - {Q \over {kT}}} \right)\quad ,$$
where N is the number of atoms per unit volume at the grain boundary, D is the grain boundary diffusion coefficient, D 0 is the pre-exponential diffusion constant, Q is the activation energy, k is the Boltzmann constant, T is the absolute temperature, and F is the electromigration induced force on the metal ions. The force is given byReference Conrad, Sprecher and Nabarro12
 $$F = \left( {{Z^*}e} \right)\rho j\quad ,$$
where Z* is the effective charge of the metal ions, and e is the electron charge.
Eq. (3) is only valid if the grain boundaries are parallel to the length of the CD, i.e., in the direction of the applied force. In all other cases, where the grain boundaries are inclined to the direction of the applied current by an angle θ, the atomic flux Eq. (3) has to be modified to readReference Hummel14
 $$\phi = {{NFD} \over {kT}}\cos \theta \quad .$$
For perpendicular grain boundaries, the angle θ is 90° which results in no electromigration induced atomic flux via grain boundaries.
If just considering the effect of the angle between the grain boundaries (parallel to the RD) and the direction of applied current, the greatest one of the atomic flux  $\phi$ in grain boundaries should be in the samples with 0°. In fact, the greatest one is in the samples with 15°. Therefore, the average atom drift velocity V ie resulting from an electric current should be deeply investigated, which can be calculated as that givenReference Blech15–Reference Ho and Kwok17
 $$\eqalignb{ & {V_{{\rm{ie}}}} = {\phi \over {{c_{\rm{i}}}}}\quad , \cr & \,\,\,\,\,\,\, = {{{D_0}} \over {kT}}e{Z^*}j\rho \exp \left( {{{ - {Q_{\rm{i}}}} \over {kT}}} \right)\quad . \cr}$$
c i is the atomic density. For the investigated alloy, Cu is the solvent and Zn the solute, with the drift velocity of Zn atoms being higher than that of Cu atoms. Therefore, an estimate of the drift velocity is based on the behavior of the Zn atoms. According to Eq. (6) with the values D 0 = 0.34 cm2·s−1, Q i = 1.98 eV,Reference Brandes18Z* = −23.3 and j = j m = 17.6 kA·mm−2, V ie is of the order of 10−2 μm·s−1, which is too low to bring so rapid and apparent atoms diffusion in the samples with different angles during current passing, as that shown in Fig. 1.
From Fig. 1, it can be found that due to the different angle between CD and RD, the new formed refined β phase will show a different arrangement. For the 0°, 45°, 90° ECPed samples, just a shape change of the β phase can be observed, while for samples with the angles of 15°, 30°, 60°, 75°, lots of refined β phase can be distinguished. For samples with the angles of 15°, 30°, 60°, 75°, the average diffusion distance of Zn atoms during ECP remaining time of 800 μs can be evaluated as half of the average distance of 12 μm between those original β phases in Fig. 1. Some atoms almost displace to 20 μm. With the diffusion distance, the average atomic drift velocity of Zn gets to 12 μm/800 μs ≈ 104 μm·s−1.
According to classical electromigration theory, the diffusion coefficient cannot be changed by an electric current, which can be inferred from the definition of D i in Eq. (6); D i is the diffusion coefficient in a current-free system. However, an unchanged diffusion coefficient cannot explain the phenomenon shown in Fig. 1. Therefore, it is reasonable to say that the main reason for the different atom drift arises from a different diffusion coefficient that is dramatically enhanced by the ECP waveform. From the relationship between pre-exponential factor D 0 and the activation energy Q given by Zener and Wert,Reference Wert and Zener19 if only integrating the positive current density over ECP remaining time, the activation energy Q could be approximately evaluated as 0.91 eV for the case of V ie ≈ 104 μm·s−1, which is much lower than the value of 1.98 eV. In fact, we have already proposed that the application ECP could reduce dramatically the diffusion activation energy of lead in brass and accelerating the lead diffusion in brass. Therefore, we can conclude that the precipitation of new refined β phase from the internal grains or at grain boundaries may be produced by changing the exerted CD to increase the Zn diffusion in copper.
However, it should be mentioned that the different atomic drift velocity is observed due to the different angle between CD and RD. A saddle point of both the mechanical properties and the microstructure change all appears in 45° samples. When the angle is 0°, 45°, 90°, almost no refined β phase can be observed, while the angle is 15°, 30°, 60°, 75°, lots of refined β phases are detected. This phenomenon should be ascribed to the high symmetrical characteristic of the copper (f.c.c.) or brass (b.c.c.).
To clarify the possible reason that there is a saddle point in samples with angle 45°, the orientation relationship between the CD and the RD is considered. Due to the samples rolled before ECP, an obvious {011} $\left\langle {211} \right\rangle$ texture component can be detected for the α phase, as shown in Fig. 4(a). Figure 4(b) schematically illustrates the orientation relationship between
 $\left\langle {001} \right\rangle$ and
 $\left\langle {110} \right\rangle$ if only considering the orientation relationship of the {011} crystal planes. Assuming the RD parallel to
 $\left\langle {01 - 1} \right\rangle$ direction, when CD//RD, the CD is parallel to
 $\left\langle {01 - 1} \right\rangle$, while CD⊥RD, the CD is parallel to
 $\left\langle { - 100} \right\rangle$, and when there is a 45° angle, the CD is also parallel to
 $\left\langle { - 110} \right\rangle$. Obviously, it is reasonable that a similar phenomenon is investigated for samples from 0° to 45°, as that from 45° to 90°. However, when there is an angle deviated from the
 $\left\langle {100} \right\rangle$ or
 $\left\langle {110} \right\rangle$ direction, the angle between
 $\left\langle { - 11 - 1} \right\rangle$ and
 $\left\langle {01 - 1} \right\rangle$ is about 35°, which is close to the samples angle with 15°, 30° between CD and RD, therefore, the orientation is more close to
 $\left\langle {111} \right\rangle$ direction. From Ref. Reference Wang, Dai, Wang, Tian and Zhao11, it is known that there is K-S relationship with {111}α//{110}β. The orientations of the β phase nucleate from either the α grain boundaries or the α grain interiors during the enhanced phase transformation by ECP treatment are all best described by the orientation relation 44.3°
 $\left\langle {114} \right\rangle$, near to the K-S relationship, which greatly explains the enhanced phase transformation nucleation rate for the samples when there is an angle between CD and RD.
(a) φ2 = 0° section of the orientation density function (levels: 1; 2; 3;…) for the samples treated before ECP, (b) schematic illustration of  $\left\langle {110} \right\rangle$ and
 $\left\langle {100} \right\rangle$ directions of {011}
 $\left\langle {211} \right\rangle$ oriented grains.
V. CONCLUSION
(1) The CD plays a great role on enhancing the phase transformation nucleation rate. Not only the microstructural evolution but also the corresponding mechanical properties all have a saddle point in samples with angle 45°. Meanwhile, the reduced diffusion activation energy Q i and the existed crystallographic orientation caused by the precold rolling are the main reason that gives rise to the different enhanced phase transformation nucleation rate when there is an angle between CD and RD during current passing.
(2) The influence of CD on microstructural evolution and mechanical properties during the phase transformation induced by ECP is close to the higher symmetrical characteristic for the cubic crystal.
(3) Analyzed from the mechanical properties, it can be found that the anisotropic of the materials becomes stronger due to the application of ECP. An important finding is that by changing the angles between the CD and the RD, a new and effective approach to control the phase transformation process can be provided.
ACKNOWLEDGMENTS
This work was supported by the 111 Project of China (Grant No. B07015), and the National Nature Science Foundation of China, Grant No. 51471047, the Fundamental Research Funds for the Central Universities No. N130418001. The authors thank Professor J.D. Guo of Institute of Metal Research, Chinese Academy of Sciences, for many helpful discussions.