Introduction
Taenia solium is a taeniid cestode parasite that causes taeniosis in humans and cysticercosis in humans and pigs. When T. solium metacestodes infect the human central nervous system, the resultant disease is called neurocysticercosis. Neurological signs and symptoms such as cephalea and seizures appear and progress as a result of increased intracranial pressure, which is frequently associated with an intense inflammatory reaction surrounding the parasite (Escobar, Reference Escobar, Palacios, Rodriguez and Taveras1983).
Immune suppression may result while the parasite remains alive inside the host. One of the first indications of immune suppression is the absence, or reduction, of inflammatory reactions surrounding the parasite in human cysticercosis (Sanz, Reference Sanz1987) and around T. solium metacestodes implanted subcutaneously in mice (Tato et al., Reference Tato, Castro, Rodríguez, Soto, Arechavaleta and Molinari1995, Reference Tato, White, Willms, Rodríguez, Solano, Sepulveda and Molinari1996; Molinari et al., Reference Molinari, Tato, Rodriguez, Solano, Rubio and Sepulveda1998). Another sign of immune suppression is ex vivo non-specifically depressed proliferation of spleen lymphocytes (which can be triggered with Concanavalin A (Con-A) stimulation) from peripheral blood lymphocytes in naturally cysticercotic pigs (Molinari et al., Reference Molinari, Soto, Tato, Rodriguez, Retana, Sepulveda and Palet1993).
Moreover, decreased proliferation of splenic lymphocytes from mice infected with Taenia crassiceps and peripheral lymphocytes from cysticercotic humans stimulated with Con-A or cysticercal antigens have been reported (Sciutto et al., Reference Sciutto, Fragoso, Baca, De la Cruz, Lemus and Lamoyi1995; Bueno et al., Reference Bueno, Vaz, Machado, Livramento, Avila and Ferreira2001). Little information about the parasitic molecules involved in the induction of immune suppressive effects is available. However, a low-molecular-weight ( < 3500 Da) substance secreted by the T. solium metacestode (metacestode factor, MF) has been reported to depress [3H]thymidine uptake by peripheral human lymphocytes stimulated with phytohaemagglutinin (Molinari et al., Reference Molinari, Tato, Reynoso and Cázares1990). This substance also decreases the production of interleukin (IL)-2, interferon (IFN)-γ and IL-4 in healthy mouse spleen lymphocytes stimulated with Con-A, and that of tumour necrosis factor-α (TNF-α) by mouse peritoneal macrophages stimulated with lipopolysaccharide in vitro (Arechavaleta et al., Reference Arechavaleta, Molinari and Tato1998). Other studies have reported that T. crassiceps metacestode excretion/secretion products suppress T-cell proliferative responses in vitro and IFN-γ and IL-4 production in the early stages of infection (Spolski et al., Reference Spolski, Corson, Thomas and Kuhn2000). Recently, the T. crassiceps MF was reported to induce structural damage in somatic and germinative cells of male mouse testes and to significantly increase atresia of primary and secondary ovary follicles in female mice (Zepeda et al., Reference Zepeda, Copitin, Solano, Fernández, Tato and Molinari2011b; Solano et al., 2015).
Experimental studies of cysticercosis have largely focused on its relation to the host immunoregulation response (Gómez-García et al., Reference Gómez-García, Rivera-Montoya, Rodríguez-Sosa and Terrazas2006; Peón et al., Reference Peón, Espinosa-Jiménez and Terrazas2013). In contrast, little is known about the participation of substances secreted by the parasite in host–parasite interactions.
Numerous studies have demonstrated that transforming growth factor (TGF)-β has an inhibitory effect on the growth of various lymphoid cells, including T and B cells (Kehri, Reference Kehri, Wakefield, Roberts, Jakowlew, Alvarez-Mon, Derynck, Sporn and Fauci1986, Reference Kehri, Thevenin, Rieckmann and Fauci1991). TGF-β also suppresses the generation of cytotoxic T cells (Fontana et al., Reference Fontana, Frei, Bodmer, Hofer, Schreier, Palladino and Zinkernagel1989) and IL-2-dependent T-cell proliferation (Kehri et al., 1986). Chen et al. (Reference Chen, Jin, Hardegen, Leim, Li, Marinos, McGrady and Wahl2003) provided evidence that TGF-β1 is a critical factor in the development of peripheral T regulatory cells (Tregs) and demonstrated that TGF-β switches CD4+ CD25+ naïve cells toward a suppressor T-cell phenotype similar to that of Tregs. Therefore, the aim of this study was to determine the pathogenic effects of the T. crassiceps MF on the histoarchitecture of the mouse spleen and its repercussions on host immune responses, such as the expression of TGF-β and the Foxp3 factor by splenic cells, that may contribute to immune suppression in experimental cysticercosis.
Materials and methods
Experimental infections and treatment
Balb/c female mice (28 days old; 20–22 g) were maintained under standard animal housing conditions with access to Purina chow and water ad libitum. Taenia crassiceps cysticerci (WFU strain) were maintained in our laboratory via peritoneal passage in female mice, as previously described (Everhart et al., 2004).
Peritoneal fluids from healthy female control and T. crassiceps metacestode-infected mice were obtained following a previously described method (Zepeda et al., Reference Zepeda, Copitin, Solano, González, Fernández, Tato and Molinari2011a). Briefly, after 9 days of infection with up to 40 T. crassiceps metacestodes, the peritoneal cavity of each mouse was washed with 8 ml 50 mm sterile phosphate-buffered saline (PBS) through a small laparotomy. Peritoneal fluids were centrifuged at 4000 rpm at 4°C for 10 min, and the supernatants from each group were pooled, filtered through Millipore membranes (0.22-nm pores), lyophilized and stored at 4°C until use.
Batches of 45 mg (dry weight) of each peritoneal fluid were diluted in PBS buffer (15 ml, adjusted to 2.0 optical density units at a wavelength of 280 nm) and loaded on to a Sephadex G-50 G column (1.5 × 90 cm). The material was eluted with PBS buffer and collected in 4.0-ml fractions. Fractions containing MF were pooled, as were the corresponding fractions from the control peritoneal fluids (CPF). The pooled fractions were lyophilized and stored at 4°C until use. The carbohydrate and protein concentrations of both the CPF and MF fractions were determined following the anthrone and Bradford methods, respectively (Ashwell, Reference Ashwell, Colowick and Kaplan1957; Bradford, Reference Bradford1976).
To determine the effects of infection with T. crassiceps metacestodes and MF treatment on the spleen cells in vivo, 15 female mice were divided into three groups. Each animal was inoculated with its respective treatment every 4 days for 45 days. The control group (n= 5) and MF group (n= 5) were inoculated subcutaneously with 0.1 ml CPF or MF, respectively, containing 50 μg carbohydrate that had previously been filtered through a 0.22-μm Millipore membrane. The infected group (n= 5) was infected intraperitoneally (ip) with up to 40 T. crassiceps metacestodes, measuring 2–3 mm in diameter, suspended in 0.2 ml PBS. At 45 days post-treatment and infection, all mice were euthanized, and their spleens were carefully removed. Each spleen was sectioned in three different parts: the central (equatorial) section of each spleen was used to obtain cells for flow cytometry analyses, and the other sections (i.e. the polar extremities) were fixed with 2.5% paraformaldehyde in PBS for 12 h at room temperature. The polar extremities were dehydrated using a graded series of ethanol concentrations (70–100%) and then stored until further use. One polar extremity was embedded in paraffin, and 5-μm sections were prepared on a rotary microtome, subjected to haematoxylin/eosin (H/E) staining, and analysed under an IX71 Olympus light microscope (NY Microscope Co., New York, USA). Other sections were prepared for terminal deoxynucleotidyl transferase (TdT)-mediated dUTP nick-end labelling (TUNEL), and the other polar extremities were prepared for transmission electron microscopy analysis.
TUNEL assays, flow cytometry analysis and electron microscopy
The presence of DNA strand breaks in the paraffin-embedded mouse spleen cross-sections was evaluated with a TUNEL assay using an in situ Cell Death Detection Kit (Roche, Salt Lake City, Utah, USA). Images of the stained sections were acquired under a FV 1000 Olympus inverted confocal microscope.
Isolated spleen cells were stained with phycoerythrin (PE) rat anti-mouse CD4 (CD4-PE), anti-mouse CD8-PE or anti-mouse CD19-PE, according to the manufacturer's instructions (Becton Dickinson Pharmingen, San Jose, California, USA). The cells (5 × 10⁵ cells/0.5 ml) were analysed on a FACSCalibur (Becton Dickinson) using Cellquest software (Becton Dickinson). For each plot, 10,000 cells were acquired.
The spleen was postfixed in 1% buffered osmium tetroxide (1.5 h, 4°C). The samples were transferred into 70% acetone solution, treated with 1% phosphotungstic acid and 1% uranyl acetate (20°C, 1 h), and subsequently dehydrated in acetone and embedded in Epon. Ultrathin sections were mounted on copper grids, contrasted with uranyl acetate and lead citrate, and viewed using a Jeol 100 S electron microscope (Akishima, Tokyo, Japan). Micrographs were obtained with a digital camera (Orius Sc1000A1; Gatan, Pittsburgh, Pennsylvania, USA).
Gene expression
To determine whether infection with T. crassiceps metacestodes or subcutaneous inoculation of the mice with MF induced TGF-β and Foxp3 mRNA gene expression in spleen cells, three groups of mice (n= 5 per group) were used as described above (see Experimental infections and treatment). At 45 days post-treatment and infection, all mice were euthanized; their spleens were carefully removed, and total RNA was obtained from the spleen cells according to a previously published method (Shabaana et al., Reference Shabaana, Venkatasubramani, Narayan, Hoessli and Dharmanlingam2001). Total RNA was reverse transcribed with 200 U/ml of RevertAid minus Reverse Transcriptase and 1 μg/ml of oligo (dT) in first-strand buffer (Fermentas, Maryland, USA) by heating (42°C, 60 min). MyTaq HS Red DNA polymerase (5 U/ml; Bioline. London, UK) and 10 μm each of sense and antisense oligonucleotides were added to 5 μl cDNA. The forward and reverse primers employed (FP and RP, respectively) were as follows: TGF-β1 FP: TTGCTTCAGCTCCACAGAGA, RP: TACTGTGTGTCCAGGCTCCA; and FOXP3 FP: TCCTTCCCAGAGTTCTTCCA, RP: CGAACATGCGAGTAAACCAA (Yang et al., Reference Yang, Yang and Mine2010). After heating (95°C, 15 min), the reaction mixture was cycled 40 times as follows: 15 s at 95°C, 15 s at 58°C and 30 s at 72°C, and a final extension at 72°C for 10 min in a DNA thermal cycler (BIO-RAD, California, USA). A negative control group (healthy mice) was included for each cycle. The housekeeping gene β-actin was selected as the internal control (Sun et al., Reference Sun, Li, Luo and Liao2012). TGF-β and Foxp3 expression were determined by densitometry.
Data analysis
Apoptotic cells in ten microscopic fields of white pulp from each spleen of all groups were counted to calculate the mean ± SD and the P value in H/E-stained spleen sections. TUNEL-stained spleen sections (two sections of each spleen for all groups) were analysed under a confocal FV 1000 Olympus inverted microscope. The images were analysed off-line with ImagePro v. 6.2 (Media Cybernetics Silver Spring, Maryland, USA) to measure the mean ± SD and the P values of the TUNEL fluorescent nuclei (DNA) over areas of 0.3–6 μm2. The percentages of CD4+, CD8+ and CD19+ cells determined from the FL1/FL2 flow cytometry plots were considered for statistical analyses. All data, including those from densitometry, were processed to determine the mean ± SD and P values using GraphPad InStat software (La Jolla, California, USA). P values below 0.05 were considered statistically significant.
Results
Histopathology
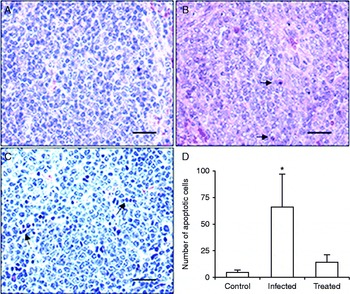
The white pulp histoarchitecture of the spleen sections from control mice treated with CPF was intact (fig. 1A). In contrast, the spleen sections from mice infected with T. crassiceps metacestodes and stained with H/E exhibited severe disruptions of both white and red pulp tissues: the histoarchitecture of the white pulp was disorganized, and many cells had lost their intercellular cement and exhibited severe intracellular alterations such as pyknosis and fragmented nuclei (fig. 1B). The spleens from the T. crassiceps MF-treated mice also exhibited disorganization of the white pulp, although the extent of this disorganization was less than that of the white pulp of T. crassiceps-infected mice. Many cells exhibited fragmented and peripheral chromatin. In each field, some lymphocytes exhibited pyknotic and fragmented nuclei (fig. 1C). The number of apoptotic cells in the white pulp of T. crassiceps-infected mice was significantly higher than that of control mice (fig. 1D).
Histoarchitecture of white pulp from the spleen of (A) control mice with intact splenic cells, (B) Taenia crassiceps-infected mice and (C) MF-treated mice, showing disrupted histoarchitecture and apoptotic cells (arrows). (D) The mean ± SD of the number of apoptotic cells. *P< 0.05. Scale bar = 2.5 μm; 20 × magnification.

TUNEL assay
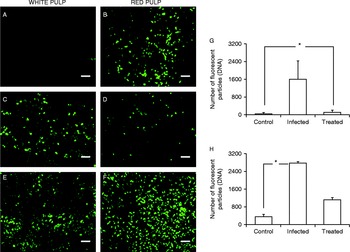
To assess DNA damage in the splenic cells from mice infected with T. crassiceps metacestodes or inoculated with T. crassiceps MF, confocal microscopy analyses were performed. TUNEL-stained spleen sections from the white pulp of control mice did not exhibit positive fluorescence (fig. 2A). However, numerous TUNEL-positive fluorescent cells were observed in the red pulp (fig. 2B). In contrast, spleen sections from mice infected with T. crassiceps metacestodes or inoculated with T. crassiceps MF contained TUNEL-positive fluorescent cells in both the white and red pulps, with T. crassiceps-infected mice showing a significantly greater number of fluorescent cells in the white pulp than MF-treated mice (P< 0.05) (fig. 2C, E). The red pulp from the control mice exhibited damaged nuclei (fig. 2B), but this damage was much less severe than that observed in the red pulp from the infected and MF-treated mice (fig. 2D, F). The rate of apoptosis in the white pulp cells from mice infected with T. crassiceps metacestodes was significantly (P< 0.05) greater than that of the white pulp cells of MF-treated mice (fig. 2G). Furthermore, the rate of apoptosis among the red pulp cells in the infected mice was significantly (P< 0.05) greater than that of the control mice. The difference in apoptosis among red pulp cells of MF-treated mice and those of control mice was not significant (fig. 2H).
Confocal analyses of TUNEL-stained spleen sections to show (A) white pulp without apoptosis and (B) red pulp with fluorescent nuclei (TUNEL positive) in control mice; (C) white pulp and (D) red pulp with abundant fluorescent nuclei in Taenia crassiceps-infected mice; and (E) white pulp and (F) red pulp of MF-treated mice, both with abundant fluorescent nuclei. The means ± SDs of the numbers of fluorescent nuclei (DNA) in (G) the white pulp and (H) the red pulp of the control, T. crassiceps-infected and MF-treated mice are shown. *P< 0.05. Scale bar = 25 μm; 40 × magnification.

Flow cytometry and electron microscopy
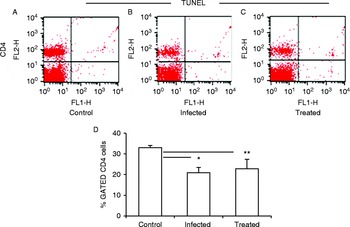
Flow cytometry analyses revealed a significant (P< 0.05) decrease in CD4+ cells in the spleens of T. crassiceps-infected mice and MF-treated mice compared with control mice (fig. 3A–D). The proportions of CD8+ and CD19+ cells from infected and MF-treated mice were similar to those from control mice (data not shown). No TUNEL-stained CD4+ (fig. 3), CD8+ or CD19+ cells (data not shown) were found in the spleens of any group.
Flow cytometry fluorescence plots (FL1/FL2) to show splenic CD4+ from (A) control mice, (B) Taenia crassiceps-infected mice and (C) MF-treated mice. (D) Bar plot indicating the number of CD4+ cells (mean ± SD). * and **P< 0.05 between control and infected/treated mice.

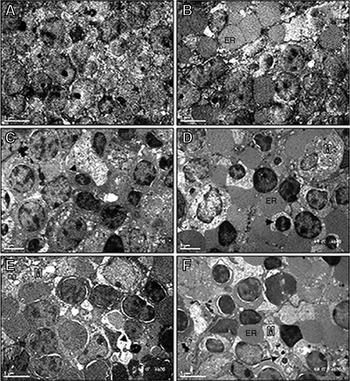
Transmission electron microscopy micrographs revealed that the histoarchitecture of the control mice (white and red pulp) was well preserved (fig. 4A, B). In contrast, several cellular abnormalities were observed in both the white and red pulp of the spleens of mice infected with T. crassiceps metacestodes. Compacted, segmented and peripheral chromatin was observed in numerous pyknotic lymphocytes. Several macrophages were scattered among the lymphocytes, and numerous cytoplasmic spherical particles were observed in these macrophages. The forms, sizes and densities of these particles suggested that they were likely particulate chromatin from apoptotic cells (fig. 4C, D). The white and red pulp of the mice inoculated with MF exhibited the same histopathological characteristics as the infected mice, albeit to a lesser degree (fig. 4E, F).
Transmission electron microscopy micrographs to show intact histoarchitecture of (A) white pulp and (B) red pulp of control mice; changes in chromatin as pyknosis (arrowheads) in (C) the white pulp and (D) the red pulp of infected mice; and (E) pyknosis of nuclei in white pulp and (F) apoptotic bodies in the red pulp of MF-treated mice. M, Macrophages with dense spherical particles (arrows); ER, erythrocytes. Scale bars = 5 μm.

Gene expression
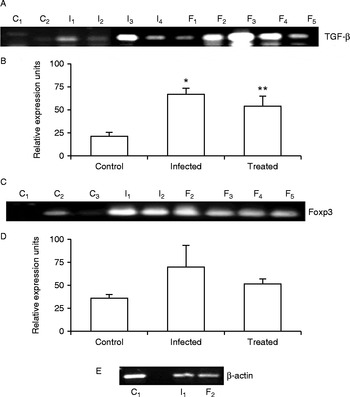
Compared to the control mice (mean ± SD = 21 ± 3.8; fig. 5A, B), the expression of TGF-β was significantly increased in T. crassiceps-infected mice (mean ± SD = 66.55 ± 7.35, P= 0.0021) and MF-treated mice (mean ± SD = 53.58 ± 11.88, P= 0.0054). Foxp3 expression was significantly increased (P< 0.05) in the MF-treated mice compared with the basal expression of control mice, and was higher in the infected mice than in control mice (fig. 5C, D).
TGF-β and Foxp3 expression in spleen cells from control, Taenia crassiceps-infected and MF-treated mice. (A) TGF-β expression and (B) relative cytokine expression (mean ± SD). *P< 0.05 between T. crassiceps-infected and control mice; **P< 0.05 between treated and control mice. (C) Foxp3 expression and (D) relative expression units. (E) Representative expression of β-actin used as an internal control.

Discussion
A combination of data allowed us to observe severe spleen histopathology in mice infected with T. crassiceps metacestodes and in mice inoculated with a low-molecular-weight substance secreted by T. crassiceps metacestodes (MF). This pathology may lead to immunosuppression, a hypothesis supported by the significant decrease of CD4+ lymphocytes in the spleens of both groups of experimental mice compared with control mice. The decrease in CD4+ cells may be related to the inhibition of IL-2, IFN-γ and other cytokines reported by Arechavaleta et al. (Reference Arechavaleta, Molinari and Tato1998) and Spolski et al. (Reference Spolski, Corson, Thomas and Kuhn2000). Apoptosis of splenic cells was observed exclusively in the red pulp of the control mice. In contrast, we observed intense apoptosis in the white pulp of mice infected with T. crassiceps metacestodes and increased apoptosis in the red pulp. Apoptosis was observed in the white pulp of mice inoculated with T. crassiceps MF to a lesser extent than that observed in the white pulp of infected mice. These findings suggest an apoptogenic role for the T. crassiceps MF, which may act in combination with other unknown parasite substances to induce the apoptosis of splenic cells. A significantly lower number of spleen CD4+ lymphocytes than in control mice were also observed after MF treatment. Further studies are necessary to elucidate whether other spleen cells are affected by the parasitic infection. The decrease in CD4+ lymphocytes may be related to humoral immunosuppression, which has been reported in mice that are parasitized with T. crassiceps and immunized with Salmonella typhimurium antigens then challenged with virulent S. typhimurium bacilli (Rubio et al., Reference Rubio, Tato, Govezensky and Molinari1998), and in mice with parasitaemia and larger cutaneous lesions due to previous infection with T. crassiceps and co-infection with Leishmania major and Leishmania mexicana (Rodriguez-Sosa et al., Reference Rodríguez-Sosa, Rivera-Montoya, Espinosa, Romero-Grijalva, López-Flores, González and Terrazas2006). Other similar observations include the suppression of T-cell proliferative responses in vitro and the suppression of IFN-γ and IL-4 production by T. crassiceps metacestode excretion products (Spolski et al., Reference Spolski, Corson, Thomas and Kuhn2000). Infection of mice with T. crassiceps metacestodes and inoculation with T. crassiceps MF significantly upregulated TGF-β and Foxp3 gene expression over the basal expression in control mice. These findings suggest that splenic CD4+CD25 − cells were likely converted into CD4+CD25+ regulatory cells by TGF-β in a process that involves induction of the transcription factor Foxp3. It has been reported that the conversion of peripheral CD4+CD25 − naïve cells to CD4+CD25+ regulatory cells is mediated by the induction of transcription factor Foxp3 by TGF-β (Chen et al., Reference Chen, Jin, Hardegen, Leim, Li, Marinos, McGrady and Wahl2003). TGF-β has been shown to be an important immunosuppressive cytokine that not only directly suppresses effector T-cell function but also induces CD4+CD25+ Tregs (Bettelli et al., Reference Bettelli, Carrier, Gao, Korn, Strom, Oukka, Weiner and Kuchroo2006). In Heligmosomoides polygyrus infections in mice, an elevated frequency of CD4+T cells bearing surface TGF-β was found. CD4+CD25+ cell numbers increased during infection, with parallel growth of both CD25+Foxp3+ and CD25+Foxp3 − subsets (Finney et al., Reference Finney, Taylor, Wilson and Maizels2007).
The results presented herein provide the first evidence that a T. crassiceps-secreted substance is closely linked to the TGF-β and Foxp3 gene expression. In vitro, Foxp3 expression has been induced by secreted products of H. polygyrus and Teladosargia circumcincta through the TGF-β pathway (Grainger et al., Reference Grainger, Smith, Hewitson, McSorley, Harcus, Filbey, Finney, Greenwood, Knox, Wilson, Belkaid, Rudensky and Maizels2010).
Preliminary analysis of the molecular structure of T. crassiceps MF has revealed that this substance has an apparent mass of 1350 Da, an absorbance of 258 nm, and contains carbohydrates but not proteins (Zepeda et al., Reference Zepeda, Copitin, Solano, Fernández, Tato and Molinari2011b). Studies to elucidate the structure of MF are currently under way. Additionally, biological assays to elucidate the mechanisms by which MF affects different cellular lineages in vivo are required.
In addition to the histopathological changes in the murine spleen that were observed here, we have previously reported that the T. crassiceps MF leads to the disruption and apoptosis of seminiferous epithelium cells in male mice (Zepeda et al., Reference Zepeda, Copitin, Solano, Fernández, Tato and Molinari2011b), which are similar to those induced by a T. crassiceps metacestode infection in male mice (Zepeda et al., Reference Zepeda, Copitin, Solano, González, Fernández, Tato and Molinari2011a), and to a significant increase in follicular atresia and oocyte degeneration in the ovaries of female mice, which are similar to the effects caused by a T. crassiceps metacestode infection in female mice (Solano et al., 2015). Other studies have reported that T. crassiceps infection does not kill the host and can cause chronic infections with minimal damage in mice, inducing an initial Th1 response replaced by Th2 and a change in macrophage phenotype from a CAM population to an AAM population (Peón et al., Reference Peón, Espinosa-Jiménez and Terrazas2013).
In conclusion, the present data suggest that, early in experimental cysticercosis, T. crassiceps uses MF, likely along with other parasitic substances, to induce splenic histopathology, decrease spleen CD4+ lymphocytes, and induce peripheral Foxp3+ regulatory cells via TGF-β production. All these processes may create an anti-inflammatory environment that would favour the development of the parasite. The pathology observed in this mouse–T. crassiceps model suggests that, if an analogous phenomenon occurs in human cysticercosis, possibly mediated by the T. solium MF (Molinari et al., Reference Molinari, Tato, Reynoso and Cázares1990), spleen damage and immunosuppression may follow infection (while the parasite is alive), and the severity of these effects would depend on the parasitic load of each patient.
Acknowledgements
We thank Rodolfo Paredes, Gabriel Orozco and Juan M. Barbosa for performing the electron microscopy and confocal microscopy experiments and creating the figures.
Financial support
This work was supported by the Universidad Nacional Autónoma de México.
Conflict of interest
None.
Ethical standards
All animal studies were performed according to the Guide for the Care and Use of Laboratory Animal of the Secretariat of Agriculture, México, D.F. (SAGARPA NOM-062-ZOO-1999).