I. INTRODUCTION
Reciprocating extrusion (RE) is one of the finest severe plastic deformation (SPD) processes for developing mechanical features and eliminating the pores in the structures of aluminum matrix composites (AMCs). Reference Karamıs, Sarı and Erturun1,Reference Karamıs, Erturun and Sarı2 The researches have focalized on featuring the microstructure and the tribological properties of AMCs via different SPD processes. Reference Shankar, Rao, Lee, Chandrasekar, King and Compton3 The effects of RE processing on the microstructures and mechanical properties of various nonferrous composites have been examined to develop new ways to refine grains of these materials. Reference Zhang, Xu, Guo and Jia4
Metal matrix composites (MMCs) have been widely used in aeronautical aerospace and automotive industries owing to their large elastic modulus, improved strength, low wear rate, easy fabrication, and low cost. Reference Dou, Liu, Liu, Xiong and Xia5,Reference Deaquino-Lara, Soltani, Bahrami, Gutiérrez-Castañeda, García-Sánchez and Hernandez-Rodríguez6 Experimental results indicated considerable improvement in AMC hardness and wear resistance by adding 1.5 wt% graphite content (G) and 10 h of milling, due to homogenous distribution of the reinforcement particles in the Al-based composite. It has been found that abrasion is the dominant wear mechanism in all extruded composites, whilst a combination of adhesion and delamination seems to be the governing mechanism for the aluminum alloy. Reference Deaquino-Lara, Soltani, Bahrami, Gutiérrez-Castañeda, García-Sánchez and Hernandez-Rodríguez6 The paper presents the results obtained from tribological tests of aluminum composite material containing 20% SiC. It has been demonstrated that SiC reinforced composite is characterized by lower wear in comparison to the matrix and that adhesive and abrasive wear were the dominant phenomena during the tests. Reference Walczak, Pieniak, Zwierzchowski, Walczak, Pieniak and Zwierzchowski7 The wear tests demonstrated that AA 6061 composite shows a perfect combining of wear rates and friction coefficient compared to AA 6061 alloy. Reference Mustafa8
Recently, mechanical properties and tribological behavior of nanostructured AA 2024 alloy have been investigated before and after adding B4C particles. The results of wear and mechanical tests indicate that mechanical milling and adding B4C particles increase hardness, strength, and wear resistance of AA 2024 and decrease its ductility significantly. Reference Abdollahi, Alizadeh and Baharvandi9 In another study, results of the friction and wear behaviors of B4C/AA 6061 composite show that the mass loss and friction coefficient increase remarkably. The composite shows the highest wear resistance due to the precipitation of β″ (Mg2–Si) phases in the matrix and the strong interface bonding between B4C particles and the matrix alloy. Reference Dou, Liu, Liu, Xiong and Xia5 The specific wear rate of the aluminum and its composites decrease as the load increases and increases as a function of sliding speed. The average specific wear rates of Al + 17% B4C, Al + 17% SiC/B4C, and Al + 17% SiC composites are obtained about 49, 79, and 160 %, respectively. It should be noted that these values are lower compared to aluminum alloys tested under the same test conditions, respectively. Reference Soy, Demir and Findik10
The results of wear test of Al/Al2O3 composite performed by accumulative roll bonding (ARB) process indicated that the ARB process decreases wear resistance of composite samples compared with as-received aluminum samples. The role of delamination and especially, spalling in decreasing the wear resistance of composite was very important. Reference Jamaati, Naseri and Toroghinejad11 In a study, stir casting process was used to produce Al2O3/SiC particulate reinforced MMCs and it was revealed that weight loss was decreased when hybrid and bimodal particle reinforcement (e.g., SiC particles) was utilized. Since larger SiC particles could carry larger portion of the applied load, wear resistance was improved. On the other hand, larger SiC particles could protect the small alumina particles and they are not gouged out during the wear process. Reference Altinkok, Özsert and Findik12
SiC particles broken in the dead metal zone play the important role in the deformation mechanism of the die-bearing surface. Reference Nair and Karamis13 Tool wear and tool surface quality with two die materials, tungsten carbide and tool steel, were quantified by compacting aluminum and iron alloy powders. Surface roughness of the die replicas on a surface profiler was recorded to quantify the tool surface quality. Reference Thompson, Li, Park, Antonyraj, German and Findik14 With the increase of applied loads and test temperature, the abrasive wear, oxidation wear and adhesive wear are the main modes in the complex wear mechanisms of the composites. Reference Zhu, Jar, Song, Zhao, Li and Xie15 The friction values and the wear rates were increased as the applied load increased. Scanning electron microscopy was used to capture the figures of abrasive particles and wear debris. Reference Ozsarac, Findik and Durman16 The results of hot extruded Al alloy show that the microstructure and mechanical properties can be greatly improved and porosity can be significantly decreased and these factors contribute to great increase in wear resistance of sample. Reference An, Dong and Zhang17
In another paper, wear characteristics of magnesium alloy are investigated, the magnesium matrix composite wear rates are higher than that of the alloy at low speeds and lower when sliding speed further increased. Microstructural characterization results established different dominant mechanisms at different sliding speeds, namely, abrasion, delamination, oxidation, adhesion, and thermal softening and melting. Reference Nguyen, Sim, Gupta and Lim18
The wear tests were conducted at different loads and sliding velocities for extruded AA 6061–SiCp composites at different extrusion ratios. While the extrusion ratio is increased, micro hardness and tensile strength of the composites increased. Moreover, the wear resistance of the hot extruded MMCs was superior for the highest extrusion ratio studied. Reference Ramesh, Keshavamurthy and Naveen19 Cross sections of MMC showed an alignment of the added hard phases and the effect of hard phases on the wear resistance were clarified by the wear tests. Reference Theisen and Karlsohn20
Distinguishable differences were possible in properties of materials when a material was extruded with an equal channel angular extrusion (ECAE) method including indentation behavior and hardness. Reference Yang, Peng and Okazaki21,Reference Yapici, Karaman, Luo, Maier and Chumlyakov22 For instance, ECAE increased the tensile and compressive strength levels 316 L stainless steel owing to refinement of microstructure. Reference Watanabe, Somekawa and Higashi23
The aim of this study is to evaluate the microstructural and mechanical properties of the AA 6061 powder alloys produced by RE technique reinforced by SiC particles. This study also aims to obtain the refined grains in metal matrix Al composites by application of a new severe deformation method. The effects of the process parameters on the grain refining and on tribological properties of the processed composites material have been investigated.
II. EXPERIMENTAL
A. Materials
In the present study, AA 6061 powders (72 µm in size) were mixed with SiC particles (20 µm size) in a volume fraction of 5% for 1 h using a shaker–mixer. The mixed composite powders were cold packed at a pressure of 2 MPa as extrusion billets. These billets were then sintered at 873 K at a pressure of 1 MPa under an argon atmosphere. For comparison, same procedures were conducted on AA 6061 powders without mixing with SiC particles and named as “unreinforced sample” throughout the text.
All the extrusion billets that were prepared using powder metallurgy methods have dimensions of 29.5 mm diameter and 42 mm height. The composition of the materials used in the present work can be found in Table I.
The chemical composition of AA 6061 materials (wt%).

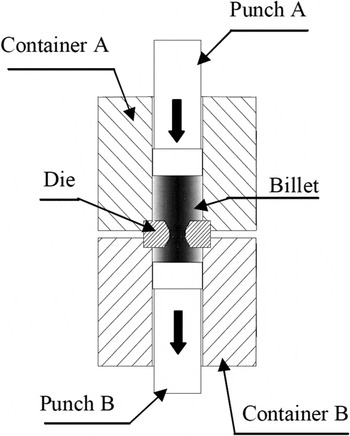
Figure 1 shows the schematic of the RE process. A die, two punches and two containers in a symmetrical design compose the RE system. Extrusion has been carried out repeatedly in the directions of up and down till the desired number of passes is obtained. With the last extrusion, in the meantime, punch B is removed to yield an extruded sample with a 10 mm diameter. The meaning of 0 passes is that the billets are inserted into the container A and then extruded into a sample with a 10 mm diameter.
Schematic representation of RE.

In the present work, the billets have been extruded at 17.5 MPa for 0, 1, 2, 3, 4, and 5 passes at 473 K. The extrusion ratios are 4:1.
B. Wear test
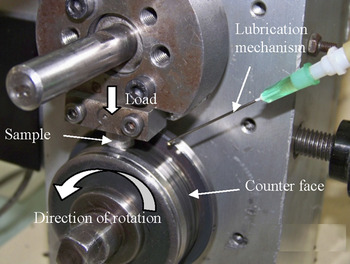
Wear tests have been carried out with the pin-on-ring situation. The tests have been performed at ambient temperature under dry and lubricated forms. The samples with a diameter of 10 mm and a length of 15 mm have been used as the pin. Steel disc with a 62 HRC has been used as the counter face. Figure 2 represents the wear test set up.
Wear test situation. Reference Karamıs, Sarı and Erturun1

In this system, as the samples are fixed, the counter face is rotated at 500 rpm for 15 min. 50, 75, and 100 N loads are carried out one by one for each test. The frictional force data are calculated by this system and data are transferred to a separate computer during the tests. SAE40 oil which is 0.07 mg/min of the weight flow is used as the lubricant. After the friction distance arrived 1225 m, whole tests are ceased.
The Superficial Rockwell hardness values of the samples are measured with a 15-N loading using Rockwell hardness tester with a diamond indenter (the Netherlands). The hardness values have been measured at least 5 times to calculate an average value.
Once the wear test has been carried out, the qualification of the eroded surfaces is performed by optical microscope. The transmission electron microscope (TEM) analyses were performed on the composite samples to reveal the effect of the RE passes on the grain structures of the composites.
III. RESULTS AND DISCUSSION
A. Improvements of microstructure by RE
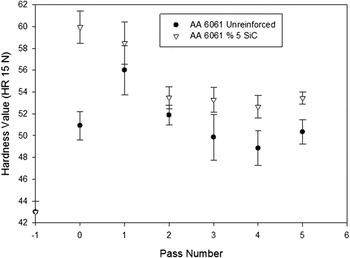
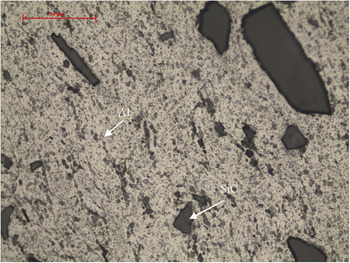
The process temperature is essential in the hardness measurements. For instance, it is possible to control (e.g., increase) the hardness value with number of passes at a test temperature of 473 K while the hardness value does not change with the number of passes as the test temperature goes up to 573 K. Reference Karamıs, Sarı and Erturun1 The grain structure becomes finer as a result of low processing temperature, thus the hardness increases in parallel to the number of passes (Fig. 3). The optic microscope image of AA 6061\SiC\5 composite is shown in Fig. 4.
The variation of the average hardness values depending on the number of passes.

The optic microscope image of AA 6061/SiC/5 composite.

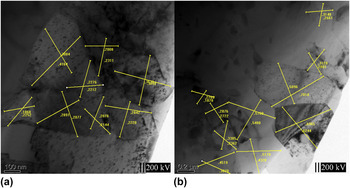
TEM analyses are carried out for the billets, which have 0, 1, 2, 3, 4, and 5 passes among the ones having 5% SiC reinforcement. Measurements have been performed by evaluating 8–10 grains from each image with Image-Pro Plus, an image processing software, and the average sizes of the grains have been calculated. The average sizes of the grains relating to number of passes of the samples are detected as 0.6253, 0.529, 0.2664, 0.4233, 0.359, and 0.4156 μm, for 0, 1, 2, 3, 4, and 5 passes, respectively. TEM images of some samples reinforced with 5% SiC are shown in Fig. 5. Analyses on these images demonstrate that the grain sizes of the samples shrink initially, enlarge slightly after a while, and then shrink again. The grain size has been reduced to ultrafine level (0.26 µm). Similarly, Abdollahi et al. concluded that after severe plastic deformation, grain sizes decrease to lower than 100 nm. Reference Abdollahi, Alizadeh and Baharvandi9
TEM image of grains in composite samples (a) 2 passes (0.2664 µ) and (b) 5 passes (0.4156 µ).

As the number of passes increases, the grain sizes shrink and the hardness lessens. Hardness increases in parallel to grain size enlargement. Hence, the change in the grain size differs from the change in hardness.
B. Wear rates
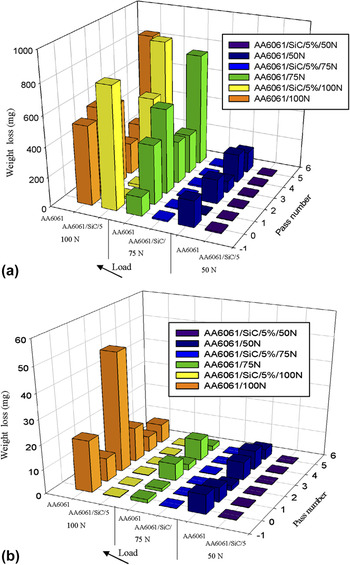
The column chart of weight loss depending on passes and load is shown in Fig. 6. As seen in the chart, the most mass loss for unreinforced samples under dry condition and 50 N load is observed in 0- and 4-pass samples. 5-pass sample has the most mass loss for unreinforced samples under 75 and 100 N loads. Generally, a greater mass loss is detected as the number of passes increase in the unreinforced samples under dry condition.
The loss in weight after RE pass and load. (a) Dry form (b) lubricated form.

Under lubricated conditions, on the other hand, a decrease has been experienced in the weight loss compared with the dry conditions. The most mass loss for the unreinforced samples has been in the 0- and 4-pass samples and in the 4th pass for 75 N and in the 2nd pass for 100 N.
A smaller mass loss is detected when the composites are compared with unreinforced ones. Soy et al. Reference Soy, Demir and Findik10 reported that the coefficient of friction of the composites was lower than that of the unreinforced aluminum. While only a little mass loss appears under dry conditions for reinforced samples under 50 and 75 N, an increase in the mass loss is seen under 100 N. Under lubricated conditions, mass wear for reinforced samples has decreased with the effect of lubrication. Only a little mass loss has been observed under lubricated conditions in all number of passes for the reinforced samples. Under all the loads and conditions except for 100 N under dry condition, a quite smaller weight loss is observed in the wear test and similar behaviors have been displayed for the reinforced composite samples. Unreinforced samples, on the contrary, have shown more unstable features. Lubrication and load are significant factors influencing the weight loss. As the number of passes and load increases, material loss increases, as well. This behavior is in good agreement with the results reported by Dou et al. Reference Dou, Liu, Liu, Xiong and Xia5
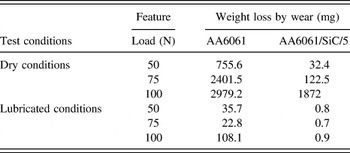
After all 5 passes, the total weight loss is smaller in the lubricated condition compared to the dry condition as seen in Table II. In a general manner, material loss increases in parallel to increase in the load and the number of passes under both conditions.
Total weight loss against load (for all 5 passes).

Analyzing the wear in samples under 300 °C processing heat in terms of the change in the total weight loss relating to load has revealed the fact that weight loss slightly increases with the effect of load. It is clarified that the total weight loss of the samples acquired under dry conditions, 50 and 75 N and 200 °C extrusion heat behaves in the same way. The total weight loss under lubricated conditions cannot be compared to the one under dry conditions.
When the hardness of the reinforced samples are evaluated, it is comprehended that the 1-pass, 2-pass and 5-pass samples have average hardness values of 56 ± 1.5, 51.8 ± 1, and 50.3 ± 1.2 HR15N for 1 pass, 2 passes, and 5 passes, respectively, which are close to each other, but more than the other samples having different passes. Thus, one can mention about a parallel relation between the amount of wear and hardness after the procedures under 200 °C (Fig. 3).
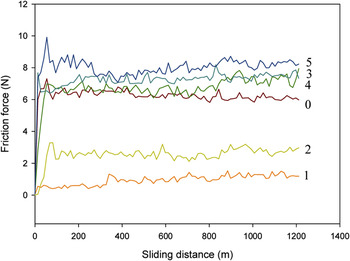
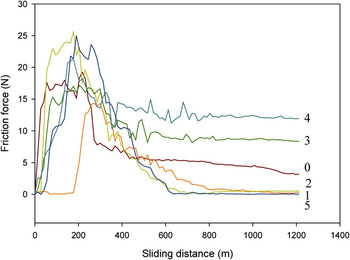
If the average frictional force values of the reinforced samples are considered, a low frictional force is formed as the ceramic particles on the surface contact to the opposite disc (ceramic-metal contact). SiC particles sliding along the wear scar under all loads on the surface of the reinforced composite sample cause quite more mass accumulation under dry conditions than the lubricated conditions. The solid particles lead to lacerations on the surface. While the least frictional force in the composites under dry conditions has occurred with 75 and 100 N loads, the greatest frictional forces have occurred with a 50 N load (Fig. 7). When the frictional force–wear scar curve is examined, frictional force goes up with the increase in the number of passes after pass 1 for the reinforced composite under a 50 N load. Regarding the mean values, the increase in the hardness of the samples whose number of passes increase results in greater frictional forces. The greatest frictional force has been observed in 0-pass and 4-pass samples. No change has been detected in the frictional force along the sliding direction as the number of passes increases under dry conditions and a 50 N load.
The change in friction forces as a function of sliding distance for testing of composite materials in dry form (at 50 N).

Lubricated conditions bring along quite lower frictional forces when compared with dry conditions. The underlying reason is the lubrication over the course of the experiment. Naturally, the frictional force develops a sudden increase at the beginning of the movement since it is hard to render the first movement due to the adhesion of frictional surfaces. Therefore, the frictional force formed gets higher till the surfaces settle into their shapes, and finally follows an almost steady-state regime.
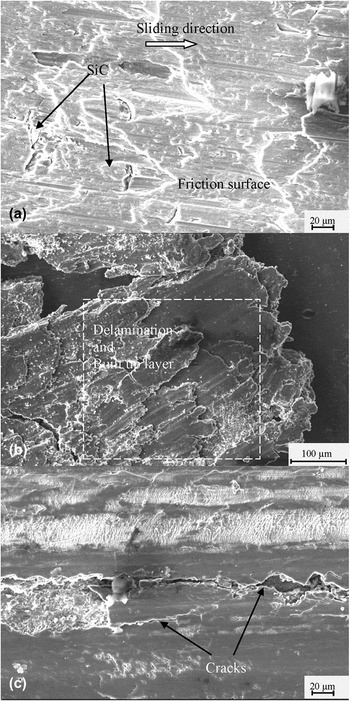
The surface softening with the effect of frictional heat causes material accumulation in the frictional direction, a plastic yielding in other words, which is more under dry conditions as a result of plastic deformation (Fig. 8). This plastic yielding causes layer separation. Scars on the wear surface are the abrasion gutters formed after reinforcement particles scratch the surface. Deep scratches, accumulation zones, foliation in the corner parts of the sample, and fractions are observed when the surface structures of the wear region are analyzed [Figs. 8(a)–8(d)]. The heat occurring with the effect of frictional force brings about plastic deformation on the surface and yields in the matrix. This situation demonstrates that the wear mechanism is adhesive and abrasive, and causes plastic yielding.
The worn surfaces of composites materials showing after 100 N in dry form (a) plastic deformation, (b) delamination with built up layers and (c) cracks.

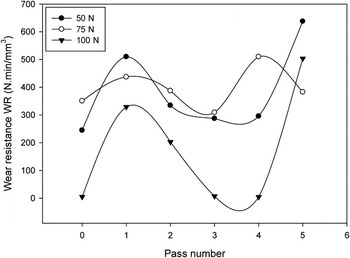
Wear rate [Wear Rate = volume/(load × time)] [W, mm3/(N m)] is calculated by dividing the volume of worn region to load and wear time regarding the weight loss in the samples. Wear resistance [W R, (N m)/mm3] is calculated by taking the reciprocal of the wear rate. Variations of the wear resistance depending on the number of RE passes for the reinforced composite under dry conditions are given in Fig. 9. Wear resistance in the composite samples decreases as the applied load increases. For all the loads, the number of passes and wear resistance has a trend which increases initially, decreases afterward and increases again.
The variation of wear resistance with RE pass and load for the composite samples tested under dry conditions.

Having evaluated the wear resistance of SiC reinforced samples processed under 200 °C on the basis of number of passes, it is detected that wear resistance generally decreases between 1 and 3 passes, and increases between 0 and 1, and 3 and 5 passes under all loads. Similar results have been acquired in some of the studies in the literature. Reference Mustafa8 The hardness of the samples exhibits a parallel change: it has increased in the interval of 0–1 pass (so has the wear resistance), decreased in the interval of 1–4 passes (so has the wear resistance) and the hardness increasing again in 4–5 passes has caused an increase in the wear resistance (Fig. 9). According to Thuong et al., Reference Thuong, Zuhailawati, Seman, Huy and Dhindaw24 the wear resistance of the aluminum alloy was improved and the friction coefficient of the aluminum alloy decreased by equal channel angular pressing processing due to the increase in hardness. Reference Thuong, Zuhailawati, Seman, Huy and Dhindaw24 Consequently, systematic connection is confirmed between the hardness of the samples and wears resistance for this procedure and experimental conditions.
Interpretation of the increase in the amount of wear depending on load has unveiled that the amount of wear increases in general under 50 and 100 N loads Reference Karamıs, Sarı and Erturun1 for the samples processed under 300 °C while it remains stable in the 0-pass, 3-pass, and 4-pass samples for the given loads under 200 °C process heat. Koraman reported that wear rates of samples increased with increasing test temperature. Reference Koraman, Baydoğan, Sayılgan and Kalkanlı25 The reason behind is that the samples under the 200 °C process heat have a smaller grain structure and higher hardness. The same tendency is in question for the wear resistance, too (Figs. 3 and 9).
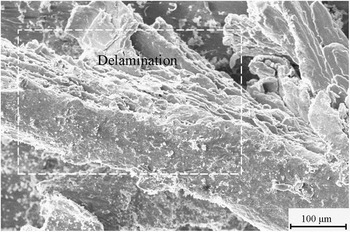
Amount of the wear and scars on the surface are quite less when the wear under lubricated condition is compared with its conjugate under dry condition in the unreinforced AA 6061 samples. Under dry conditions, delamination and sliding happens on the surface via an excessive plastic deformation. Under the same conditions with reinforced sample, surface of the unreinforced sample forms wide wear surfaces by causing smearing on the opposite component (metal to metal contact) resulting from being lack of reinforcement particles. Only a little wear develops under lubricated conditions, and the worn particles stick to surface again with the effect of lubrication. On the other hand, the worn particles stick to the opposite disc and create accumulations in the reverse direction of sliding by being transferred back to the surface of sample under dry conditions. While these accumulations occur in the sliding direction on the sample surface as they do not stick to the opposite disc with the effect of wear particles in the composites, they occur in the reverse sliding direction by sticking to the opposite disc at first and moving to sample again because of the soft matrix in the unreinforced samples (Fig. 10).
Delamination of the surfaces of worn composites of 3 passes at 100 N under dry conditions.

The greatest frictional force is observed in the 2-pass and 5-pass samples among the unreinforced samples, for all the number of passes, under dry conditions, and at 75 N load. Initiating sample movement is difficult from a static point of view because of the adhesion of the friction surfaces. For all the number of passes, frictional forces have increased at first and came into existence in values close to each other by decreasing after the sample surfaces settles into their shapes with abrasion (Fig. 11).
The change of frictional forces as a function of sliding distance after testing of unreinforced samples at 75 N in dry form.

IV. CONCLUSIONS
The purpose of the present study is to investigate the effect of the RE process on the wear behavior of AA 6061 composites. For this purpose, billets have been produced from the test materials and subjected to SPD using RE processing. Based on the study, the conclusions are as followings:
-
(1) For the studied process and experiment conditions, a clear relationship is achieved between the weight loss, wear resistance, and hardness in the samples.
-
(2) In all the samples, the weight loss in lubricated conditions is significantly lower than that in dry conditions. In general, under both conditions, when load and the number of pass increases, material loss increases too.
-
(3) In general, abrasive and adhesive wear types are observed in the surfaces of worn reinforced composites, while the wear modes are mainly adhesive in the unreinforced AA 6061 samples.
-
(4) When the applied load increases, the wear resistance of the composite sample decreases. For all the loads, the wear resistance initially increases, and then shows a decreasing trend and increasing again with the number of passes.
-
(5) For all the numbers of passes, friction forces increase at first, and then decreases as a result of eroded surface of the sample occurred in close to each other.
ACKNOWLEDGMENTS
The authors acknowledge the financial support of Erciyes University (Project No. FBD-09668) and the Scientific and Technological Research Council of Turkey (TUBİTAK) (Project No. 108M562)