Introduction
The Campiglia Marittima area (Southern Tuscany, Italy) has been exploited extensively from the Etruscan period until the 1980's for its abundant Cu-Pb-Zn-Fe-(Ag,Sn) sulfide/oxide skarn mineralization. These are clearly linked to the magmatic hydrothermal systems generated by the emplacement of relatively shallow intrusions and dykes during the Pliocene (Tanelli, et al., Reference Tanelli, Morelli and Benvenuti1993 and references therein; Peccerillo and Donati, Reference Peccerillo and Donati2003; Vezzoni et al., Reference Vezzoni, Dini and Rocchi2016). The quartz-monzonitic intrusion (Barberi et al, Reference Barberi, Innocenti and Mazzuoli1967; Poli et al., Reference Poli, Manetti and Tommasini1989) of ‘Botro ai Marmi’ (radiometric age of 5.7 Ma, Borsi et al., Reference Borsi, Ferrara and Tongiorgi1967) is one of the most important magmatic bodies cropping out in the area and can be considered a typical example of an intrusion-centred magmatic hydrothermal system. The development of magmatic hydrothermal systems, associated with intrusive bodies belonging to the Tuscan Magmatic Province, is a quite common feature that has been reported by several authors for other areas of southern Tuscany (Ruggieri and Lattanzi, Reference Ruggieri and Lattanzi1992; Maineri, Reference Maineri1996; Dini et al., Reference Dini, Mazzarini, Musumeci and Rocchi2008; Rossetti and Tecce Reference Rossetti and Tecce2008; Bakker and Schilli, Reference Bakker and Schilli2016). The emplacement of the ‘Botro ai Marmi’ intrusion within the Upper Triassic to Lower Liassic carbonates of the Tuscan Nappe prompted the development of a thermometamorphic and metasomatic aureole characterized by the formation of marbles and systems of skarn (Barberi et al., Reference Barberi, Innocenti and Mazzuoli1967, Leoni and Tamponi, Reference Leoni and Tamponi1991) in which Cu ± Sn ± W mineralization occurred (Tanelli et al., Reference Tanelli, Morelli and Benvenuti1993).
This work is based on a detailed fluid-inclusion study and aims to provide good physico-chemical constraints on the evolution of the fluids involved in the late- and post-magmatic hydrothermal activity that affected the ‘Botro ai Marmi’ intrusion, providing inferences on their origin and variation of temperature and pressure with time. These results assume particular relevance if the exposed ‘Botro ai Marmi’ magmatic hydrothermal system is considered to some extent as a fossil analogue to the active high-enthalpy Larderello geothermal system, which is located only few kilometres to the east.
Geological framework
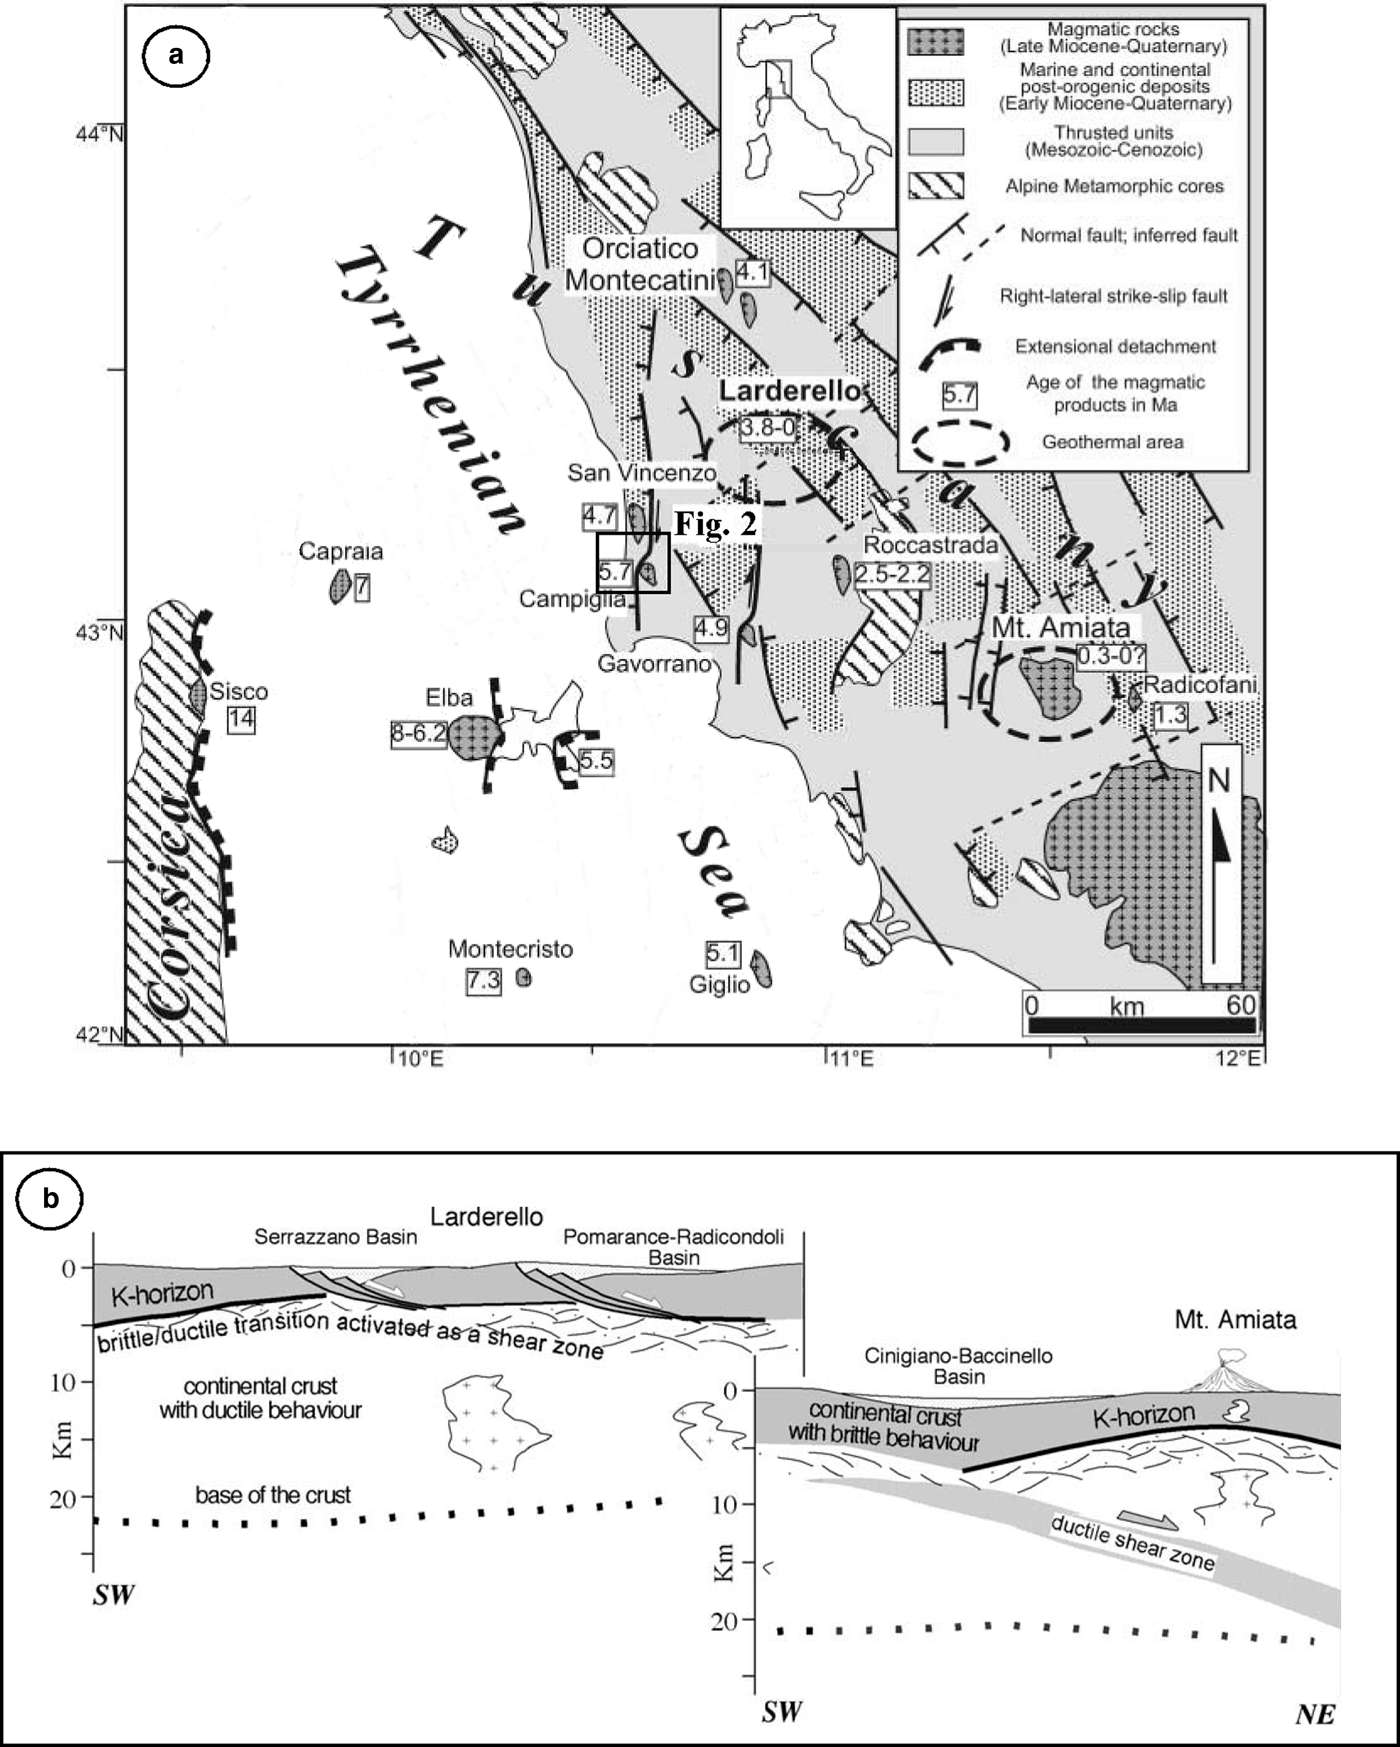
The study area is located in the inner zone of the Northern Apennines (Fig. 1), an arc-shaped collisional belt originating from the convergence and subsequent collision (Cretaceous to Early Miocene) between the Adria and the Sardinia-Corsica microplates. This process resulted in stacking of tectonic units from the palaeogeographic domains of the Inner Northern Apennines. The resulting thrust-belt complex is made up of the tectonic units, from top to bottom (Carmignani et al., Reference Carmignani, Decandia, Disperati, Fantozzi, Lazzarotto, Liotta and Meccheri1994): (1) Ligurian and Subligurian units, which consist of remnants of Jurassic oceanic crust (low-grade metabasic and mafic rocks), its Upper Jurassic to Lower Cretaceous pelagic sedimentary cover and overlying Cretaceous–Oligocene arenaceous and calcareous turbidite involved in multiple thrust sheets; (2) Tuscan units, including sedimentary (Tuscan Nappe, formed by shallow-marine pelagic carbonaceous/carbonaceous siliceous and pelagic terrigenous formations) and metamorphic (Monticiano-Roccastrada Unit, a mainly continental siliciclastic formation) sequences ranging in age from Paleozoic to Early Miocene.
Simplified tectonic map (a) of the northern Tyrrhenian area (after Rossetti et al., Reference Rossetti, Balsamo, Villa, Bouybaouenne, Faccenna and Funiciello2008, modified); and geological sketch (b) of crustal structure in Southern Tuscany (after Brogi et al., Reference Brogi, Lazzarotto, Liotta and Ranalli2005, modified). The study area is within the box.
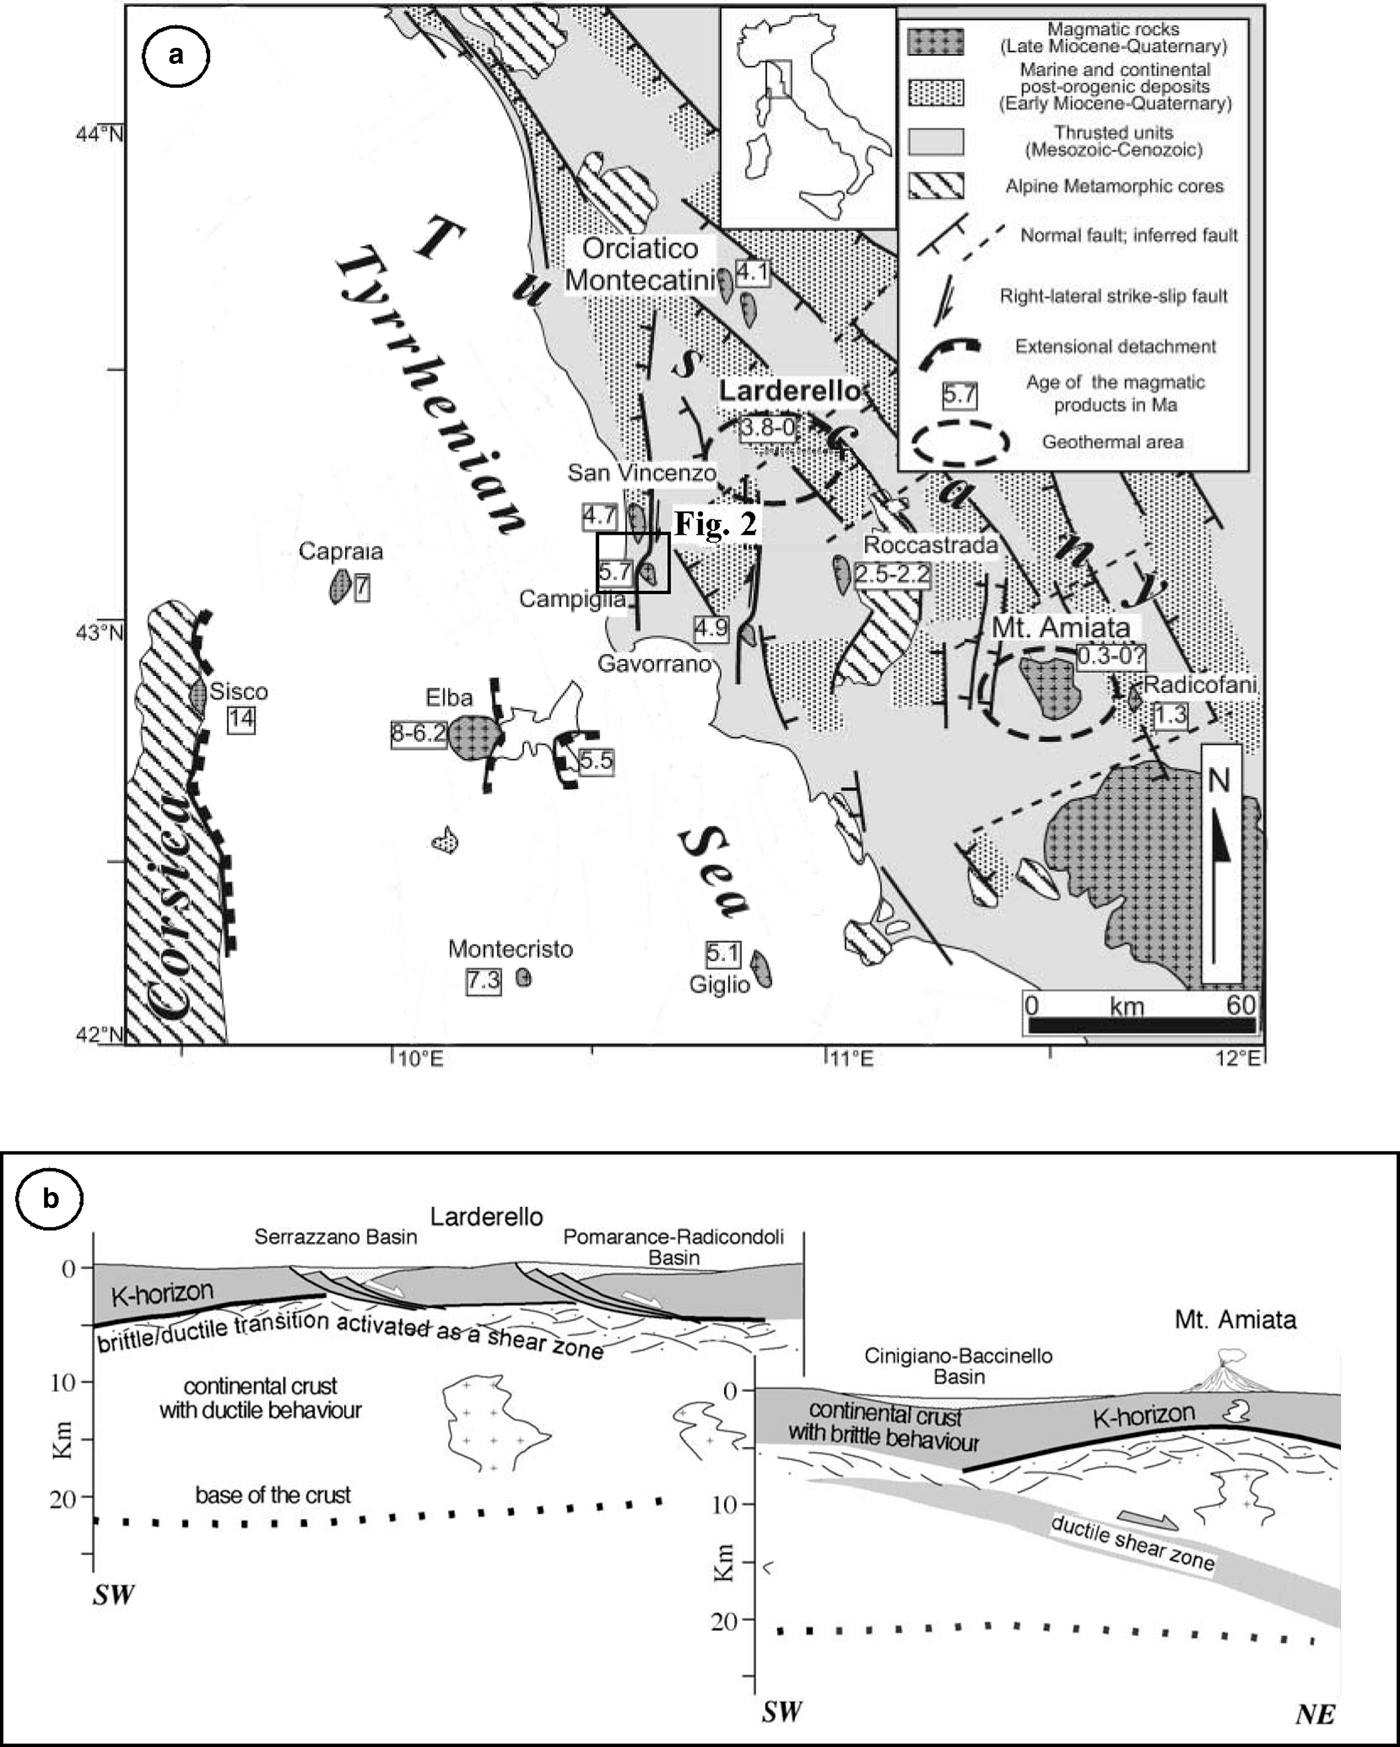
The original Oligocene architecture of the thrust belt was modified by Neogene post-orogenic extensional tectonics (Carmignani et al., Reference Carmignani, Decandia, Disperati, Fantozzi, Lazzarotto, Liotta and Meccheri1994; Brogi et al., Reference Brogi, Lazzarotto, Liotta and Ranalli2005; Brogi and Liotta, Reference Brogi and Liotta2008). Since the early Pliocene, high-angle normal and strike-slip faults dissected the extensional detachments forming NNW–SSE trending basins of Pliocene–Quaternary age that were filled successively by marine and continental sediments (Martini and Sagri, Reference Martini and Sagri1993). Extensional structures developed contemporaneously with the emplacement of acidic magmatic bodies at shallow crustal levels (Tuscan Magmatic Province; Innocenti et al., Reference Innocenti, Serri, Ferrara, Manetti and Tonarini1992; Peccerillo, Reference Peccerillo2001; Peccerillo and Donati, Reference Peccerillo and Donati2003), with an overall eastward migration, following the extensional deformation (Serri et al., Reference Serri, Innocenti and Manetti1993; Jolivet et al., Reference Jolivet, Faccenna, Goffè, Mattei, Brunet, Rossetti, Cadet, Funiciello, Theye, Storti and D'Agostino1998; Rossetti et al., Reference Rossetti, Faccenna, Acocella, Funiciello, Jolivet, Salvini, Vendeville, Mart and Vigneresse2000, Reference Rossetti, Balsamo, Villa, Bouybaouenne, Faccenna and Funiciello2008; Acocella and Rossetti, Reference Acocella and Rossetti2002; Dini et al., Reference Dini, Gianelli, Puxeddu and Ruggieri2005). Intrusive rocks crop out mainly in the Tuscan archipelago (Monte Capanne, Porto Azzurro, Montecristo and Giglio intrusions) and along the coastal area of southern Tuscany (Campiglia and Gavorrano granites, Rocchi et al., Reference Rocchi, Dini, Mazzarini and Poli2003), whereas, buried intrusions occur in the subsurface of the Larderello geothermal field. The emplacement of these magmatic bodies produced the superheating of hosting rocks accompanied by intense circulation of hydrothermal fluids within the permeable substratum and is at the origin of the wide pyrite, Fe, base metals, Hg, Sb and minor Ag–Au ore mineralization and of the active high-enthalpy geothermal systems (Larderello and Mt. Amiata) that characterize southern Tuscany (Marinelli, Reference Marinelli1963, Reference Marinelli1969; Reference Marinelli1983; Tanelli, Reference Tanelli1983; Lattanzi, Reference Lattanzi1999; Bellani et al., Reference Bellani, Brogi, Lazzarotto, Liotta and Ranalli2004).
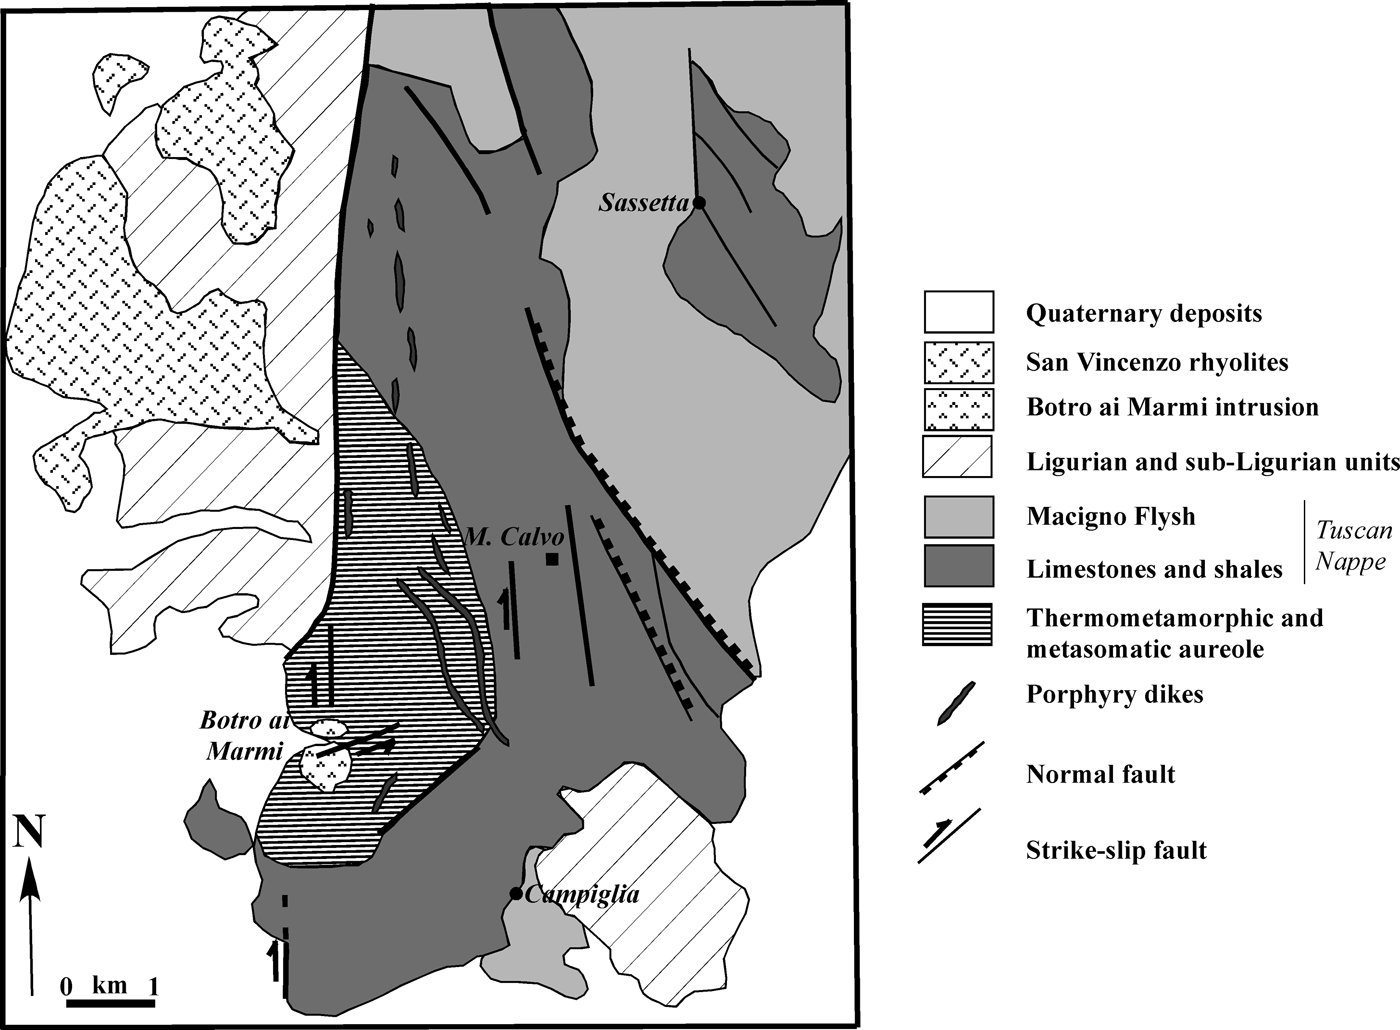
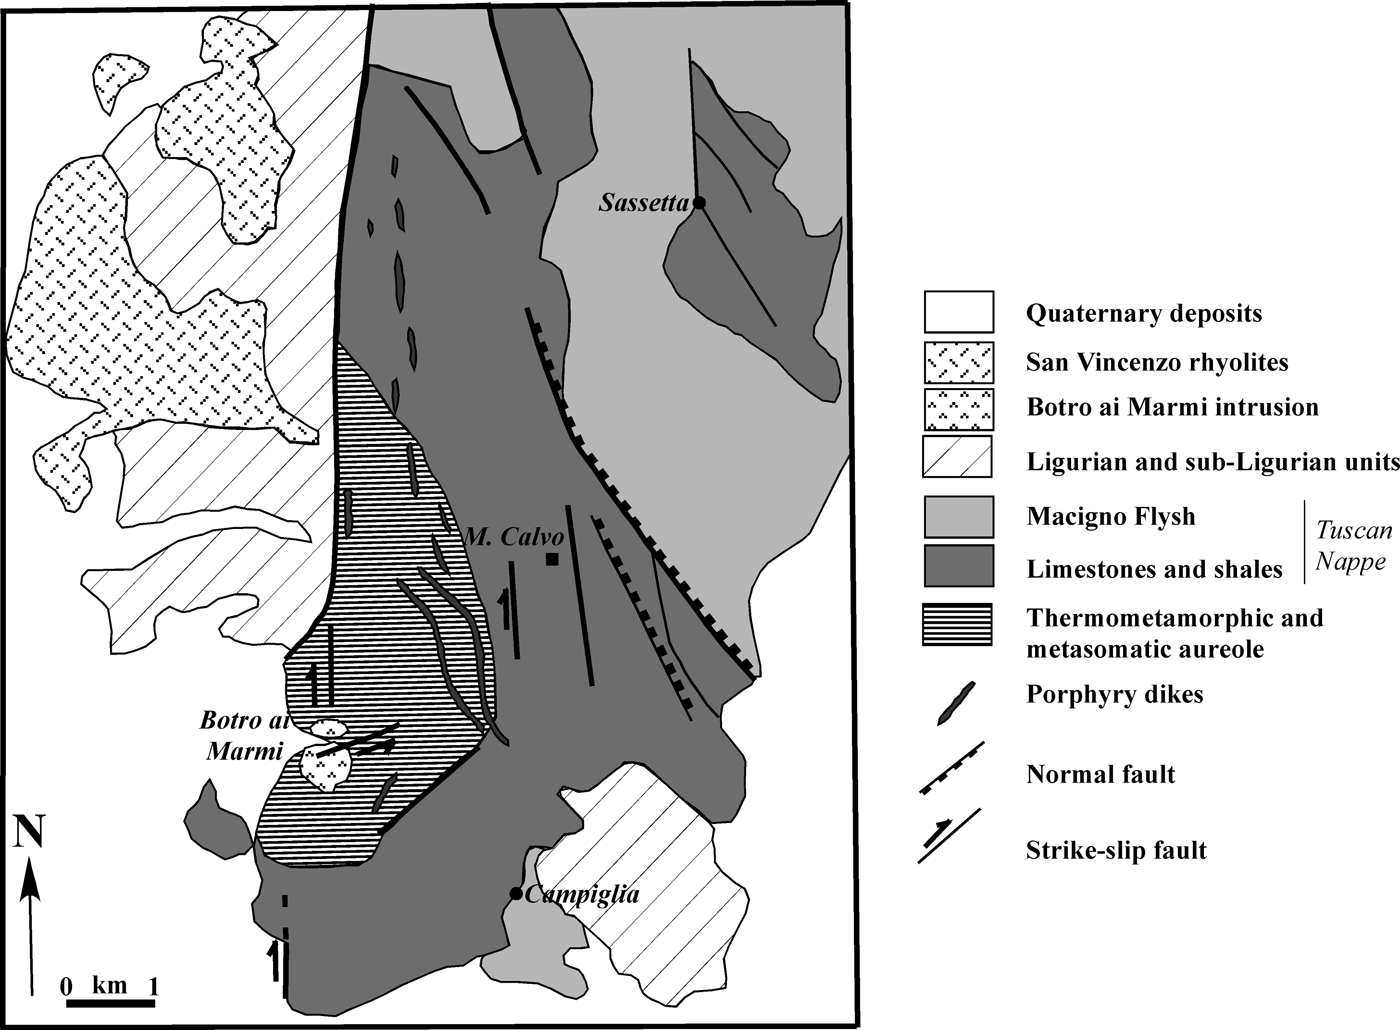
The Campiglia Ridge, located in the westernmost part of the Colline Metallifere area, is composed of rocks of the Tuscan Nappe sequence and is bordered to the west and east by N–S and NW–SE trending faults (Figs 1, 2), respectively (Rossetti et al., Reference Rossetti, Faccenna, Acocella, Funiciello, Jolivet, Salvini, Vendeville, Mart and Vigneresse2000). The quartz-monzonitic intrusion of ‘Botro ai Marmi’ crops out on the western edge of the ridge (Fig. 2) and is associated with the development of a wide thermometamorphic and metasomatic aureola characterized by the occurrence of marble and skarn.
Geological map of the Campiglia Ridge (modified after Rossetti et al., Reference Rossetti, Faccenna, Acocella, Funiciello, Jolivet, Salvini, Vendeville, Mart and Vigneresse2000).
Hydrothermal alteration
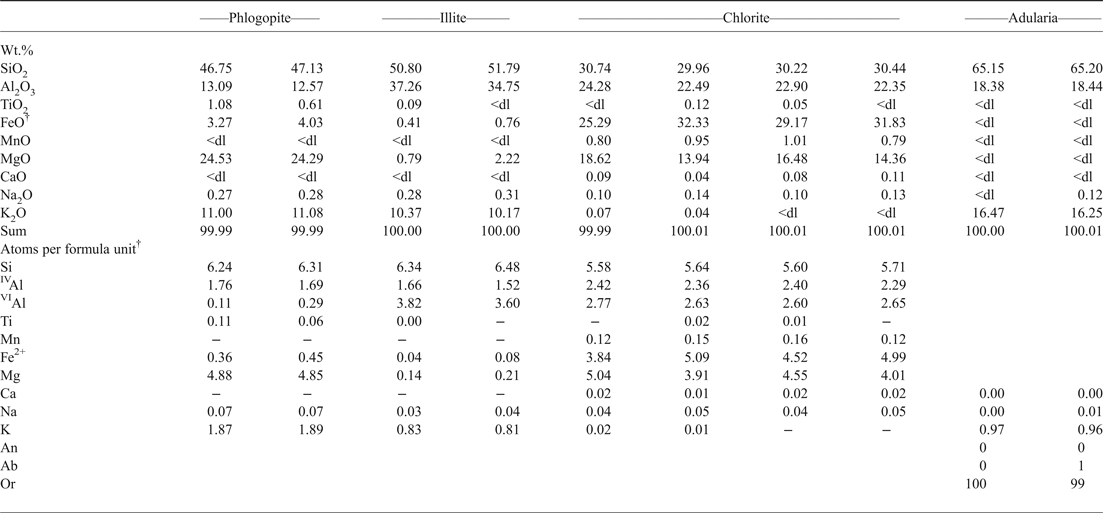
The ‘Botro ai Marmi’ intrusion was affected by a widespread hydrothermal alteration, which occurred through three main stages. (1) The earliest alteration was prevalently potassic and is characterized by a pervasively developed mineral assemblage composed of K-feldspar + irregularly shaped crystals of phlogopite (Fig. 3a, Table 1). This initial potassic stage was followed by (2) a propylitic alteration that produced quartz + adularia + chlorite + illite + mixed sulfide veins cross-cutting the intrusive body (Fig. 3b, Table 1), and a pervasive alteration of quartz-monzonite partially overprinting the potassic facies (Figs 3a,c). Galena, pyrite, arsenopyrite, cassiterite, uraninite and bismuthinite are associated with the propylitically altered veins. (3) The latest stage of the hydrothermal alteration is represented by the supergene calcite (Fig. 3d) and iron-oxide-hydroxide-bearing massive deposits (‘brucioni’) that occur around the upper part of the intrusion outcrop as late alteration and re-mobilization of the primary skarn mineralization, as also reported by Conticini et al. (Reference Conticini, Menchetti, Sabelli and Trosti Ferroni1980) and Tanelli et al. (Reference Tanelli, Morelli and Benvenuti1993).
Back-scattered electron images. (a) Primary plagioclase altered by K-feldspar and phlogopite (potassic alteration facies). Chlorite and illite (propylitic alteration facies) partially overprinting K-feldspar and phlogopite. (b) Quartz + adularia + chlorite + pyrite vein (propylitic alteration) crosscuts the intrusive body. (c) Pervasive propylitic alteration, made up of quartz + adularia + chlorite + illite, obliterates the primary mineralogical assemblage of quartz-monzonite intrusion. Abbreviations: plg = plagioclase, K-feld = K-feldspar, phl = phlogopite, chl = chlorite, ill = illite, qz = quartz, adu = adularia, py = pyrite, cc = calcite.

Representative compositions of phlogopite, illite, chlorite and adularia*.
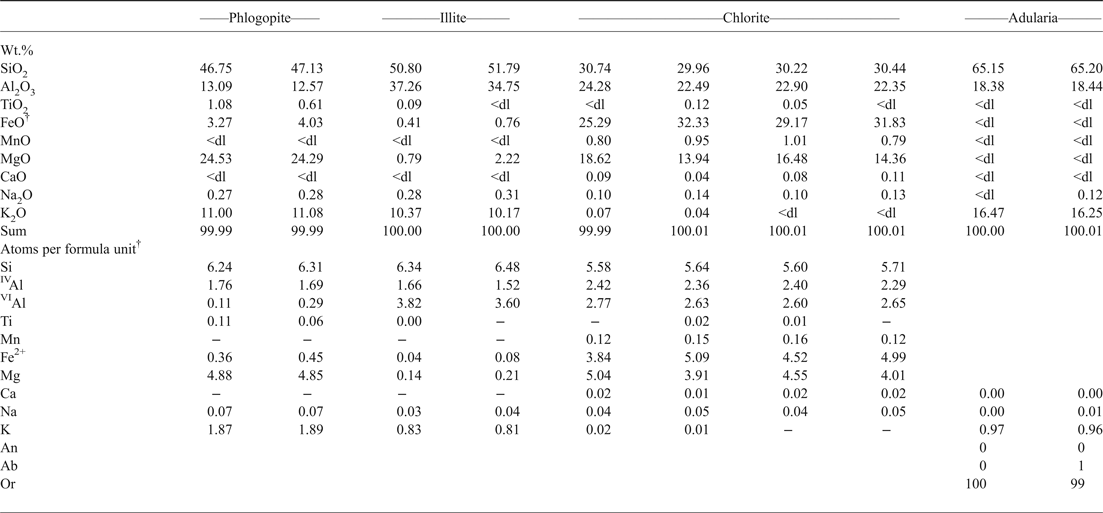
* Analyses have been carried out by energy-dispersive spectroscopy using a Philips XL30 apparatus coupled with EDAX Genesis micro-analytical system (Earth Science Department, University of Pisa) at 20 kV accelerating energy and 0.1 nA beam current. Before each analytical session, calibration and standardization using international mineral standards were performed. Analyses are normalized to 100 due to EDAX software used.
† Structural formulas have been calculated on the basis of: 22 oxygens for phlogopite and illite, 28 oxygens for chlorite and 8 oxygens for adularia; total iron has been considered as ferrous.
<dl = below detection limit.
Fluid-inclusion investigation
Analytical methods
A fluid-inclusion investigation was carried out on quartz crystals from late magmatic veins in the ‘Botro ai Marmi’ intrusion, and on calcite crystals from the supergene iron-oxide-hydroxide-bearing deposits. The reconnaissance survey of fluid inclusions was undertaken in over 30 samples, to assess the spatial variability of fluid-inclusion characteristics, and five doubly polished thin sections (100–300 µm thick) were prepared for petrography and microthermometric determinations. Measurements were made using a Linkam THMS 600 heating-freezing stage (Earth Sciences Department, University of Pisa). The accuracy of measurements was ±2°C at 398°C controlled by the melting point of K2Cr2O7, ±0.1°C at 0°C and ±0.2°C at –56.6°C, controlled by using certified pure water and CO2-bearing synthetic fluid inclusions (Synthetic Fluid Inclusion Reference Set, Bubbles Inc., USA). The rate of heating and freezing experiments was varied as a function of the rate of transformations in the inclusions and ranged from 2 to 30°C/min. Salinities of fluid inclusions were calculated from final ice-melting, halite dissolution and clathrate melting temperatures using the equations of Sterner et al. (Reference Sterner, Hall and Bodnar1988) and Bodnar (Reference Bodnar1993) for the H2O–NaCl system, and Darling (Reference Darling1991) for the H2O–CO2–NaCl system respectively.
Results
Petrography and texture of fluid inclusions
Fluid inclusions hosted within quartz have generally ellipsoidal morphologies and in some cases display negative crystal morphologies, whereas those hosted within calcite are highly irregular in shape. Some inclusions (particularly those hosted within calcite) display variable liquid-to-vapour ratios suggesting that they were affected by post-entrapment processes (i.e. necking down or stretching); as a consequence, their microthermometric data are meaningless and are not reported. The classification of fluid-inclusion types observed in this study is primarily based on phase proportions at room temperature. All descriptions strictly refer to fluid-inclusion assemblages (FIAs, Goldstein and Reynolds, Reference Goldstein and Reynolds1994), avoiding single isolated fluid inclusions, and the types of fluid inclusions in each FIA were noted. A close examination of the appearance of fluid inclusions at room temperature has allowed the identification of three main types of fluid inclusions: multiphase (liquid + vapour + daughter minerals) inclusions (LVHS), liquid rich at room temperature (hosted within quartz crystals); two-phase (liquid + vapour) inclusions (LV), liquid rich at room temperature (hosted within either quartz and calcite crystals); and two-phase (vapour + liquid) inclusions (VL), vapour rich at room temperature (hosted within quartz crystals).
The LVHS inclusions are 20–70 µm in size and consist of liquid + vapour + halite + sylvite + other solids (Fe-Cu-Sn-Zn-As sulfides, scheelite, fluorite, baryte, carbonates, as reported in Caiozzi et al., Reference Caiozzi, Fulignati, Gioncada and Sbrana1998, on the basis of energy-dispersive spectrometry analysis on opened LVHS inclusions hosted within the same samples considered for the present study). On the basis of the number and type of solids and the distribution of fluid-inclusion types in the quartz crystals, we have further classified LVHS fluid inclusions into two subtypes. Subtype LVHS1 inclusions are distributed randomly inside the quartz crystals and typically form isolated clusters (Fig. 4a), and hence bear an unambiguous primary origin (Goldstein, Reference Goldstein, Samson, Anderson and Marshall2003). They are characterized by the presence of halite + sylvite + several other solids (Figs 4b,c). Some of them have tabular and elongated habits and show birefringence. Opaque minerals are also present. Vapour bubbles occupy <30% of the inclusions by volume, whereas the solid phases occupy ~60–70%. Subtype LVHS2 inclusions are generally distributed along healed fractures in quartz suggesting a secondary origin (Goldstein, Reference Goldstein, Samson, Anderson and Marshall2003) and are typically spatially associated with vapour-rich inclusions (Figs 4d,e). They contain halite + sylvite ± one or two solids; opaque minerals are very rare. The bubble takes up ~20% of the inclusion volume, whereas the solids are ~50%.
Microphotographs of the different fluid-inclusion types: (a, b, c) multiphase LVHS1 primary fluid inclusions in quartz; (d, e) secondary trails of LVHS2 multiphase and associated VL two-phase vapour-rich fluid inclusions in quartz; (f) secondary trail of LV1 two-phase liquid-rich fluid inclusions in quartz; (g) secondary trail of LV2 two-phase liquid-rich fluid inclusions in quartz; and (h) LV3 two-phase liquid-rich fluid inclusions in calcite.
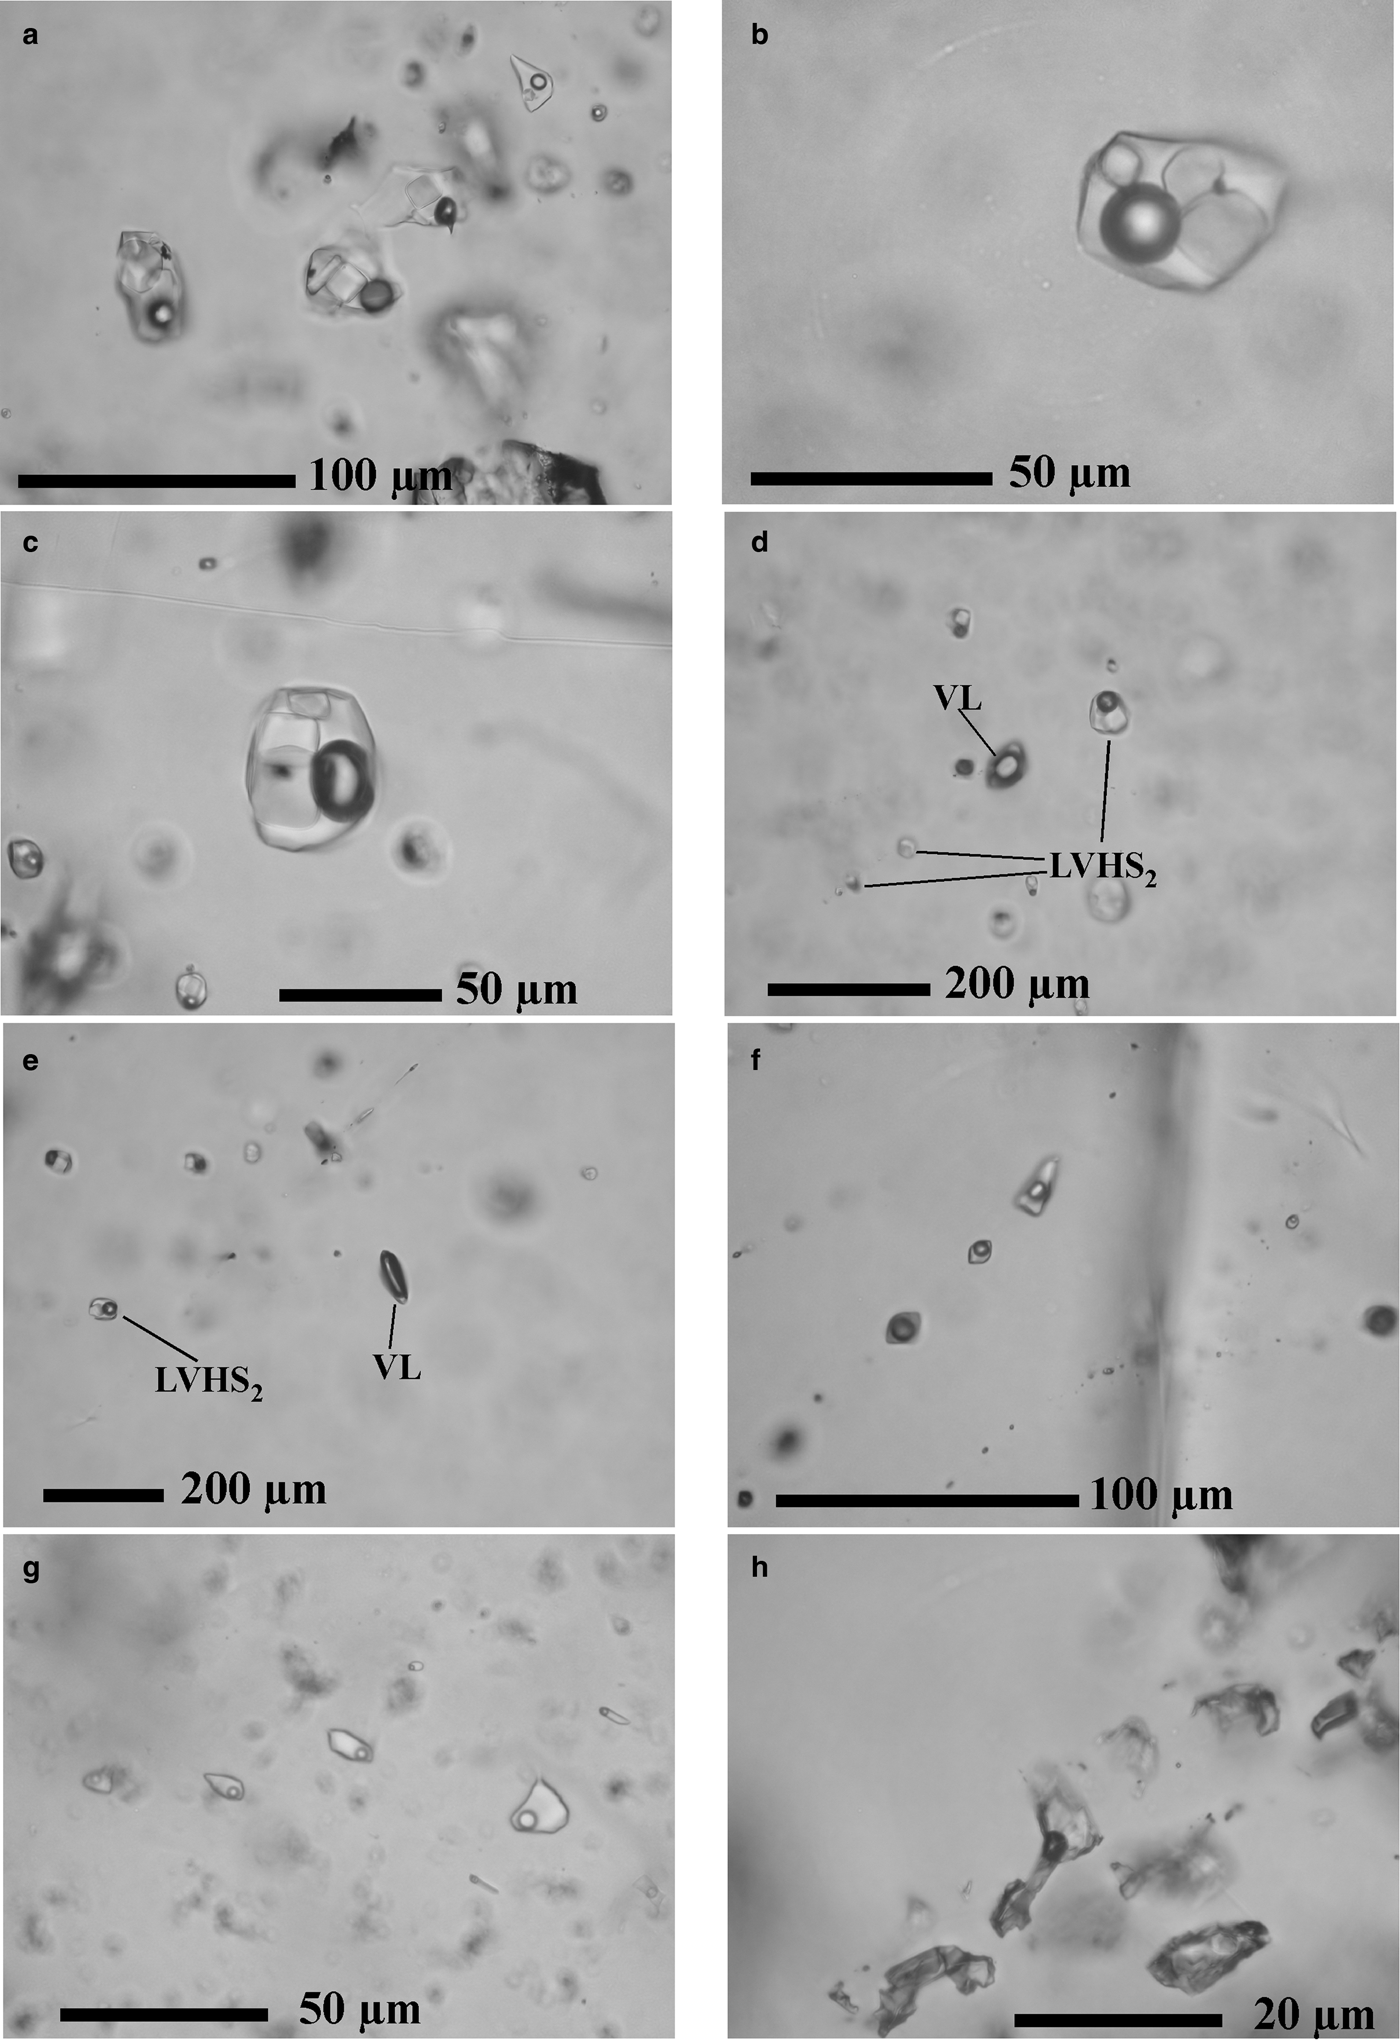
Inclusions of type LV consist of liquid + vapour with the liquid phase volumetrically dominant. These fluid inclusions are generally between 10 and 30 µm in size and were commonly observed in quartz crystals, always forming secondary trails. We have further classified LV fluid inclusions hosted in quartz into two subtypes on the basis of the degree of fill. In LV1 inclusions the vapour bubbles are variable in size from 30% to 40% of inclusion volumes (Fig. 4f), whereas in LV2 inclusions the vapour bubbles occupy ~10% (Fig. 4g). Inclusions LV1 and LV2 show a distinct homogenization temperature. Textural relationships suggest that LV2 inclusions postdate the LV1 population. Inclusions in supergene calcite (LV3) are rare and have an irregular shape, and the bubbles fill ~30% of the inclusion (Fig. 4h).
The VL inclusions contain vapour + liquid ± CO2 (gas) where a vapour bubble consists of >90% of the inclusion volume. They are generally between 10 and 30 µm in size and mostly occur associated spatially with LVHS2 inclusions (Figs 4d,e). Because of the small amount of liquid phase, we were able to study only a few inclusions of this type. No daughter crystals or liquid CO2 were observed.
Microthermometric measurements
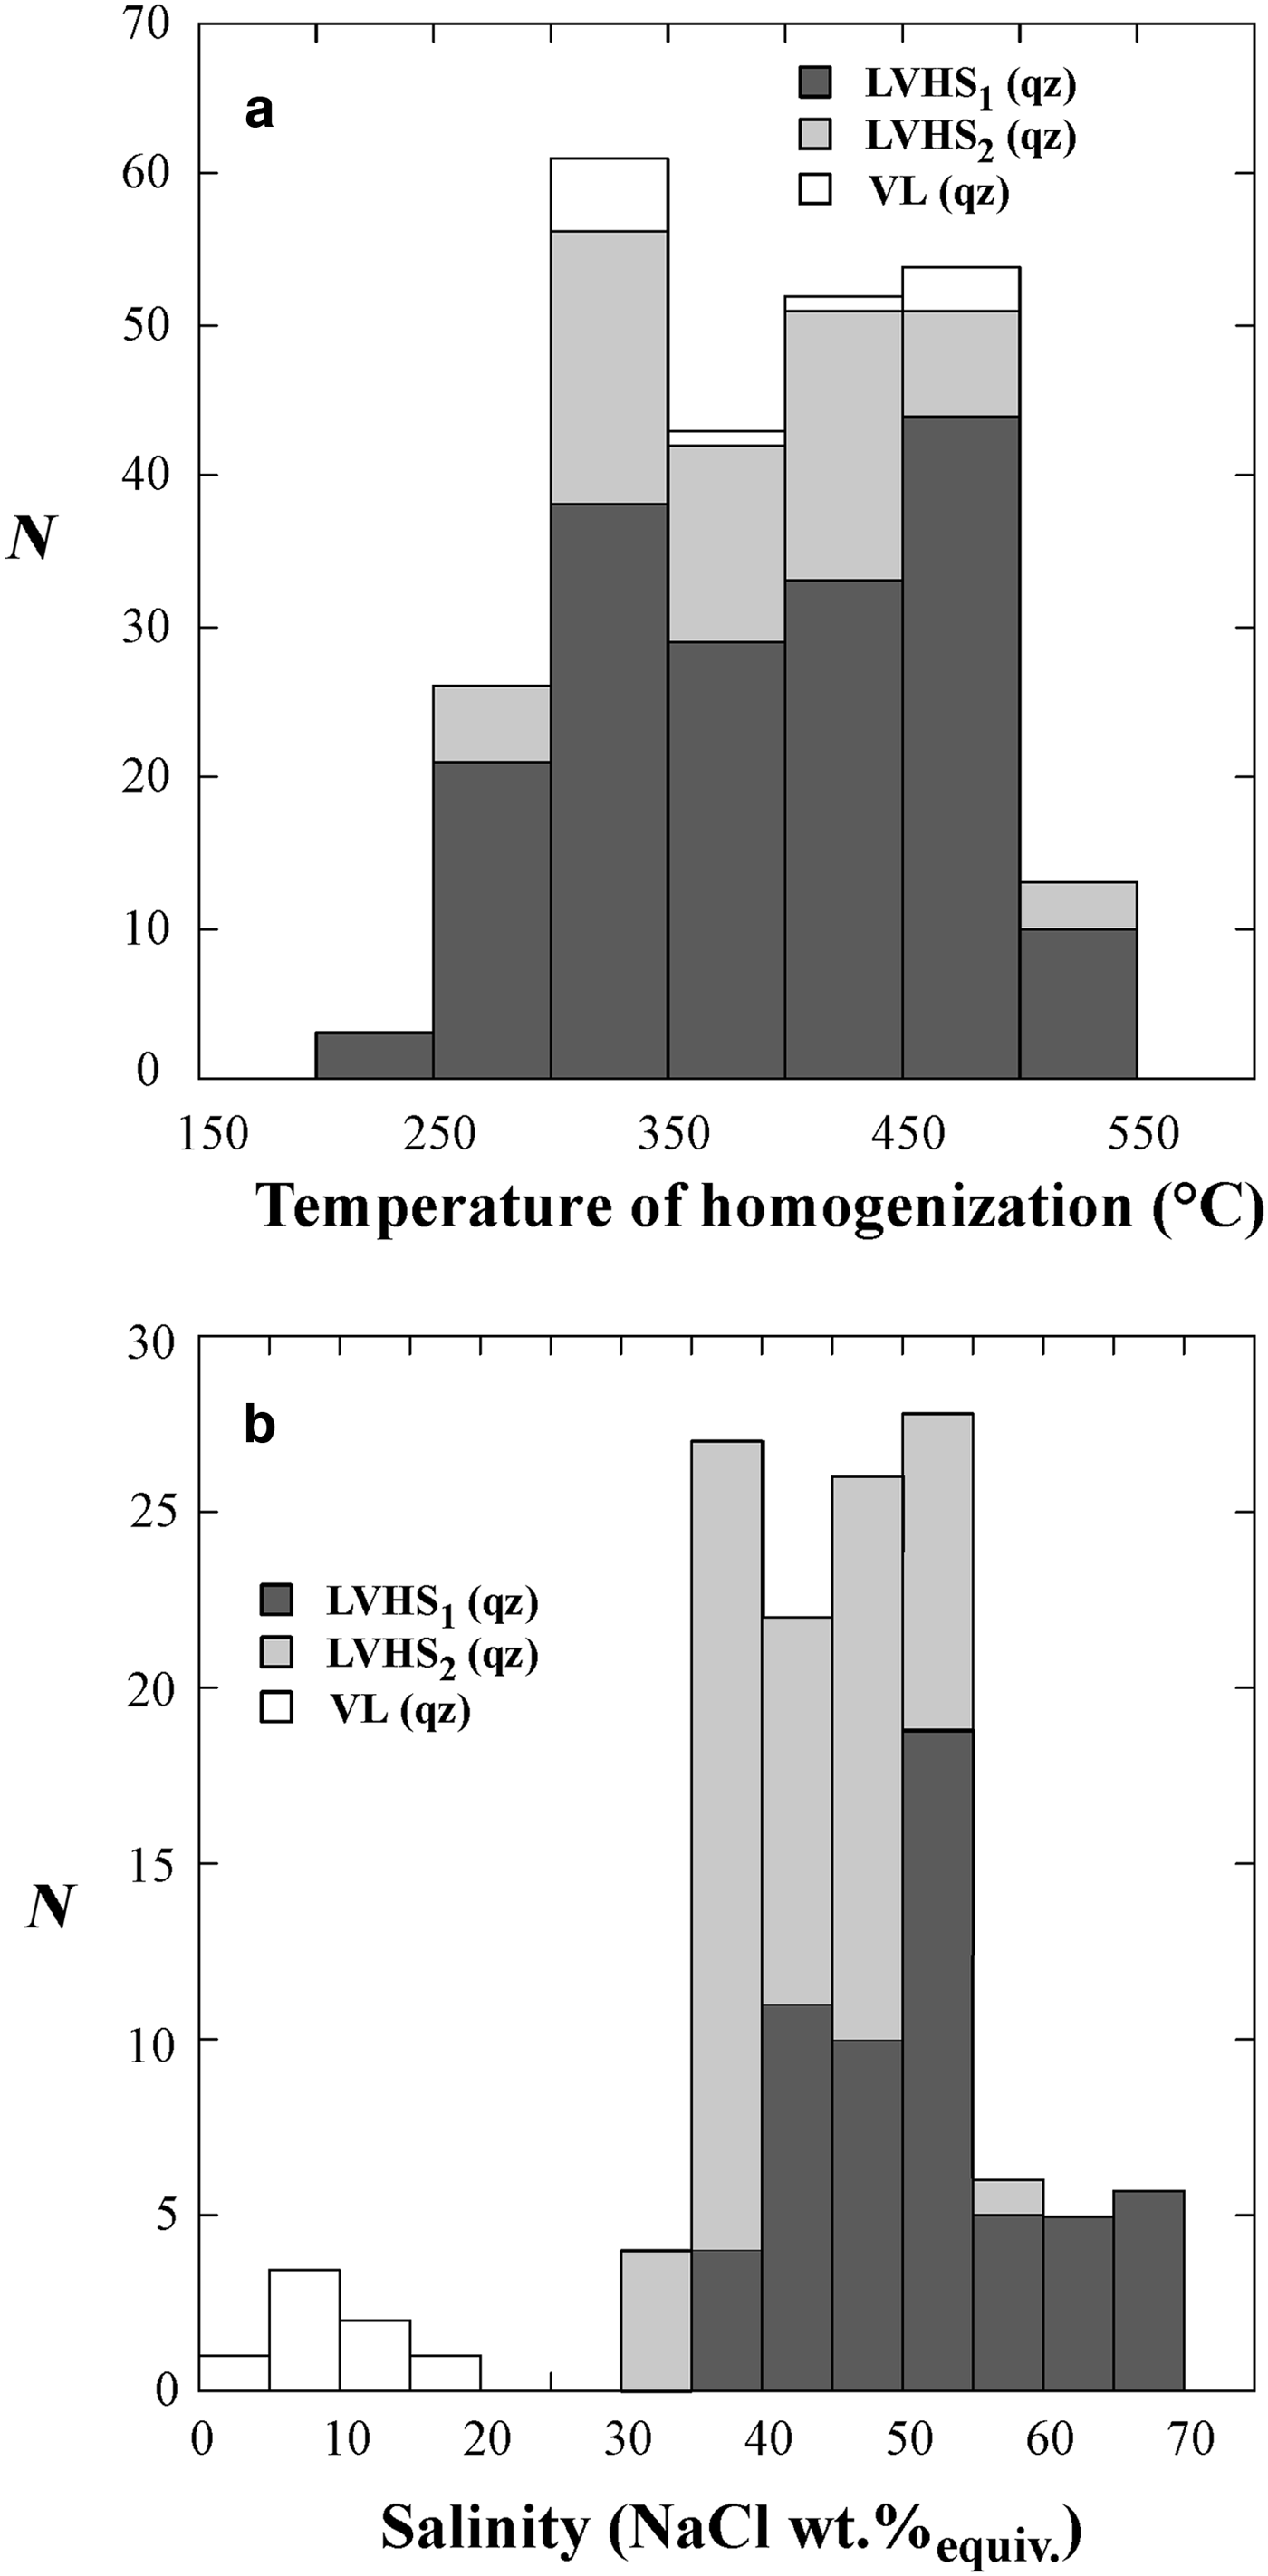
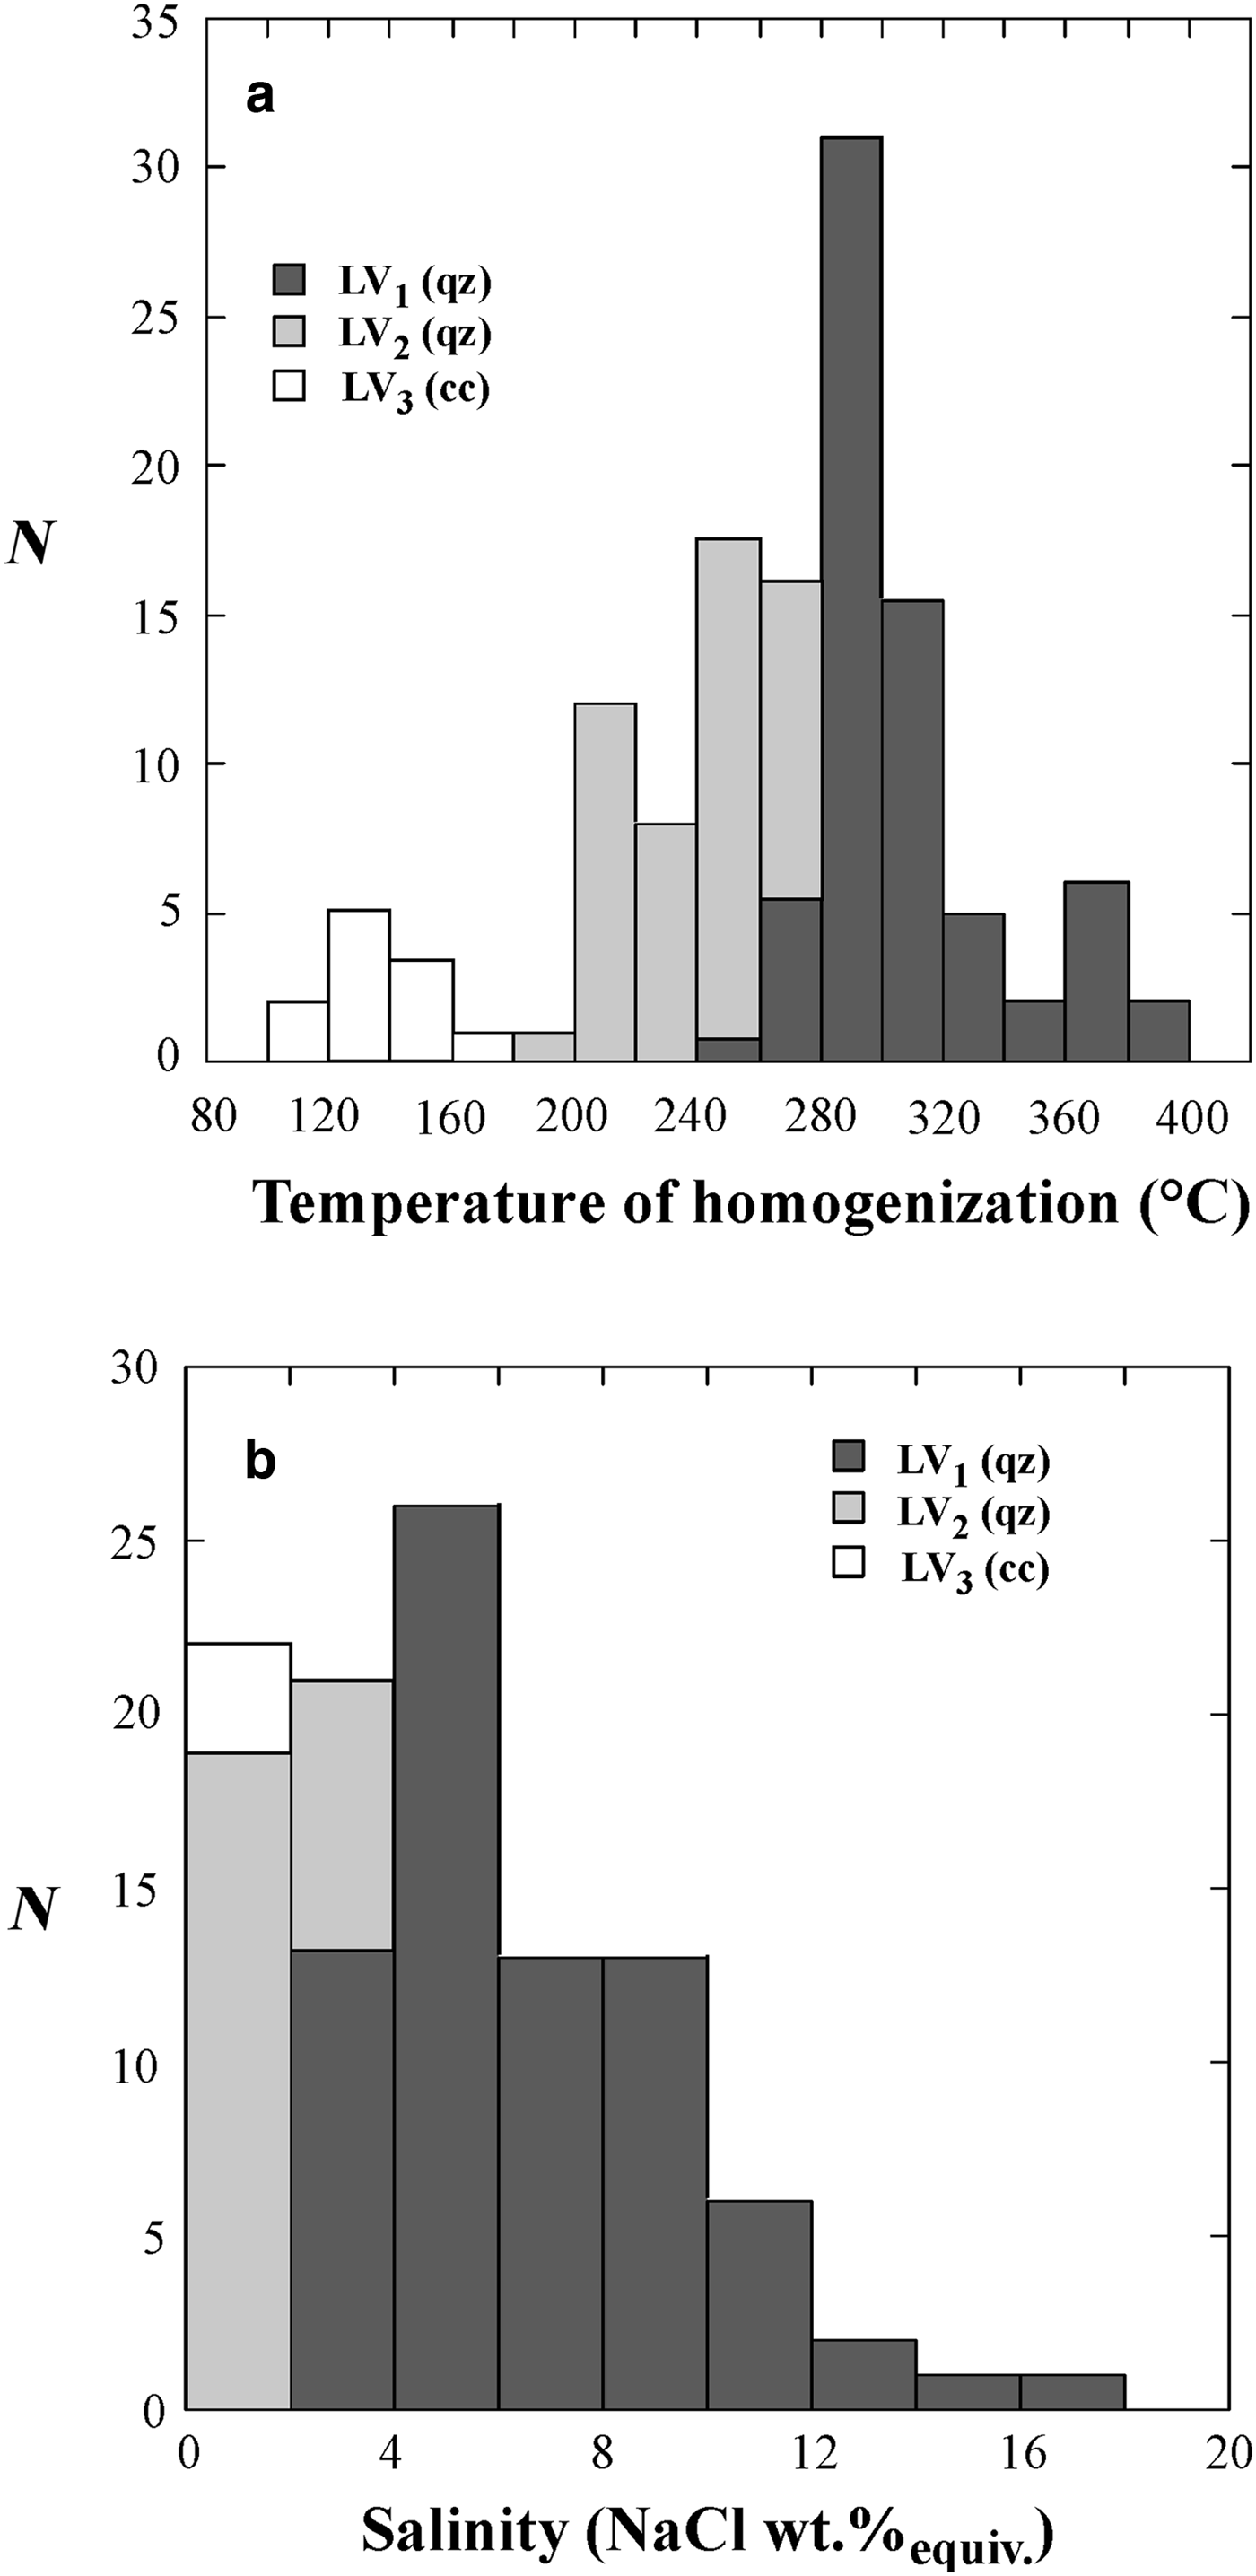
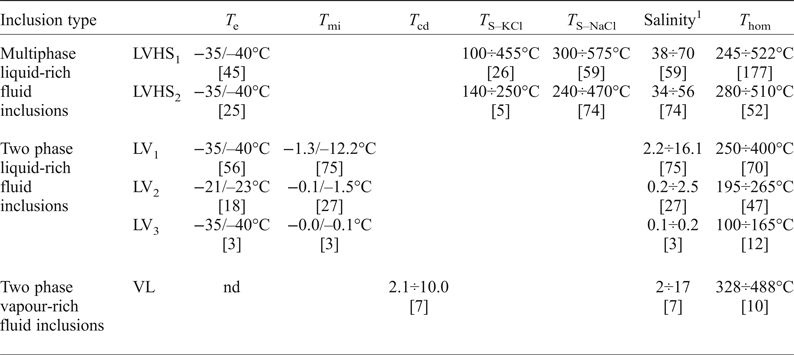
The results of the microthermometric investigation are reported in Figs 5a,b and 6a,b and in Table 2. Freezing runs were performed on both liquid-rich and vapour-rich inclusions. Fluid inclusions freeze to ice upon cooling below –30/–40°C, as clearly observed by the sudden shrinkage of the vapour bubble. During warming, the temperature of initial melting of ice (eutectic temperature, T e) was measured for all three types of inclusions (LVHS, LV and VL). The T e in VL inclusions was difficult to determine because of their low degree of filling. In VL inclusions, clathrate formation was often observed during freezing runs. Clathrates melt between 2°C and 10°C. The T e in LVHS, LV1 and LV3 inclusions is between –35°C and –40°C, suggesting high concentrations of divalent cations (i.e. Ca, Mg and Fe) in addition to Na and K (Crawford, Reference Crawford, Hollister and Crawford1981). LV2 inclusions show a T e of about –21/–23°C, suggesting that NaCl ± KCl are the principal salts in solution.
Histograms of the homogenization temperatures (a) and salinities (b) of LVHS1, LVHS2 and VL fluid inclusions. N = number of measurements.

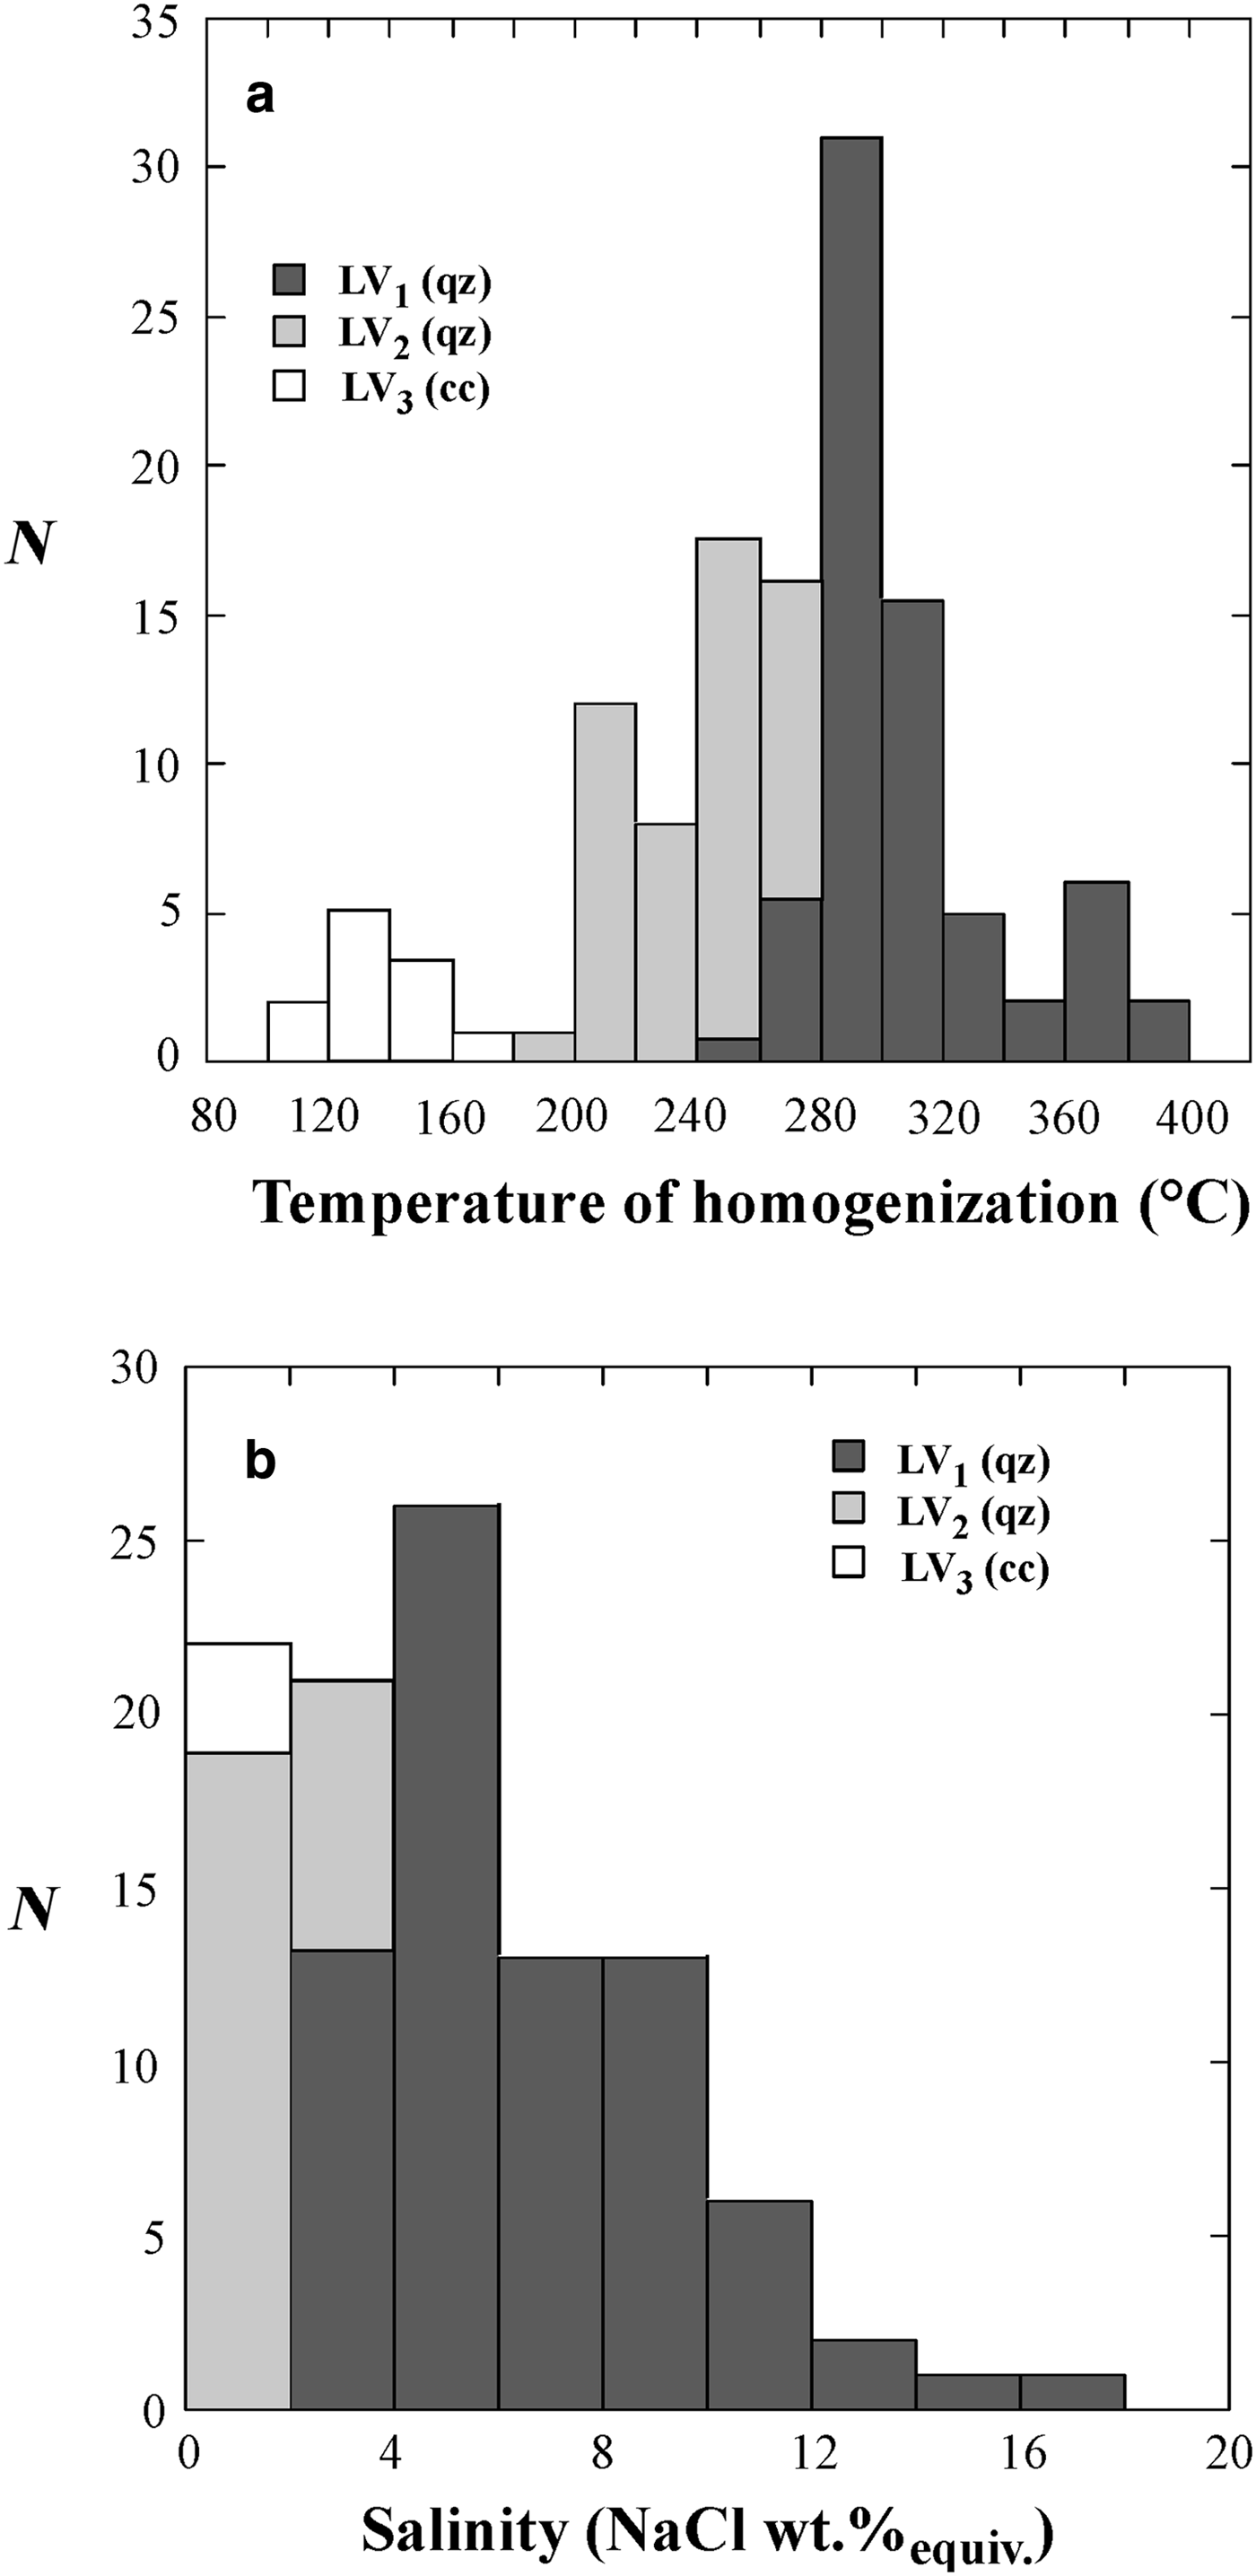
Histograms of the homogenization temperatures (a) and salinities (b) of LV1, LV2 and LV3 fluid inclusions. N = number of measurements.
Summary of fluid-inclusion data.
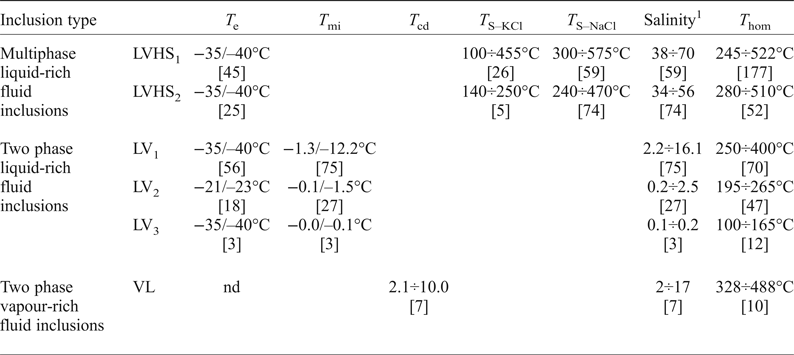
T e = temperature of first ice melting; T s-NaCl = temperature of halite homogenization; T s-KCl = temperature of sylvite homogenization; [n] = number of measurements; T mi = temperature of final ice melting; T hom = temperature of vapour bubble homogenization; T cd = temperature of clathrate dissociation; nd = not determined.
1 Salinity is reported as wt.% NaClequiv.
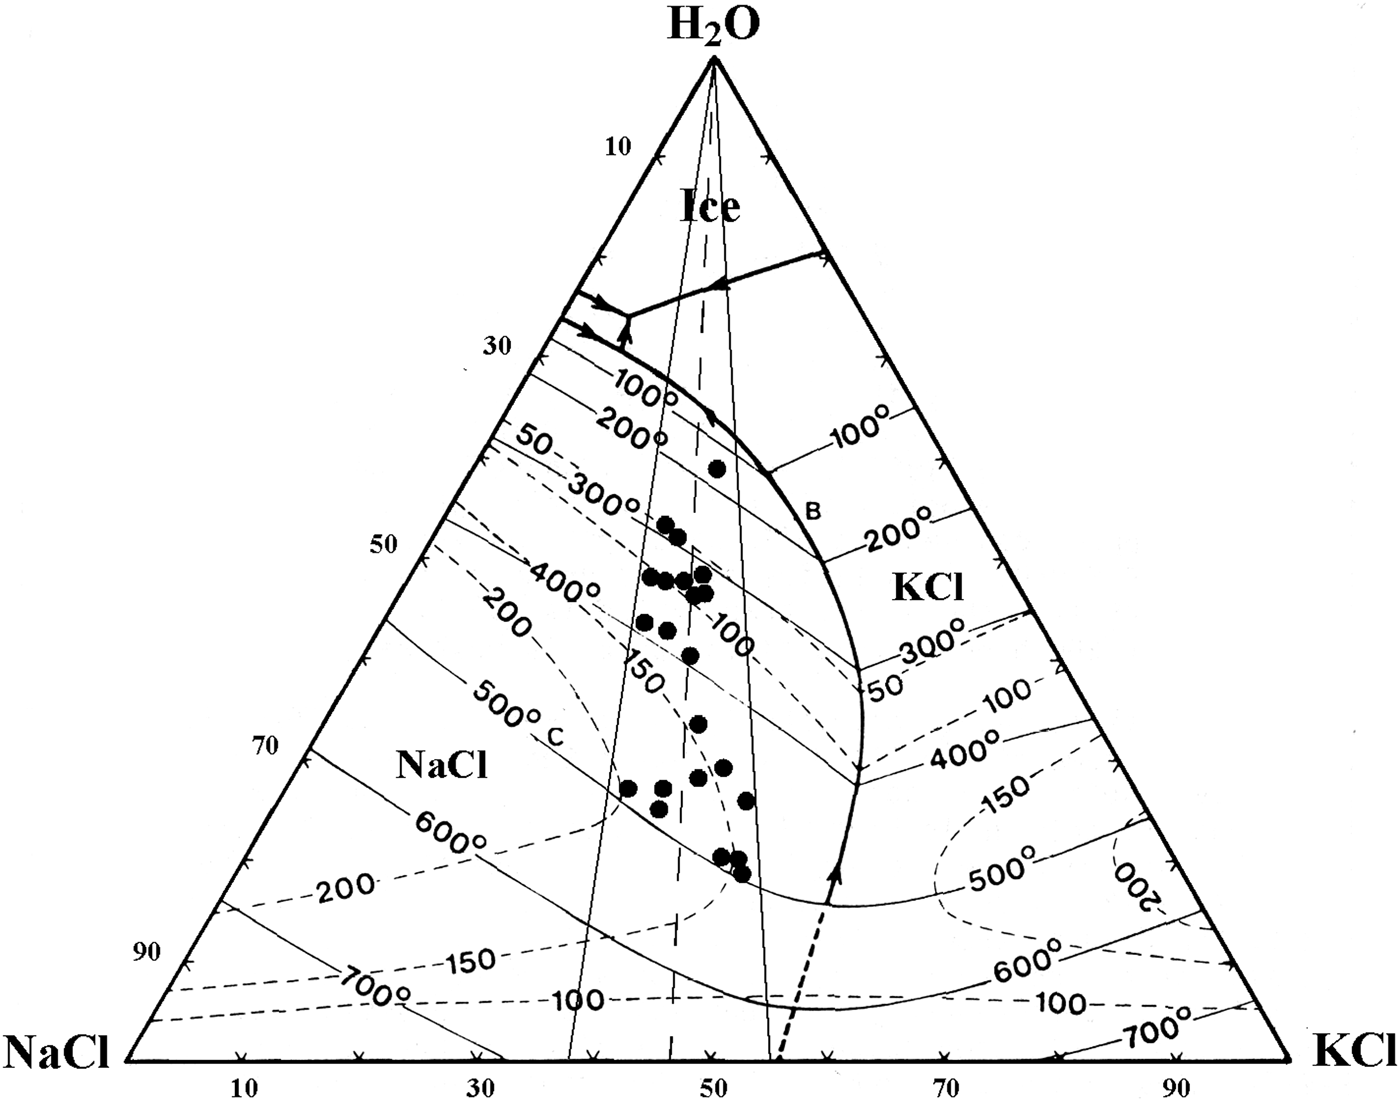
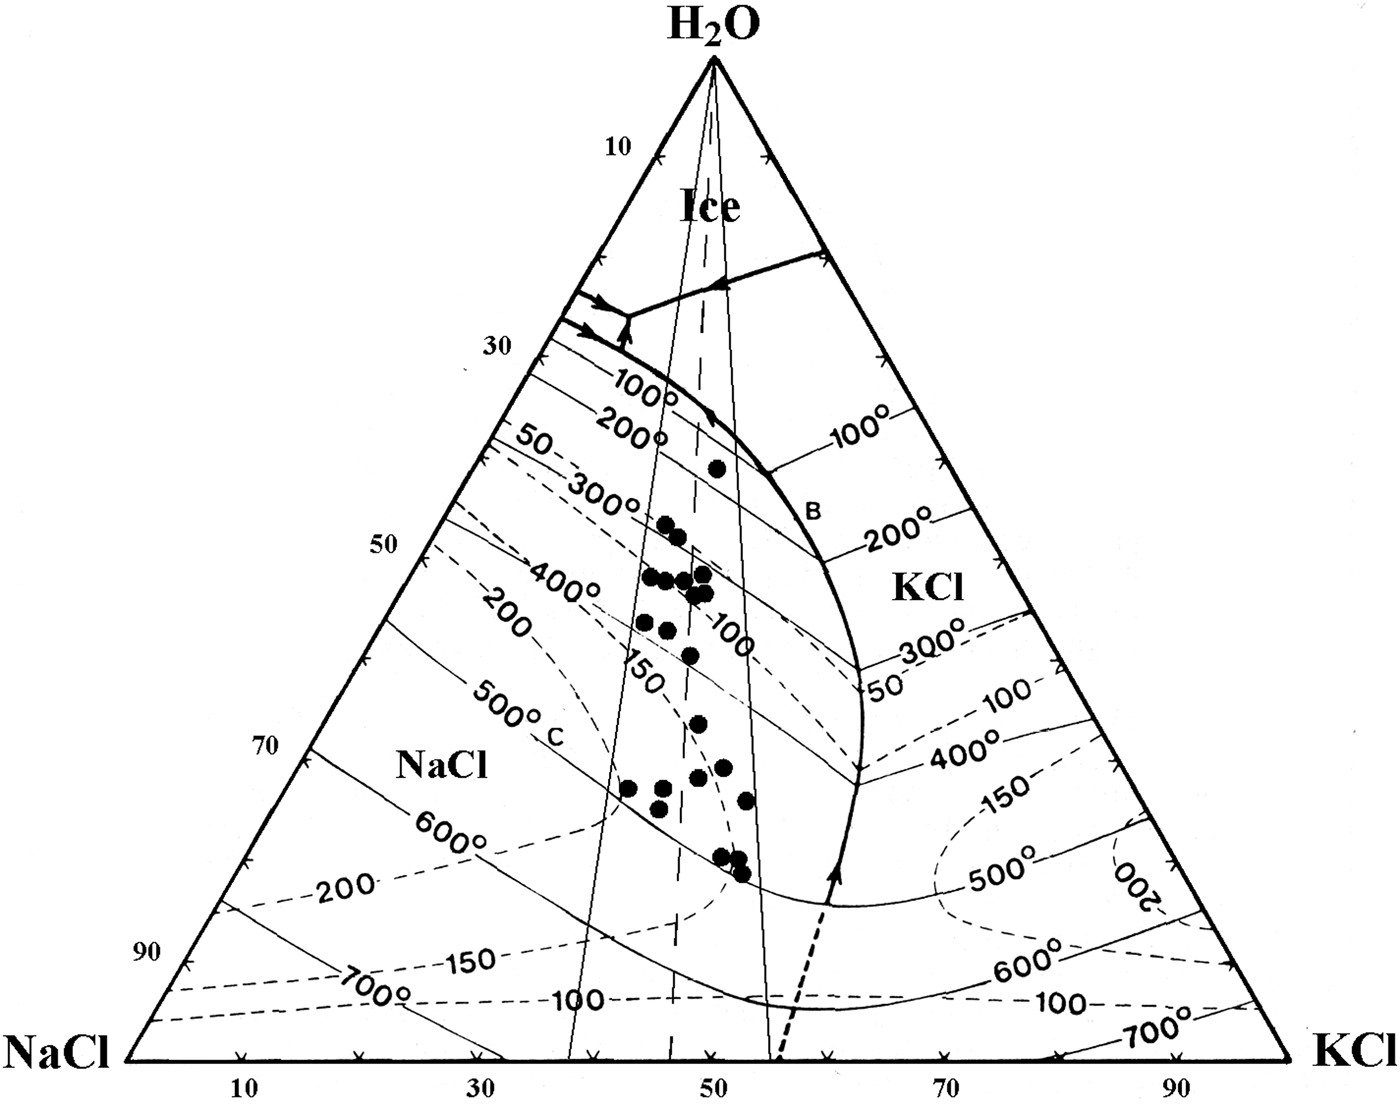
Upon heating, LVHS1 inclusions homogenize mainly by halite dissolution. The vapour bubble homogenizes (T h) between 245°C and 522°C, and the dissolution of halite (T s) occurs between 300°C and 575°C corresponding to salinities of 38–70 wt.% NaClequiv.. The dissolution temperature of sylvite (T s-KCl) ranges from 100°C to 455°C. The composition of LVHS1 fluid inclusions as deduced from halite and sylvite dissolution temperatures, when modelled in the system NaCl–KCl–H2O (Fig. 7), appear to define a linear trend similar in many respects to the ‘halite trend’ of Cloke and Kesler (Reference Cloke and Kesler1979). The slope corresponds to an average K/Na atomic ratio of ~0.72. However, it must be taken into account that this provides a very rough estimate of the composition of the fluid, as it ignores the possible effect of other ions on the solubility of halite and sylvite (Roedder, Reference Roedder1984; Stefanini and Williams-Jones, Reference Stefanini and Williams-Jones1996; Hezarkhani and Williams-Jones, Reference Hezarkhani and Williams-Jones1998).
In LVHS2 inclusions, halite dissolves in the range 240–470°C, corresponding to salinities between 34 and 56 wt.% NaClequiv., whereas the final homogenization occurs by bubble disappearance at T h ranging between 280°C and 510°C. A few data on the dissolution temperature of sylvite have been obtained, showing a range between 140°C and 250°C.
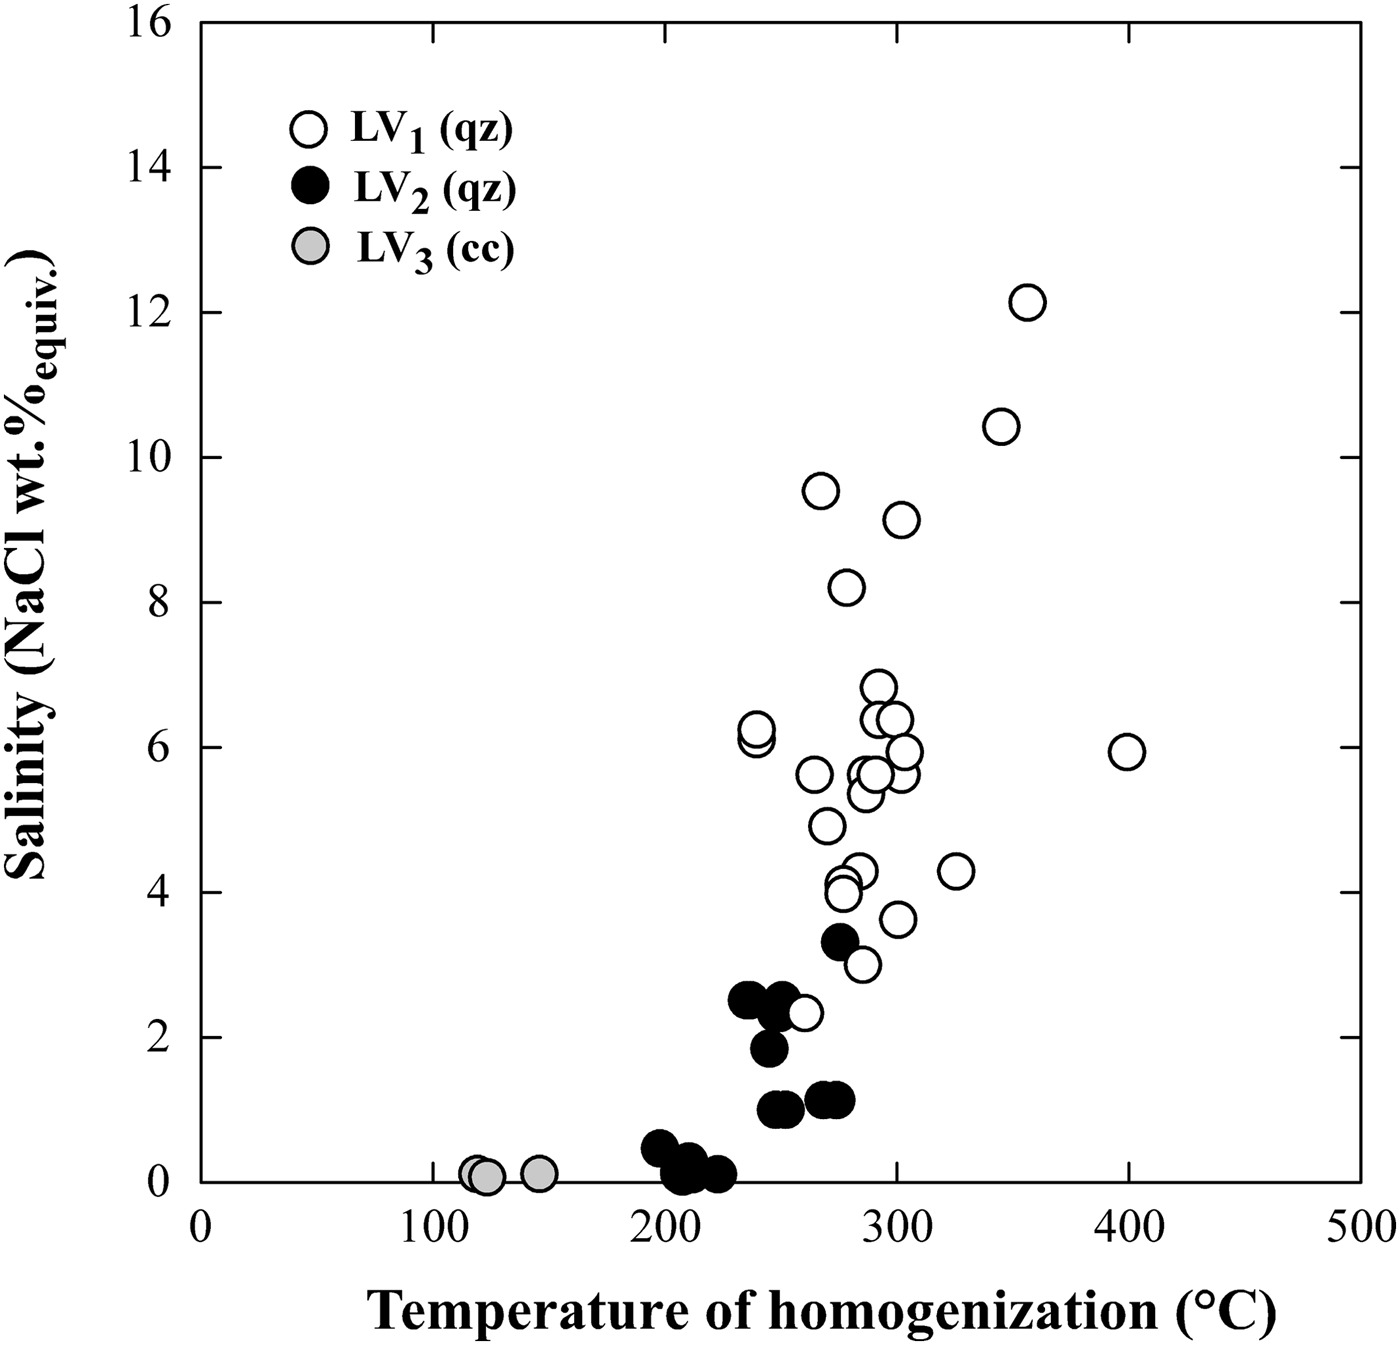
The temperature of final melting of ice (T fmi) in LV1 inclusions ranges from –1.3°C to –12.2°C, corresponding to salinities of 2.2 and 16.1 wt.% NaClequiv. with a mode of ~5 wt.% NaClequiv.. The T h is between 250°C and 400°C with the mode at ~300°C.
In LV2 inclusions, the T fmi value varies from –0.1°C to –1.5°C equating to salinities between 0.2 and 2.5 wt.% NaClequiv. with the mode at 0.5 wt.% NaClequiv.. The vapour bubbles homogenize to liquid between 195°C and 265°C with the mode at ~240°C.
In the supergene calcite samples investigated the LV3 fluid inclusions have T h between 100°C and 165°C with a mode at ~130°C. Unfortunately, few freezing experiments have been done on these latter inclusions because of the problem of stretching and subsequent decrepitation of inclusions. However, the few obtained data indicate low salinity (around 0.1/0.2 wt.% NaClequiv.) of the trapped fluid.
The vapour + liquid, VL, fluid inclusions exhibit T h in the range 328–488°C. These inclusions commonly display clathrate formation during freezing runs. Clathrate melting occurs between + 2°C and + 10°C, corresponding to salinities in the range 2 to 17 wt.% NaClequiv..
Discussion
The petrographic and microthermometric data obtained from the analysis of the different types of fluid inclusions (LVHS, LV and VL) provide a basis for a compositional and thermobarometric characterization of the fluids that circulated in the ‘Botro ai Marmi’ intrusion, from the early to the latest stage of hydrothermal evolution. Several populations of fluid inclusions have been identified in the ‘Botro ai Marmi’ intrusion, providing evidence for several events of fluid entrapment during the late stages of granite crystallization and during its hydrothermal history.
We propose that both fluids represented by LVHS1 and LVHS2 + VL inclusions were mainly orthomagmatic. LVHS1 primary inclusions can be considered as high-salinity fluids generated directly by separation of brine (in this work the term ‘brine’ refers to aqueous fluids having a salinity in excess of 30 wt.% NaClequiv.) from a silicate melt, and textural evidence suggests that the high-salinity brine trapped in these inclusions was the earliest to circulate in the hydrothermal system. It is unlikely that these saline fluids were generated through formation of immiscible aqueous vapour and brine, because of the lack of a coexisting population of vapour-rich inclusions. The homogenization of LVHS1 fluid inclusions by halite dissolution furthermore constrains the inclusion fluid to have been trapped in the liquid-stable, vapour-absent field (Cline and Bodnar, Reference Cline and Bodnar1994). This indicates that these dense brines, at the time of trapping, did not coexist at equilibrium with a low-density (vapour) fluid phase. The conclusion that LVHS1 fluid inclusions represent a brine exsolved directly from magma is also based on the fact that their compositions delineate a so-called halite trend on a NaCl–KCl–H2O diagram (Fig. 7), similar to those reported for other magmatic-hydrothermal systems (Eastoe, Reference Eastoe1978; Ahmad and Rose, Reference Ahmad and Rose1980; Wilson et al., Reference Wilson, Kesler, Cloke and Kelly1980; Quan et al., Reference Quan, Cloke and Kesler1987; Stefanini and Williams-Jones, Reference Stefanini and Williams-Jones1996; Hezarkhani and Williams-Jones, Reference Hezarkhani and Williams-Jones1998). These trends have been interpreted by Cloke and Kesler (Reference Cloke and Kesler1979) as being due to early saturation of the fluid with halite and subsequent trapping of the fluid over an interval of cooling.
NaCl–KCl–H2O phase diagram showing the compositions of LVHS1 fluid inclusions determined from the dissolution temperature of halite and sylvite. Phase diagram drawn after Roedder (Reference Roedder1984).
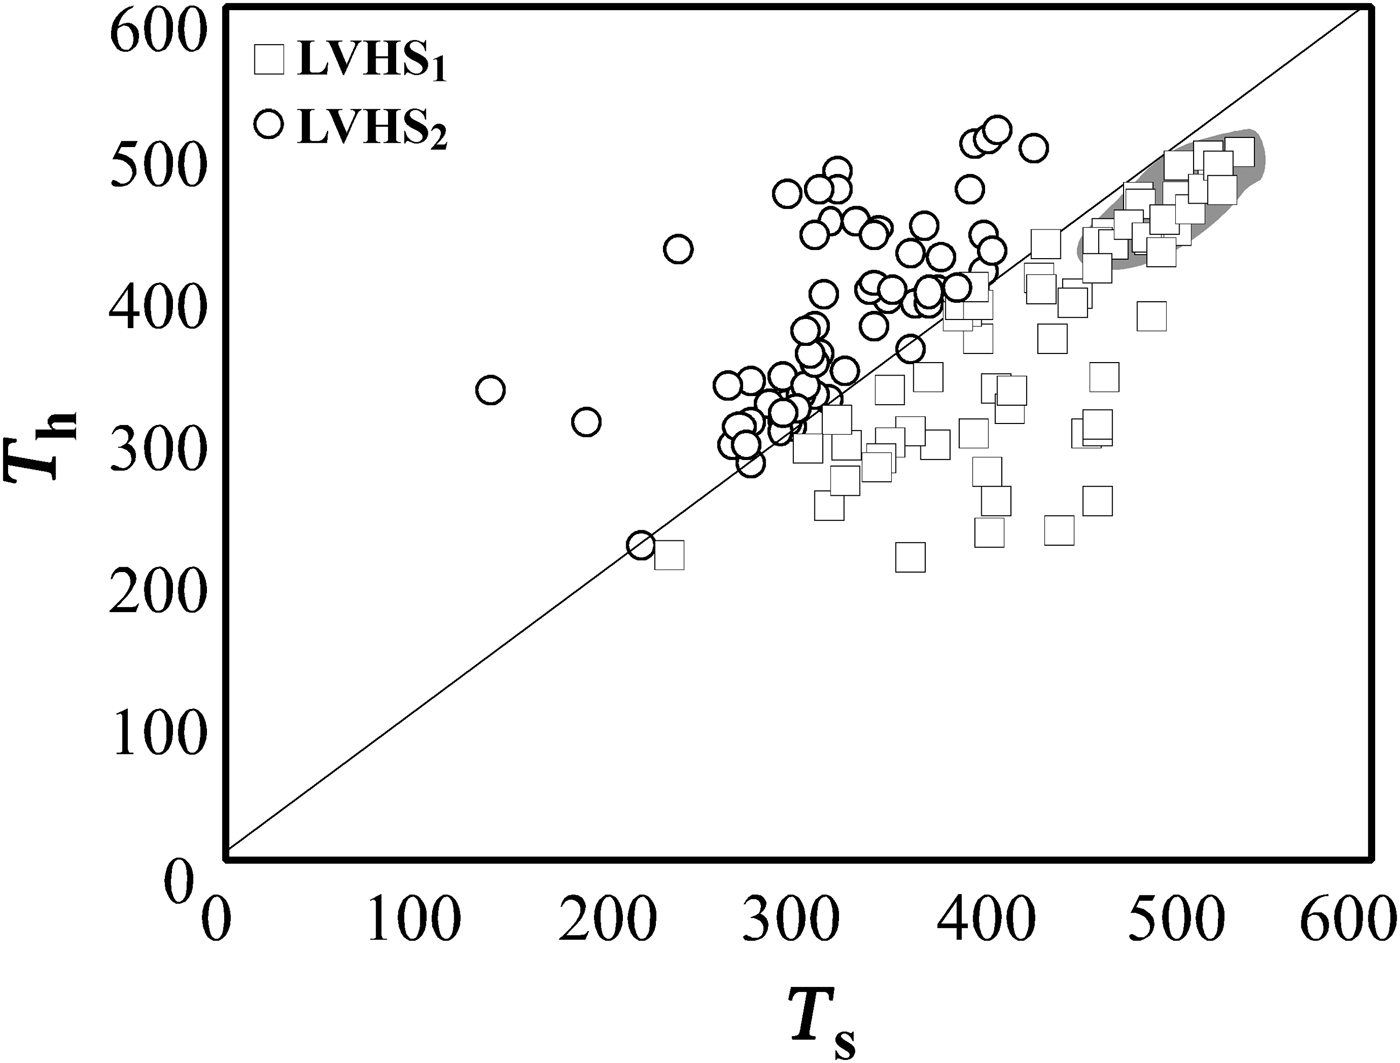
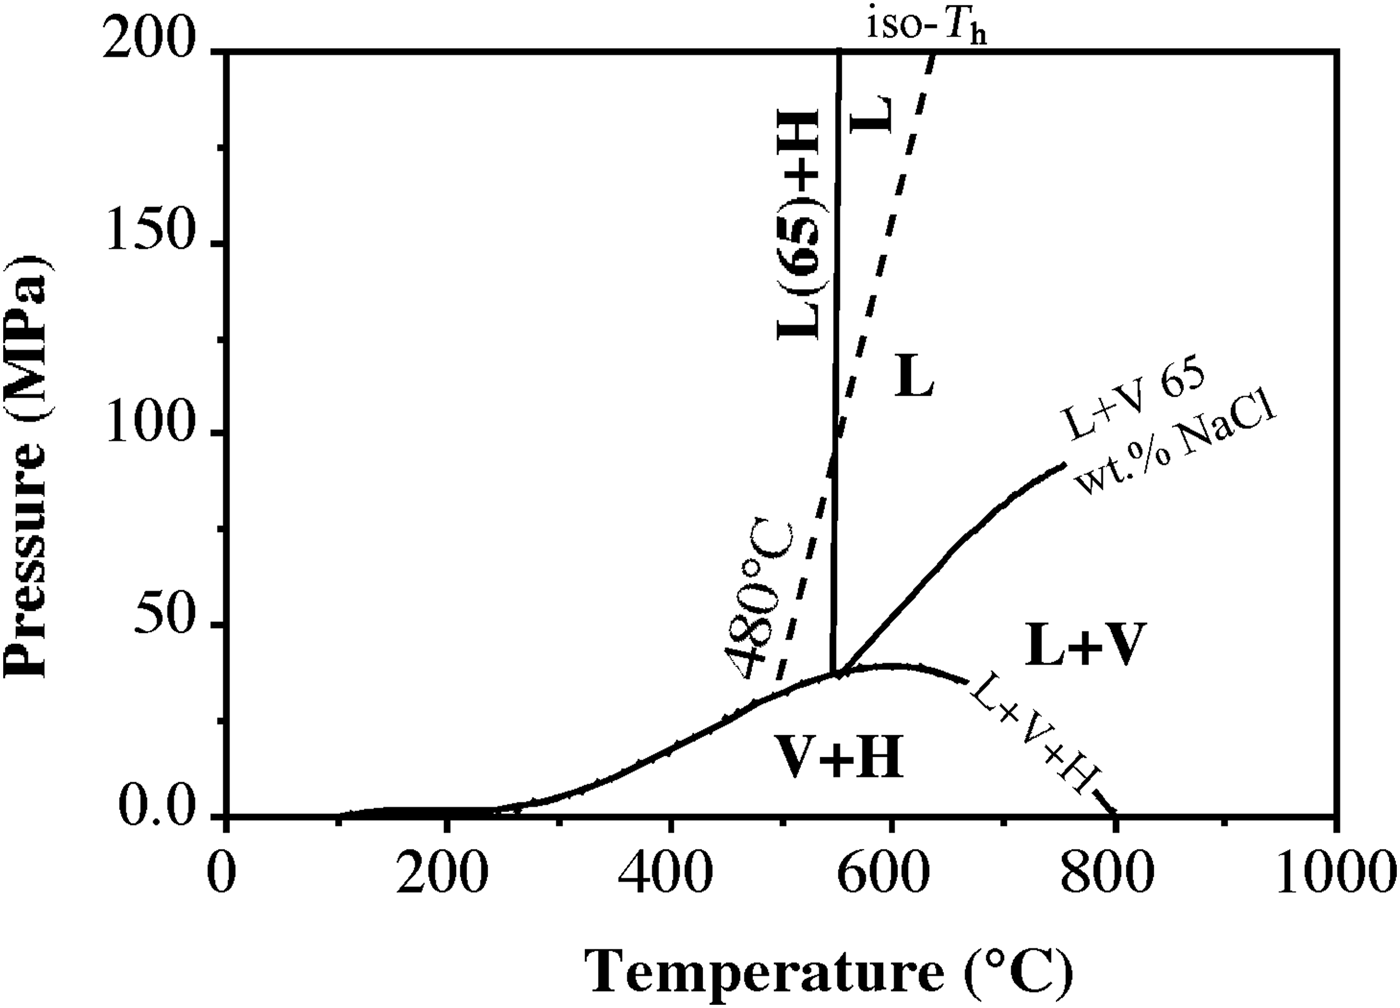
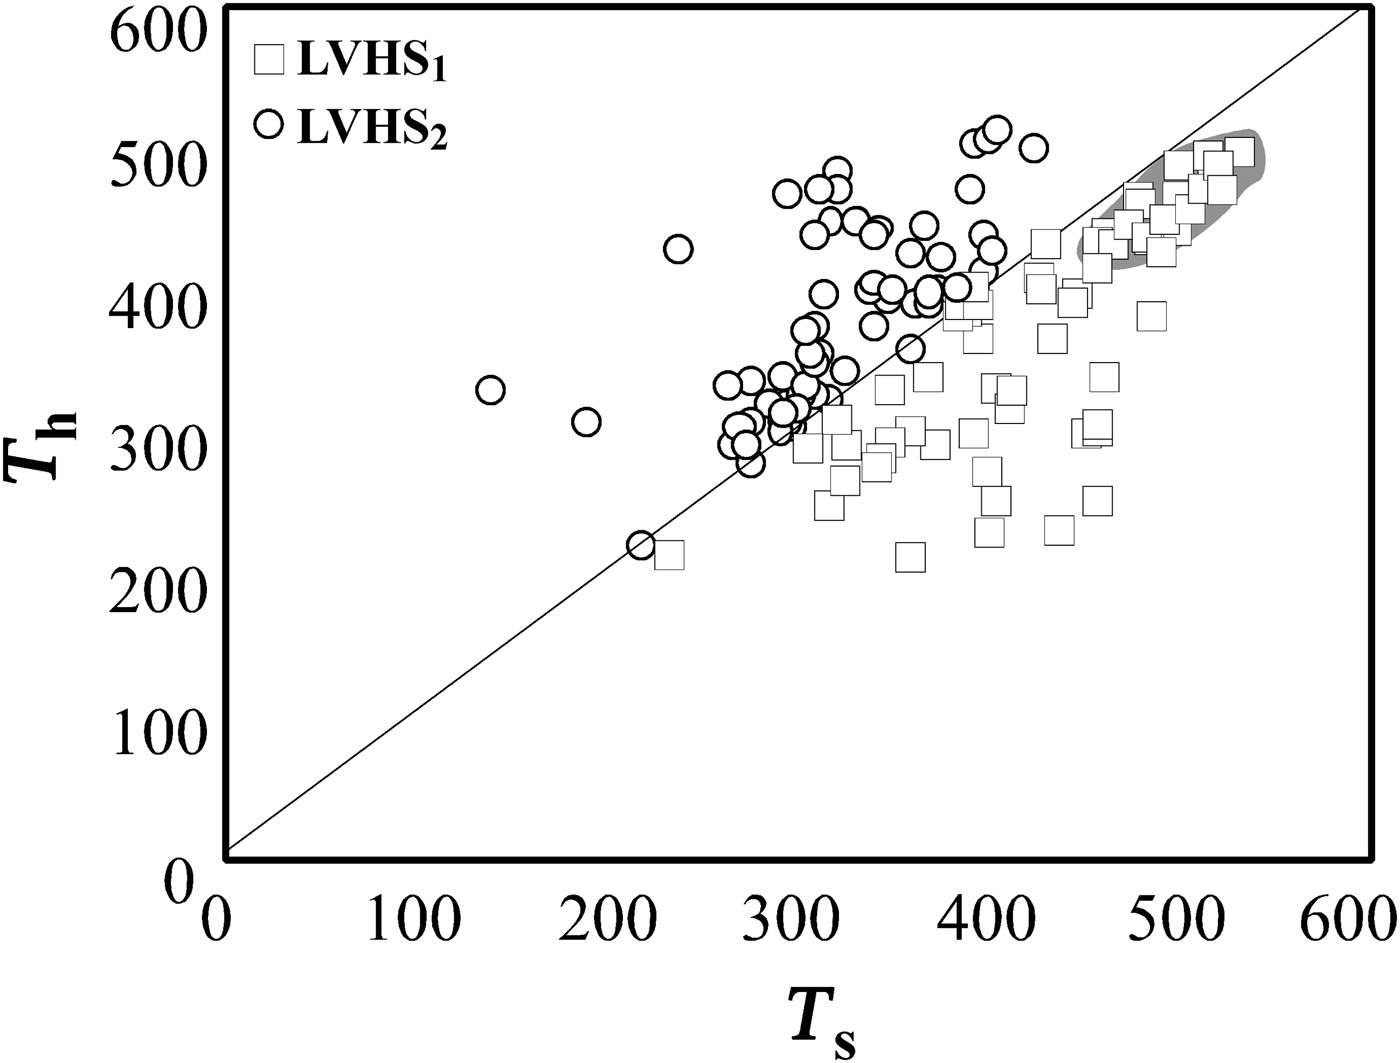
To interpret trapping conditions for these inclusions, a dense cluster of data points, representing high-salinity and high-temperature fluids (average T h = 480°C and T s = 540°C equating to salinity of 65 wt.% NaClequiv.), has been selected for a detailed analysis (Fig. 8). If these inclusions are modelled by the system NaCl–H2O, the halite dissolution temperatures can be used to estimate minimum temperature and pressure of entrapment. The slopes of halite liquidus and the iso-T h line were determined by extrapolating the data of Bodnar (Reference Bodnar1994). The iso-T h line intersects the liquidus [L(65)+H] at a temperature of 540°C and a pressure of ~90 MPa (Fig. 9). The same pressure (~90 MPa) has also been calculated using the Microsoft Excel spreadsheet HOKIEFLINCS-H2O-NACL (Steele-MacInnis et al., Reference Steele-MacInnis, Lecumberri-Sanchez and Bodnar2012), which incorporates the new data of Becker et al. (Reference Becker, Fall and Bodnar2008) and the equations of Lecumberri-Sanchez et al. (Reference Lecumberri-Sanchez, Steele-MacInnis and Bodnar2012). This value of pressure corresponds to a depth of ~3 km, assuming that the pressure is lithostatic (see below). These data are in good agreement with the temperature and pressure estimation reported by Barberi et al. (Reference Barberi, Innocenti and Mazzuoli1967) and Rocchi et al. (Reference Rocchi, Dini, Mazzarini and Poli2003). We assume that the high-salinity and high-temperature magmatic fluid, trapped in LVHS1 fluid inclusions, circulated in the ‘Botro ai Marmi’ hydrothermal system under lithostatic pressure conditions because, as indicated by Fournier (Reference Fournier1991, Reference Fournier1999), intrusions of magmatic bodies at relatively shallow depth (2–6 km) commonly result in a large volume of rocks attaining temperatures sufficiently hot (>400°C) to behave in a plastic manner. At these conditions, the least principal stress is the lithostatic load and the fluids exsolved from crystallizing magma typically accumulate at lithostatic pressure, and are not directly connected with the, eventually present, overlying meteoric-dominated fluid reservoirs. Similar characteristics are also found in other intrusive complexes of southern Tuscany such as Larderello and Elba Island (Cathelineau et al., Reference Cathelineau, Marignac, Boiron, Gianelli and Puxeddu1994; Rossetti and Tecce, Reference Rossetti and Tecce2008; Dini et al., Reference Dini, Mazzarini, Musumeci and Rocchi2008; Fulignati, Reference Fulignati2017).
Liquid-vapour homogenization temperature (T h) vs. halite dissolution temperature (T s) for LVHS fluid inclusions. The grey area is traced to identify the densest cluster, which is assumed to represent best the fluid trapped in LVHS1 fluid inclusions.
Temperature-pressure diagram of part of the NaCl–H2O system, illustrating trapping conditions for the dense cluster of data points (see Fig. 8) representing LVHS1 fluid inclusions that exhibit average liquid-vapour homogenization at 500°C and that undergo final homogenization by halite dissolution at ~540°C corresponding to a salinity of 65 wt.% NaClequiv.. The diagram shows the liquid + vapour + NaCl curve (L + V + H), the liquid + vapour curve (L + V) and corresponding liquidus (L + H) for 65 wt.% NaClequiv.. The dashed line represents a constant liquid-vapour homogenization temperature (iso-T h, see Bodnar, Reference Bodnar1994) for LVHS1 fluid inclusions, which extends from the L + V + H curve at 500°C (representing the average T h value of the densest cluster of data points in Fig. 8). The intersection of the iso-T h and the [L(65) + H] liquidus defines the minimum trapping pressure and temperature for the fluid in LVHS1 fluid inclusions (~90 MPa and 540°C).

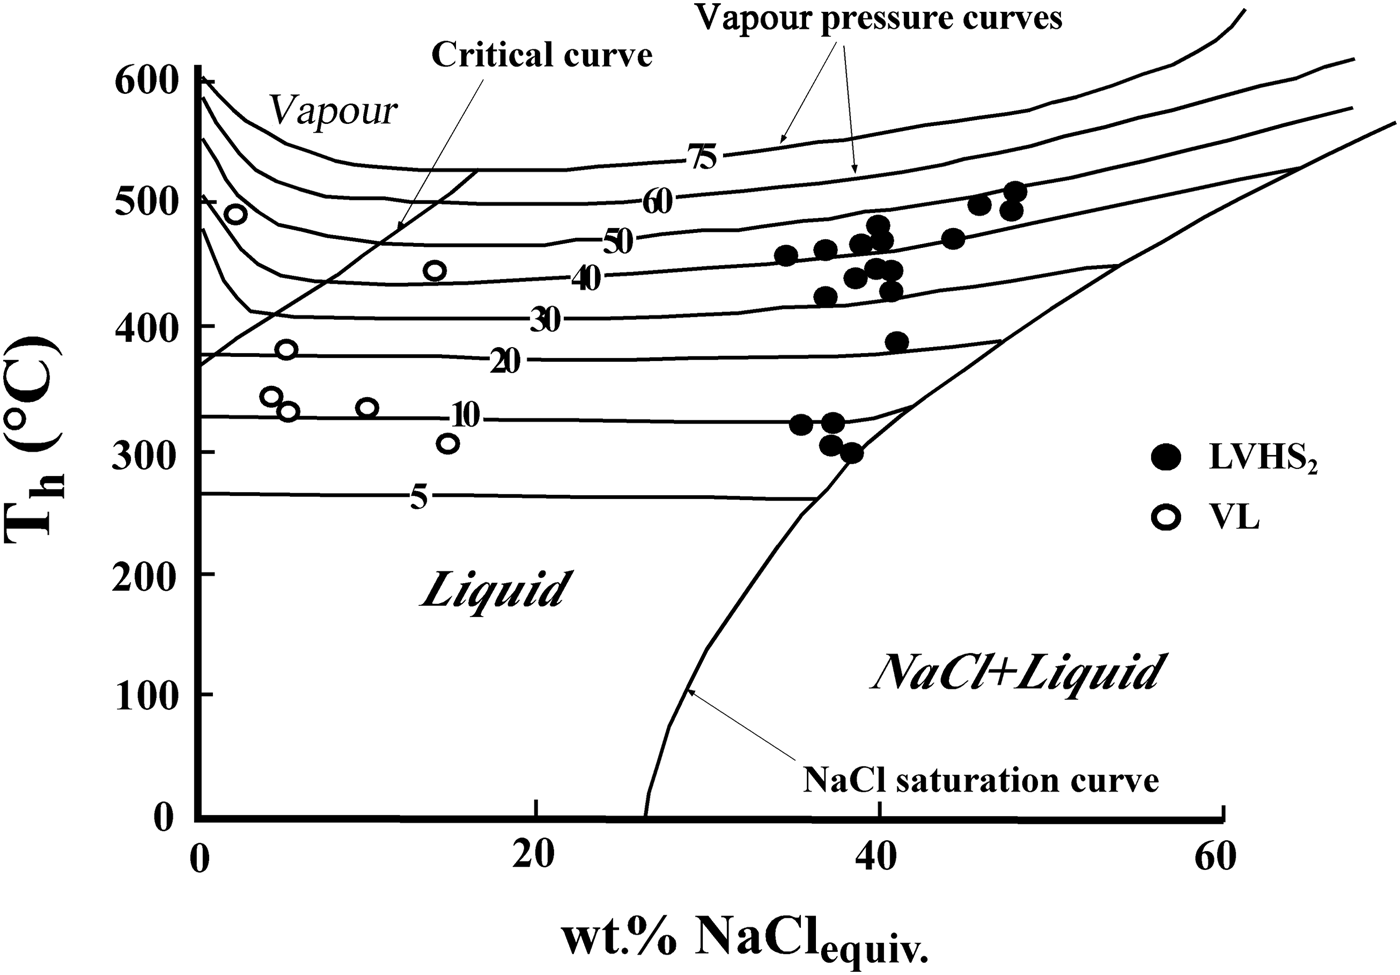
The LVHS2 and VL inclusions are commonly associated spatially and can be interpreted as resulting from the formation of immiscible low-density aqueous vapour and high-density brine following an unmixing process (a sort of ‘boiling’). These inclusions postdate the LVHS1 population. As these fluid inclusions are representative of an unmixed fluid, the T h of the inclusions corresponds to the real fluid-trapping temperature, which ranges from ~500°C to 300°C. These temperature conditions are near the ductile to brittle transition of rocks rich in quartz and feldspar, where magmatic fluids are most likely to change from lithostatic to hydrostatic pressure (Fournier, Reference Fournier1999; Landtwing et al., Reference Landtwing, Pettke, Halter, Heinrich, Redmond, Einaudi and Kunze2005). On the basis of data of Chou (Reference Chou1987) for the NaCl–H2O system, we can estimate the pressure of entrapment (Fig. 10), which varies between 50 and 10 MPa. We conclude that LVHS2 and VL fluid inclusions record a later stage in the evolution of the ‘Botro ai Marmi’ magmatic-hydrothermal system than that of LVHS1 fluid inclusions. In this stage, the conditions were closer to hydrostatic; orthomagmatic fluid was released into new fractures and therefore expanded to lower pressure so that phase separation occurred. This stage probably also marks the initial inflow of external (meteoric) fluids in the system with subsequent mixing with orthomagmatic fluids. These features are compatible with the evolving fluid regime (from dominantly lithostatic to hydrostatic pressure conditions) and rheological environment (from ductile to brittle) expected in cooling magmatic–hydrothermal systems (Fournier, Reference Fournier1999). We assume LVHS inclusions as representative of the fluids involved in the genesis of potassic alteration.
Liquid-vapour homogenization temperature vs. salinity of LVHS2 and VL fluid inclusions plotted on a polybaric temperature-salinity projection of the system NaCl–H2O. The halite saturation curve, critical curve and vapour pressure curves are after Chou (Reference Chou1987).

Secondary LV1 and LV2 fluid inclusions record a mainly meteoric water-dominated hydrothermal system stage at 240°C–310°C and are responsible for the propylitic alteration that characterizes the veins cross-cutting the intrusion. The general decrease in salinity from 16 down to <1 wt.% NaClequiv. in LV1 and LV2 fluid inclusions and the corresponding decrease in homogenization temperature (Fig. 11) suggest that meteoric water may have undergone mixing with late magmatic fluids to variable degrees. This meteoric water-dominated stage can be assimilated with the development of a typical palaeo-geothermal system in the area, which can be assumed to be similar to some extent to the active high-enthalpy geothermal system of Larderello, extensively exploited for power production, located only a few km east of the ‘Botro ai Marmi’ intrusion. Several geothermal investigations have revealed a complex evolution of the fluids that circulated in the subsoil of the Larderello geothermal system, from an early stage, dominated by magmatic and thermometamorphic fluids, associated with the emplacement of granitic intrusions, to the present-day fluids prevalently of meteoric origin (Valori et al., Reference Valori, Cathelineau and Marignac1992; Cathelineau et al., Reference Cathelineau, Marignac, Boiron, Gianelli and Puxeddu1994; Ruggieri et al., Reference Ruggieri, Cathelineau, Boiron and Marignac1999; Ruggieri and Gianelli, Reference Ruggieri and Gianelli1999; Boyce et al., Reference Boyce, Fulignati and Sbrana2003; Fulignati, Reference Fulignati2017), which is very similar to what we observed in this study on hydrothermal fluid circulation associated with the ‘Botro ai Marmi’ intrusion. Consequently, the fossil hydrothermal system of ‘Botro ai Marmi’ may therefore be envisaged as an exposed proxy of the active Larderello geothermal system.
Plot of homogenization temperature vs. salinity of LV1, LV2 and LV3 fluid inclusions.
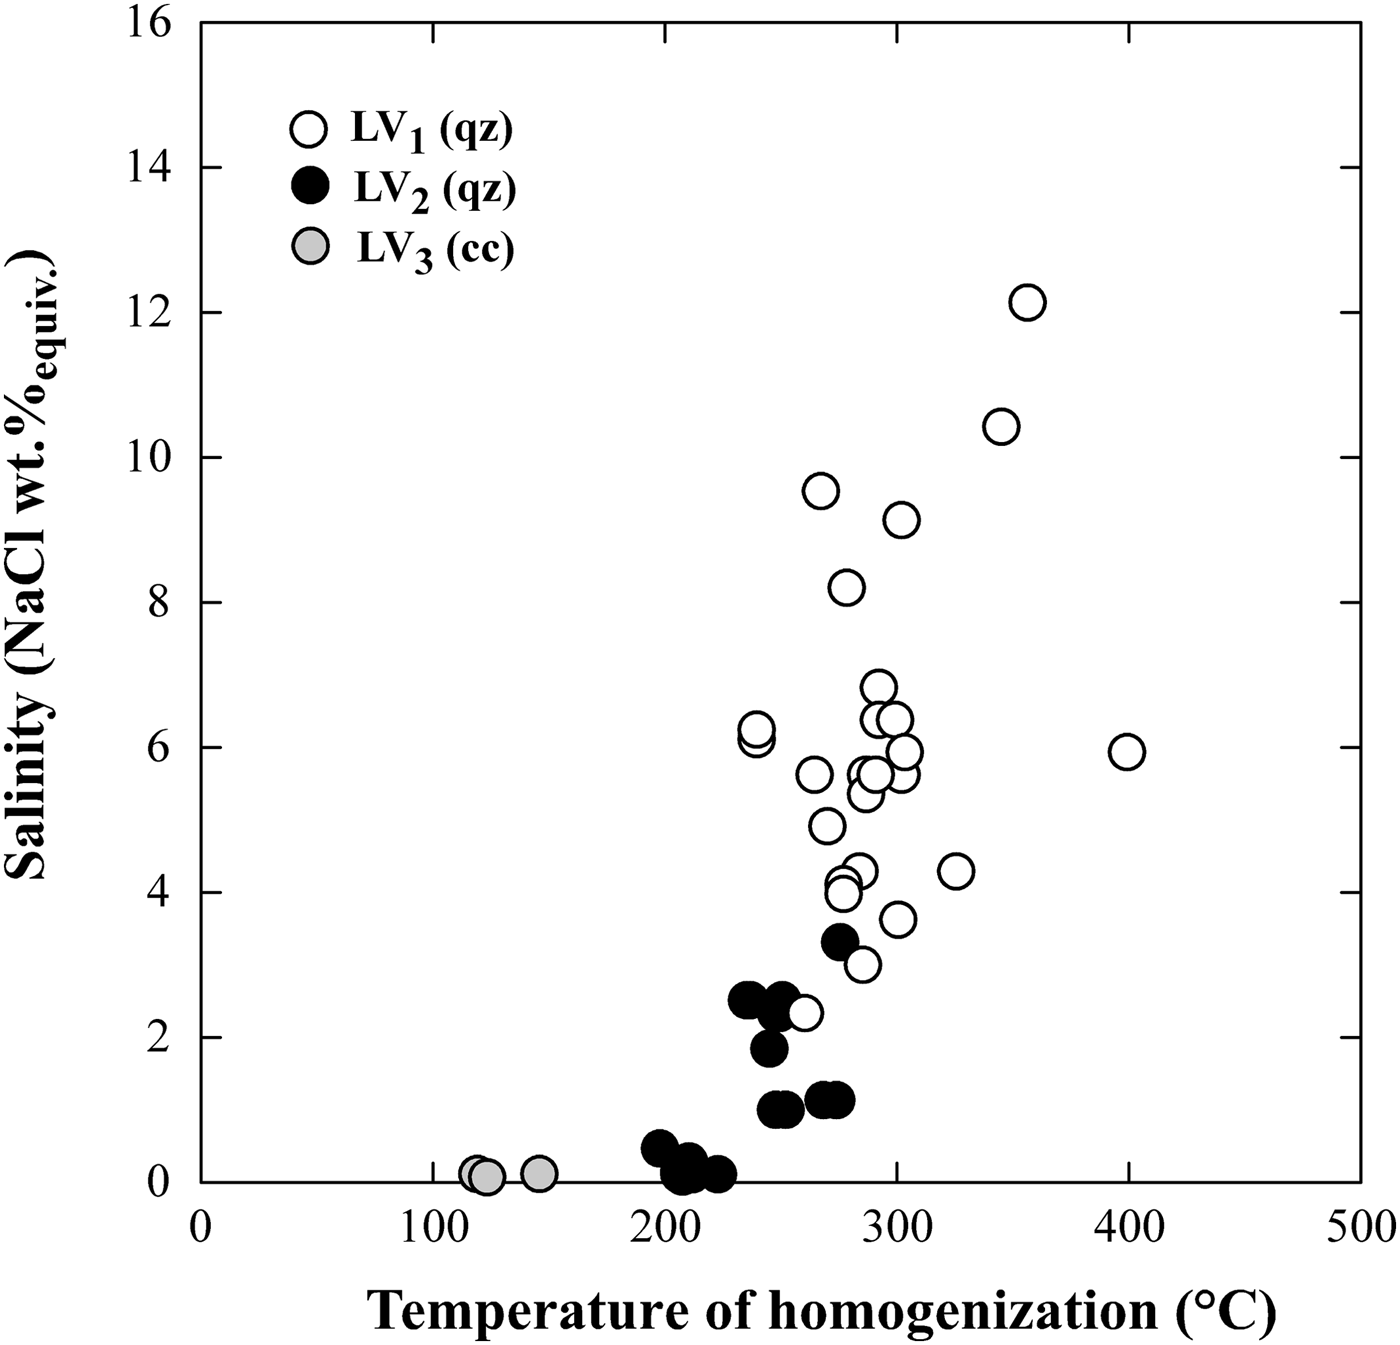
Inclusions of LV3 type in supergene calcite record the latest and relatively low-temperature stage (100–160°C) of the hydrothermal system linked to the ‘Botro ai Marmi’ intrusion.
Concluding remarks
A fluid-inclusion investigation in the ‘Botro ai Marmi’ intrusion has provided evidence on the history of the evolution of the hydrothermal fluids that circulated in the quartz-monzonitic body and its surroundings.
(1) The earliest high-salinity and high-temperature fluids to circulate in the ‘Botro ai Marmi’ intrusion are interpreted to have been derived by direct exsolution of a high-density phase (brine) from the crystallizing magma (LVHS1 inclusions). This fluid circulated in the intrusion under lithostatic conditions.
(2) The occurrence of LVHS2 and VL fluid-inclusion populations marks the transition to an intermediate evolutionary stage of the magmatic–hydrothermal system, in which we have the development of a system with progressively more open fractures and the transition from lithostatic- (>90 MPa) to hydrostatic-dominated conditions (50 to 10 MPa). These fluid inclusions are also interpreted to represent an orthomagmatic fluid that unmixed in a high-salinity brine and in a low-salinity vapour aqueous phase. However, part of these fluids, which circulated at a lower temperature than that represented by LVHS1 inclusions, may have begun to mix and dilute with meteorically derived external fluids. The fluids represented by LVHS1 and LVHS2 inclusions were responsible for the potassic alteration facies.
(3) At a later stage of the hydrothermal evolution, abundant meteoric-dominated external fluids entered the system along a network of fractures. These fluids are recorded by two-phase low-salinity LV1 and LV2 fluid inclusions that are associated with the development of propylitic alteration. This event marks the transition from a magmatic–hydrothermal system to a typical hydrothermal (‘geothermal’) system, probably similar to the nearby active high-enthalpy geothermal system of Larderello.
(4) As testified by LV3 fluid inclusions, the latest stage of the ‘Botro ai Marmi’ hydrothermal system is represented by the circulation of low-temperature and low-salinity meteoric water-dominated fluids, which are the probably mineralizing agents that produced the iron-oxide-hydroxide-bearing deposits.
Acknowledgements
Prof Richard Henley is acknowledged for his constructive review of the manuscript. Also thanked is an anonymous Editorial Board Member of the Journal whose suggestions helped to improve the clarity of the manuscript. This research was supported by a University of Pisa grant PRA 2016 to Chiara Montomoli.