1 Introduction
1.1 Motivation for the present study
This paper investigates the timing pattern of the Low and High tonal targets which constitute the phrase-initial pitch rise in the LHLH intonational pattern of Seoul Korean. The central question is whether tones are timed with respect to segmental materials, independently of each other, or timed with respect to other tones. The first approach is known as the segmental anchoring hypothesis (Ladd et al. Reference Ladd, Dan, Hanneke and Astrid1999). In this approach, pitch movements are analysed into L and H targets, which are aligned with respect to certain segmental landmarks. The timing of F0 turning points closely follows the timing of their respective segmental anchors, so that the L and H targets comprising a rising movement are independent of each other. This hypothesis predicts that the duration of the rise should vary, depending on the duration of the associated segmental material. The second approach to tonal timing hypothesises that the targets can be timed with respect to each other, rather than being aligned to the segmental string. It has been observed that there are cases where the duration of a rising pitch movement remains relatively stable. In the English L*+H- bitonal pitch accent, the H target occurs at a fixed time interval after L*, regardless of the segmental characteristics of the materials following the accented syllable (Pierrehumbert Reference Pierrehumbert1980: 77–80). The hypothesis that a rising movement has a certain fixed duration will be referred to as the constant duration hypothesis in this paper.
Many previous studies have supported the segmental anchoring hypothesis over the constant duration hypothesis. However, the strong preference for segmental alignment might have been due to the phonological status of tones in the languages studied. Most of the previous literature on tone alignment has studied only tones or pitch accents whose phonological association is specified at the word level, rather than at the phrase level, for example lexically contrastive tones (e.g. Japanese (Ishihara Reference Ishihara, Solé, Recasens and Romero2003) and Mandarin (Xu Reference Xu1998, Reference Xu1999)) or prominence-lending pitch accents (e.g. English (Ladd et al. Reference Ladd, Dan, Hanneke and Astrid1999)), as opposed to boundary tones. In English, pitch accent is assigned at the level of the phrase, but its phonological association is specified at the word level, i.e. the stressed syllable in the prominent word (Pierrehumbert Reference Pierrehumbert1980). One can reasonably hypothesise that tone–segment association will be stronger if the location of the tone is specified at the word level, for perceptual or functional reasons. On the other hand, if a tone is assigned at the phrase level, the requirement for it to align with a particular segment/syllable is weaker compared to a lexically specified tone.
It may thus be possible to observe effects of constant duration more easily if we examine tones or pitch accents whose phonological association is specified at the phrase level, rather than at the word level. In Seoul Korean, only phrase-boundary tones exist, and the tonal pattern of an accentual phrase is not affected by the particular lexical items that comprise the phrase (Jun Reference Jun2002, Reference Jun2005a: 1, Reference Jun2005b: 203).Footnote 1 The alignment of phrase-initial tones in Seoul Korean might thus be expected to be less strictly anchored. In fact, it has been shown that the phrase-initial rise peak (the H in phrase-initial LH) is ‘loosely’ associated with the second syllable (Jun Reference Jun1996), so it can be variably realised on the second or third syllable if the phrase is longer than four syllables (Lee & Kim Reference Lee and Kim1997). For these reasons, this paper examines the alignment of tonal targets that constitute the phrase-initial rise of the Seoul Korean Accentual Phrase, as a function of speech rate. In the next section, we lay out the two hypotheses on tonal timing that will be tested here.
1.2 Competing hypotheses
1.2.1 Segmental anchoring
In his study of F0 movements in Swedish, Bruce (Reference Bruce1977) argues that F0 contours are most appropriately analysed as a sequence of local minima and maxima: ‘reaching a certain pitch level at a particular point in time is the important thing, not the movement (rise or fall) itself’ (Bruce Reference Bruce1977: 132). That is, phonologically significant F0 events such as F0 minima and F0 maxima are aligned with respect to segmental landmarks such as the beginning and the end of the accented vowel. This view is supported in the segmental alignment literature. Arvaniti & Ladd (Reference Arvaniti, Ladd, Elenius and Branderud1995) and Arvaniti et al. (Reference Arvaniti, Ladd and Mennen1998) observed that the H peaks of the prenuclear rising pitch accent in Greek were stably aligned with regard to segments. Arvaniti et al. (Reference Arvaniti, Ladd and Mennen1998) varied the duration of accented syllables (e.g. long [paˈɾemvasi] ‘intervention’ vs. short [ɣlikoˈlemona] ‘limes’), and measured the duration from L to H and from the onset of the post-accentual vowel to the H peak. As a result the duration of the rise is correlated with the duration of the accented syllable, but the interval from the onset of the post-accentual vowel to the H peak is unaffected by segment duration.
This result has been replicated in subsequent experimental work. Ladd et al. (Reference Ladd, Dan, Hanneke and Astrid1999) examined the alignment of F0 minima and maxima in Standard Southern British English under changes in speech rate: fast, normal and slow. A prediction of strict segmental anchoring is that the duration of a rise is expected to change depending on speech rate, while segmental alignment remains relatively stable. As predicted by segmental anchoring, the duration of the rising movement decreased as speech rate increased. The magnitude of the rise was not significantly affected by speech rate (except for two out of six speakers), which means that the slope of the rise becomes steeper at faster speech rates. Segmental anchoring also implies that the difference between the time of the anchor and the time of the associated F0 event should not be affected by changes in speech rate. Ladd et al. (Reference Ladd, Dan, Hanneke and Astrid1999) used this criterion to identify the segmental anchors for the F0 minimum and maximum as the onset of the stressed syllable and a point in the consonant following the stressed vowel respectively (although the latter alignment was not stable for two out of six speakers). Based on these results, Ladd et al. adopt the segmental anchoring hypothesis, which states that the beginning and end of a pitch movement are stably aligned (‘anchored’) with respect to segmental landmarks (‘anchors’).
The effects of segmental anchoring have been found in a variety of other languages: Russian (Igarashi Reference Igarashi, Bel and Marlien2004), Northern and Southern German (Atterer & Ladd Reference Atterer and Ladd2004) and Tokyo Japanese (Ishihara Reference Ishihara, Solé, Recasens and Romero2003). These studies show that alignment of F0 turning points to segmental structure is stable under changes in speech rate or syllable structure, if other conditions are kept constant.
Proponents of the segmental anchoring hypothesis have not claimed that segmental anchoring is the only factor that determines the timing of F0 events, and studies have demonstrated that a variety of factors can result in deviations from an anchor, such as speech rate or the number of intervening syllables before the following tone. In Greek (Arvaniti et al. Reference Arvaniti, Ladd and Mennen1998), tonal alignment was found to be stable only when the accent in question was separated by at least two syllables from the following accent. The H peak was found earlier if the following accent was closer. Similar effects have been reported in English (Pierrehumbert Reference Pierrehumbert1980, Silverman & Pierrehumbert Reference Silverman, Pierrehumbert, Kingston and Beckman1990) and Mexican Spanish (Prieto et al. Reference Prieto, Santen and Hirschberg1995). Tonal timing in English is affected by proximity to the upcoming phrase boundary, nuclear/prenuclear position and speech rate (Silverman & Pierrehumbert Reference Silverman, Pierrehumbert, Kingston and Beckman1990). Tonal alignment is often earlier in nuclear accents than in prenuclear accents (e.g. Dutch (Schepman et al. Reference Schepman, Lickley and Ladd2006) and Spanish (Nibert Reference Nibert2000)), and in phrase-final position compared to phrase-medial position (e.g. Kinyarwanda (Myers Reference Myers2003)). In Tokyo Japanese, the alignment of F0 peak is affected by the structure of the initial accented syllable (open or closed) (Ishihara Reference Ishihara, Solé, Recasens and Romero2003). The accentual peak occurs later relative to the end of the accentual syllable if the syllable is open. In Spanish, segmental alignment is affected by syllable structure and speech rate (Prieto & Torreira Reference Prieto and Torreira2007). That is, prenuclear peaks occur later relative to segmental points (the end of accented vowel or the end of accented syllable) when speech rate is fast or when the syllable is open, i.e. when the syllable duration is short. In the present study, we show a pattern of deviation from segmental anchoring under varying speech rates in Seoul Korean, and propose a second constraint on tonal timing to account for these deviations.
1.2.2 Constant duration
Strict formulations of segmental anchoring and constant duration requirements are inconsistent, because segmental anchoring predicts that the duration of a rise will change depending on speech rate, whereas constant duration predicts that the duration of a rise will be relatively stable, regardless of speech rate. Because of their conflicting nature, the constant duration hypothesis has often been rejected in the light of evidence that duration of a pitch movement varies depending on experimental manipulation (Arvaniti et al. Reference Arvaniti, Ladd and Mennen1998, Ladd et al. Reference Ladd, Dan, Hanneke and Astrid1999, Dilley et al. Reference Dilley, Ladd and Schepman2005). For example, Dilley et al. (Reference Dilley, Ladd and Schepman2005) compared two hypotheses, the segmental anchoring hypothesis and what they called the ‘constant interval hypothesis’, developing the analyses of Ladd & Schepman (Reference Ladd and Schepman2003).Footnote 2 Ladd & Schepman examined two speakers of English, one with a Scottish accent and one with an English accent, to see whether the F0 minima between two H*'s (‘sagging transition’) show phonological regularities. They found that the location of the F0 valley is affected by the location of the word boundary in pairs of phrases which are minimally different in terms of the location of the boundary, such as Norma Nelson (early boundary) and Norman Elson (late boundary). The F0 valley occurred earlier when the word boundary was earlier. Elaborating on this, Dilley et al. (Reference Dilley, Ladd and Schepman2005) hypothesised that if the L+H* rise has a constant duration, the timing of H* will be affected by variation in the timing of the preceding L; on the other hand, if the two targets in L+H* are segmentally anchored, the timing of H* will not be affected by manipulation of the timing of the L and the duration of the rise would vary. They reanalysed the data from Ladd & Schepman (Reference Ladd and Schepman2003), and found that the duration from L to H* is significantly greater when L is early than when it is late. They concluded that their results support the segmental anchoring hypothesis, and that there is no support for the constant duration hypothesis.
However, the constant duration hypothesis has found support elsewhere. The effects of constant duration have been found in the literature. Pierrehumbert (Reference Pierrehumbert1980: 77–80) distinguishes the timing pattern of H* and H- in English, where H* is aligned at the end of the stressed syllable, except when it is crowded by other tones. On the other hand, H- tone (e.g. in the L*+H- pitch accent) tends to occur at a fixed interval from the preceding L*. She found that, depending on the length of the post-accentual syllable, the H- can occur earlier or later in the syllable. If the syllable following the accented syllable is long (newsreel, windmill), the H is in the first half of the second syllable. If the post-accentual syllable is of moderate length (Lieberman, mothers-in-law), the H occurs near or at the end of the post-accentual syllable. If the post-accentual syllable is a reduced, very short CV syllable (cardamon, Alamo), the H occurs in the syllable after the post-accentual one. This means that, unlike H*, there is a fixed timing relation between the L and H in the L*+H- pitch accent.
Effects of constant duration are also found in Northern Finnish (Suomi Reference Suomi2007, Reference Suomi2009). In Northern Finnish, the shape of the word-initial rise–fall F0 movement remains unchanged, regardless of word length and word structure (Suomi Reference Suomi2009: 398–400). So, in short words (sei) the F0 rise–fall ends later in the word, whereas in longer words (Seikolasta) it ends relatively earlier in the word, and is followed by a plateau. A similar pattern is found in Danish. In Danish, short vowels have a falling tune, and long vowels have a falling–rising tune, thus maintaining a constant F0 shape independent of segment duration (Thorsen Reference Thorsen1984).
Moreover, in Northern Finnish, the durations of the segments where the accentual fall–rise is realised (the first mora plus the two following segments, i.e. CVCV or CVCCV) show complex patterns of compensatory shortening or lengthening under accentuation, which result in a uniform duration for this portion of the word (Suomi Reference Suomi2009). So it appears that the accentual rise–fall is subject to both segmental alignment and constant duration requirements and that the segment durations change to accommodate these requirements.
2 The experiment
2.1 The Seoul Korean Accentual Phrase
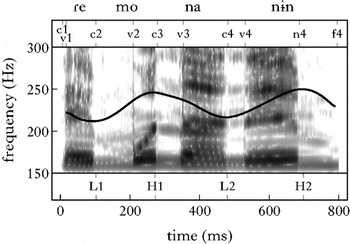
The goal of the present experiment is to test the segmental anchoring and the constant duration hypotheses as accounts of the timing of boundary tones, examining the case of the Accentual Phrase-initial LH tone sequence in Seoul Korean. Seoul Korean intonation consists of one rise at the beginning of an Accentual Phrase (AP: a phrase smaller than an Intonational Phrase but larger than a Phonological Word, according to K-ToBI; Jun Reference Jun2002) and another rise at the end of the AP. So, for a phrase with four syllables, the intonation contour is [LHLH], where the AP is bracketed (Jun Reference Jun1996, Reference Jun2002, Lee & Kim Reference Lee and Kim1997). If the phrase-initial consonant is tense or aspirated, the intonation pattern is [HHLH] (Jun Reference Jun2002), so tense and aspirated consonants are excluded in the speech material. Figure 1 shows an example of a four-syllable AP taken from the experiment reported in this section, [ɾemona-nɨn], consisting of a three-syllable content word [ɾemona] ‘Lemona (a name of a product)’ followed by a one-syllable topic marker [nɨn]. In Fig. 1, L1, H1, L2 and H2 are the pitch targets of the two rises. Following Jun (Reference Jun2002), each of the four successive syllables is assigned a tone at the surface level. The present study examines the timing of L1 and H1 under changes in speech rate. For simplicity, L1 and H1 are referred to as L and H in this paper. In Korean, extended pitch range marks focused words (Jun & Lee Reference Jun and Lee1998, Jun Reference Jun2002), but here we will examine only tones that are not in focal contexts.
Spectrogram and pitch movement (solid line) of an example of a Korean LHLH Accentual Phrase (Speaker A1 (female)), taken from the experiment in the present section. The phrase is [ɾemona-nɨn] ‘Lemona-topic’. c1 is the beginning of the first syllable onset, v1 the beginning of the first syllable vowel, n4 the beginning of the fourth syllable coda and f4 the end of the fourth syllable.

2.2 Hypotheses
This section demonstrates the predictions that segmental alignment and constant duration make regarding the timing of the initial peak in the Seoul Korean four-syllable AP.
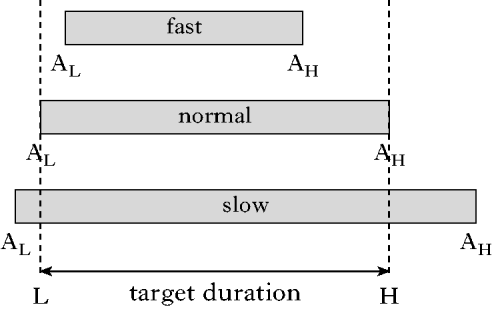
If segmental anchoring is adopted, it is expected that tonal targets will be stably aligned with respect to specific segmental landmarks under changes in speech rate. Figure 2 illustrates what would be expected under segmental anchoring in its simplest form, for Korean four-syllable APs at three speech rates: (a) fast, (b) normal and (c) slow. It is assumed for illustrative purpose that the rise starts from the onset of the AP. H indicates the location of the F0 peak, and AH indicates the location of the anchor point for H. The second syllable in a four-syllable AP has been shown to be the canonical location for H (Jun Reference Jun1996: 40). It is thus assumed that the anchor of the first H peak is in the middle of the rhyme of the second syllable. Segmental anchoring requires that H fall on the anchor regardless of speech rate, so that H is simultaneous with AH for all speech rates. It follows that duration of the rise increases as speech rate decreases. If Seoul Korean obeys segmental anchoring, there should be a positive correlation between the time of H and the time of AH.
Hypothetical tone timing under strict segmental anchoring at different speech rates: (a) fast, (b) normal and (c) slow. H is the time of H and AH the time of the anchor for H.

Note that Fig. 2 shows an idealised interpretation of segmental anchoring. In actual speech, many factors condition segmental alignment, as noted in §1.2.1. It has been shown that speech rate can affect segmental alignment systematically (e.g. English (Silverman & Pierrehumbert Reference Silverman, Pierrehumbert, Kingston and Beckman1990) and Spanish (Prieto & Torreira Reference Prieto and Torreira2007)); the faster the speech rate, the later the peak occurs relative to a landmark. However, segmental anchoring per se does not predict an effect of speech rate or other factors on tonal timing, and it is this simplest form of segmental anchoring that is under consideration here. Deviations from these predictions imply that segmental anchoring must at least be supplemented by other principles in accounting for tonal alignment.
If the constant duration hypothesis is adopted (Fig. 3), the duration of the rise remains the same at various speech rates, while the alignment between the peak (H) and its supposed anchor (AH) is not maintained, because segmental duration changes depending on speech rate. Thus the peak will be found in different positions, relative to any segmental anchor. Alignment of H with the anchor will be achieved only at a normal speech rate (b). In fast speech, H will appear after the anchor (a), and in slow speech before the anchor (c).
Hypothetical tone timing under strict constant duration at different speech rates: (a) fast, (b) normal and (c) slow.

Again, this interpretation of the constant duration hypothesis is idealised. It is unlikely that in actual speech the duration of pitch movements could remain completely invariant under changes in speech rate affecting the duration of segments. Nevertheless, even a tendency to maintain a target duration should result in systematic deviation from the anchor as a function of speech rate. If the pattern in Fig. 3 is found in Seoul Korean, this will lend support to the constant duration hypothesis.
2.3 The experimental procedure
2.3.1 Speech materials and recording procedure
The speech materials consisted of four-syllable target APs, each followed by a four-syllable verb. Each target AP consisted of a three-syllable content word followed by a particle. There were 36 target phrases (see Appendix A for the complete list). The content words were chosen in such a way that vowel height and different manners of articulation of the consonants (obstruent or sonorant) were approximately balanced in all syllable positions. Pilot studies had shown that inherent vowel duration was affected by vowel height, i.e. high vowels tended to be shorter than low vowels. Thus, in order to control the segment duration, the number of different height of vowels (high, mid, low) was balanced out in each syllable position in the target words. Syllable structure (open, closed) was also balanced as much as possible in each syllable position. The content words were followed by one of two particles, the topic marker [nɨn] ‘as for’ (31 phrases) and [man] ‘only’ (five phrases). The particle [man] was used when the last syllable of the preceding word had a coda, because in that context the allomorph [ɨn] surfaces instead of [nɨn], with the coda of the last syllable being resyllabified as the onset of the topic marker. On the other hand, [man] can attach to closed syllables, so the coda of the third syllable is not resyllabified. To ensure both closed and open third syllables occurred, [man] was used in five of the target phrases. There were 25 fillers of different lengths (three, five or six syllables in a phrase), to prevent speakers producing a fixed rhythm due to repetition of the same intonational pattern.
The verbs that follow the target phrases have the intonational pattern LHLL% (an initial rise and final L%). Thus, with the four-syllable targets, the whole sentence is read as two Accentual Phrases: [LHLH][LHLL%] in normal speech, e.g. [minaɾinɨn][mallinejo] ‘a dropwort is dried’. The order of the sentences was randomised and adjusted so that there were no more than two successive four-syllable APs.
The subjects were ten native speakers of Seoul Korean, five female (A1–A5) and five male (B1–B5). Eight of them were college or graduate students in their twenties or thirties. One male (B1) and one female (A3) were in their forties. None of them reported any history of hearing or speaking problems. Speech materials were presented in Korean on a sheet of paper, and the speakers were first asked to read the sentences twice naturally, without any instructions on speech rate, in order to elicit a natural normal speech rate. They were then asked to read the same sentences twice at a fast speech rate, and then twice at a slow speech rate. The recording took place in a sound-attenuated recording booth in the MIT Linguistics Department. Speakers wore a head-mounted microphone (Shure SM10A). Speech signals were directly digitised using a USBPre sound-input device and recorded using Amadeus II (version 3.8.4, by HairerSoft), installed on an iMac, at a sampling rate of 44,100 Hz, with 16-bit quantisation.
The experiment aimed at manipulating syllable durations by varying speech rate, in order to test the different predictions made by the two hypotheses under changes in time pressure as described in the previous section. There are various ways of manipulating time pressure on tone realisation: via speech rate (Ladd et al. Reference Ladd, Dan, Hanneke and Astrid1999), proximity of boundaries or neighbouring accents (Silverman & Pierrehumbert Reference Silverman, Pierrehumbert, Kingston and Beckman1990, Caspers & van Heuven Reference Caspers and van Heuven1993, Myers Reference Myers2003), phonemic vowel length (Caspers & van Heuven Reference Caspers and van Heuven1993) or syllable structure (Prieto & Torreira Reference Prieto and Torreira2007). In Arvaniti et al.'s terms (Reference Arvaniti, Ladd and Mennen1998: 20), time pressure can be ‘phonological’ (the number of intervening syllables between the target and the following accent) or ‘phonetic’ (the actual distance in milliseconds). Arvaniti et al. kept phonological time pressure constant (the syllable count remained the same), and varied phonetic time pressure by using vowels with different inherent durations ([ɾoˈðitiko] vs. [paˈɾemvasi]). In the experiment reported here, speech rate was manipulated – phonological time pressure was kept constant, but phonetic time pressure was manipulated by speech rate instead of inherent vowel duration. Speech-rate manipulation is a direct way of varying segmental duration without changing segmental materials, so the effects can be tested over the same words. In addition, it can give us a wider range of variation than other methods.
2.3.2 Measurements
For all the APs, segment boundaries were manually marked and labelled using Praat (Boersma & Weenink Reference Boersma and Weenink2010). The segmentation criteria for [ɾ l j] were as follows (in Korean, [l ɾ] are allophones: [ɾ] surfaces at the syllable onset, [l] surfaces in the coda and when geminated). The segmental boundaries for [ɾ] (as in marineneun [maɾinenɨn]) were mostly clear. The boundary between an [l] and the preceding vowel was placed at an abrupt change in formant frequency, if there was one. If the change was gradual, the middle point of the transition was taken as the location of the boundary. Similarly, for geminate [l] (as in minteulleneun [mindɨllenɨn]), a boundary was put where there was an abrupt change in formant frequency. That is, F2 was sometimes constant for a period during the closure, and fell near the beginning of the following vowel. If there was no such change, the middle point of the closure was taken as the location of the boundary. A similar strategy was adopted when the boundary between two sonorants (as in ka mn amuneun [kamnamunɨn]), or between [j] and a vowel (as in inajeongeun [inajʌŋɨn], jeongmineneun [jʌŋminenɨn]), was not clear. By chance, there was no [w] in the speech materials. F0 minima (L) and maxima (H) were located manually. The timing of all events was measured relative to the beginning of the target word (phrase onset=0 ms).
The inverse of the duration of the first two syllables (σ1+σ2) was adopted as a measure of local speech rate in the vicinity of the span of the initial rise. The shorter the duration of the first two syllables, the greater the local speech rate.
(1)

For statistical analyses and modelling, R statistical software (version 2.9.2) was used. Linear mixed-effects models (Pinheiro & Bates Reference Pinheiro and Bates2000, Baayen Reference Baayen2008, Baayen et al. Reference Baayen, Davidson and Bates2008) were used for modelling. Mixed-effects models were fitted using the lmer function of the lme4 package (Bates et al. Reference Bates, Maechler and Bolker2011).
2.4 Results
The experimental results showed the predicted effects of both segmental anchoring and constant duration. There was a segmental landmark with which the timing of the H peaks showed a fairly linear relationship, the effect predicted by segmental anchoring. At the same time, H was found before the anchor at slow speech rates and after the anchor at fast speech rates, the effect predicted by constant duration.
2.4.1 Rise shape
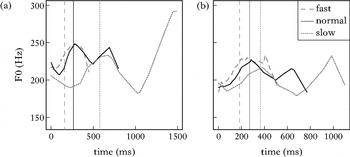
Figure 4 illustrates the averaged pitch contours by speech-rate category for two speakers (A1, A5) (see Appendix B for contours for all speakers). The averaged contour was obtained by taking average F0 and time values at each segmental boundary and connecting those averaged points. For each speech rate, the curve was averaged over 72 utterances (36 target phrases×two repetitions). In the fast speech condition, not all four tones are fully realised; instead there is only one rise and fall, with or without a plateau. We can impressionistically see that the shape (and therefore the duration) of the initial rise in normal speech roughly corresponds to the shape of the initial rise in fast speech. Thus we might expect that there would be some tendency to maintain a constant duration across speech rates for the rise.
Averaged contours for speakers A1 (a) and A5 (b). For each speech rate, the vertical line identifies the middle of the rhyme of the second syllable.

2.4.2 Effects of segmental anchoring
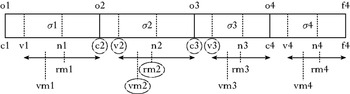
The predicted effect of segmental anchoring is that the timing of a tone T and its anchor AT will have a high positive correlation, so we adopt this as a criterion for identifying the best candidate for a segmental anchor. We selected several segmental landmarks and fitted a linear mixed model for each landmark (i.e. one model for each candidate anchor). The landmark that yields the best-fitting model is the best anchoring point. The candidate anchoring points were segmental landmarks in and near the second syllable, listed in (2) and illustrated in Fig. 5.
(2)
Various segmental landmarks (circled) for establishing the best anchoring point for H (see (2)). Each label indicates the beginning of a segment. The number indicates the syllable. c is an onset consonant, v a vowel, n a coda, o the onset of a syllable, f the end of a syllable, rm the middle of a rhyme and vm the middle of a vowel. Thus, for example, c1 is the beginning of the onset consonant in the first syllable, v1 the beginning of the vowel in the first syllable, rm1 the middle of the rhyme in the first syllable and f4 the end of the fourth syllable.

For each landmark in (2), a linear mixed-effects model was fitted to the data (Pinheiro & Bates Reference Pinheiro and Bates2000, Baayen Reference Baayen2008, Baayen et al. Reference Baayen, Davidson and Bates2008). The time of H was the dependent variable and the time of each of the segmental landmarks in (2) was the fixed effect, with by-speaker random intercepts and slopes.Footnote 3 Mixed-effects models were used because they are more appropriate when analysing experimental data pooled across speakers, as speaker can be treated as a random effect. With mixed-effects models, fixed effects can be more accurately assessed by factoring out speaker-dependent random effects. We compared the deviance values of the models obtained in this procedure. Deviance is the basic measure of goodness of the fit for mixed models. The deviance of a model is –2×L(M), where L(M) is the log-likelihood of model M, so maximising log-likelihood minimises deviance. Thus, the lower the deviance, the better the model fit. The deviance values can be directly compared to test the models with different anchors, given the same number of parameters in each model. The lowest deviance (23,283) was found with the middle of the second rhyme (rm2) as the anchor for H. The same analysis was carried out for L. The lowest deviance was found with rm1, the middle of the rhyme in the first syllable (21,890). In the L model, the rm1 fixed effect was significant (coefficient: 0·93, χ2(1)=1717·48, p<0·0001, according to a log-likelihood ratio test with a model without the rm1 fixed effect), and by-speaker random slope for rm1 was significant (χ2(2)=590·71, p<0·0001). In the H model, the rm2 fixed effect was significant (coefficient: 0·77, χ2(1)=3301·12, p<0·0001), as was the by-speaker random slope for rm2 (χ2(2)=353·84, p<0·0001).
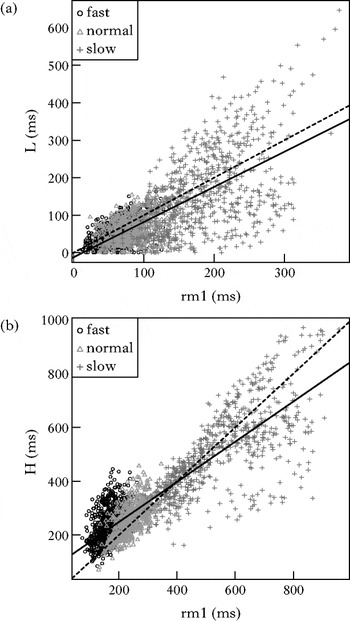
In Fig. 6, the timing of L and H is plotted against the timing of their respective anchors, rm1 and rm2, pooled across all speakers. The solid lines are regression lines, and the dashed lines are the y=x lines (the line that is expected if a tone falls exactly on its anchor). Given segmental anchoring, a positive correlation is expected. This is found in Fig. 6, so there is indeed a tendency towards segmental anchoring.Footnote 4 However, if only segmental anchoring is operative, the interval between tone and anchor (the difference between the solid and dashed lines) should not vary as a function of speech rate (cf. Ladd et al. Reference Ladd, Dan, Hanneke and Astrid1999), and the slope of the regression line should be 1. According to the mixed model above, the slope for L is 0·93, which is not significantly different from 1 [t(2077)=0·46, p=0·6]. The slope for H is 0·75, which is significantly different from 1 [t(2080)=4·6, p<0·001]. A slope less than 1 indicates that there is another factor affecting the timing of the tones; this will be discussed in the following section.
Alignment of L and H: (a) L against rm1 (R2=0·532); (b) H against rm2 (R2=0·77). The solid line is the regression line; the dashed line is y=x.

2.4.3 Effects of target duration
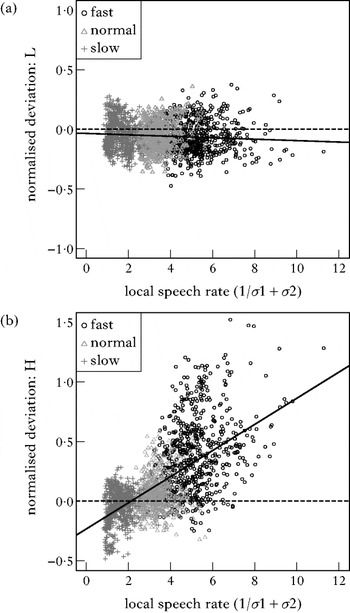
The locations of L and H targets relative to their anchors were further examined, in order to investigate the possible effects of constant duration discussed in §2.1.3. A systematic variation was found in the timing of L and H relative to the segmental anchor, depending on speech rate. Figure 7 illustrates the results, pooling across all speakers. In the plot, the x-axis is local speech rate, and the y-axis is ‘normalised deviation’. Normalised deviation of a tone from its anchor was calculated by taking the difference between the timing of a tone and its anchor, divided by local speech rate, as shown in (3) (where AL is the anchor for L; AH the anchor for H). Local speech rate was the inverse of the duration of the first two syllables (1/(σ1+σ2)).
(3)
(a) L deviation from AL (anchor=rm1): in faster speech, L occurs earlier than AL; (b) H deviation from AH (anchor=rm2): in faster speech, H occurs later than AH. The solid line is the regression line; the dashed line is y=0 (the anchor).

In Fig. 7, the normalised deviation of L and H is plotted against local speech rate. The dashed line is the position of the anchor (y=0, i.e. no deviation). A positive value of normalised deviation represents timing of L or H after the anchor, and a negative value timing before the anchor. We used the best anchor estimate from the previous section (that is, rm1 for L, rm2 for H).
It can be seen in Fig. 7 that the deviation of H peaks is in general much greater than the deviation of L troughs. This pattern is comparable to previous experimental work – in many languages, the timing of H peaks tends to vary more than L troughs (e.g. Dutch (Caspers & van Heuven Reference Caspers and van Heuven1993) and Spanish (Prieto & Torreira Reference Prieto and Torreira2007)). If the duration of the rise is constant, the direction of the deviation of H peaks is as predicted. Thus in Fig. 7b we can see that H peaks occur later relative to the anchor at a faster speech rate and earlier at a slower speech rate. The slope of the regression line was significantly different from zero (slope=0·109, t(2080)=38·20, p<0·0001, R2=0·41). However, the slopes of the regression lines (both for L and for H) in the plots are not very meaningful, because the data are pooled across speakers (see Appendix C for individual speakers' results). Interestingly, we also find a small but significant deviation pattern for L, where the pattern of deviations is reversed, as shown in Fig. 7a. That is, L occurs earlier as speech rate gets faster and later as it gets slower. The slope was significantly different from 0 (slope=–0·006, t(2075)=–3·605, p<0·001, R2=0·006). We can interpret these results to mean that not only the H but also the L is affected by time pressure. That is, the rise starts earlier and terminates later when the anchors for L and H get closer to each other as speech rate increases (and vice versa when speech rate slows down). The broad picture of this pattern suggests that there is some relationship between the L and H tones as a function of time pressure. This intuition is modelled in quantitatively precise terms in §3, and the significance of the proposed model is tested in §4.
In a nutshell, the pattern is that in faster speech L tends to occur earlier and H tends to occur later relative to their respective anchors, with H deviating much more than L (cf. Prieto & Torreira Reference Prieto and Torreira2007). We interpret this pattern to mean that there is a preferred duration for a rise, the target duration. That is, the rise starts earlier and terminates later than the anchors to accommodate the target duration in fast speech.
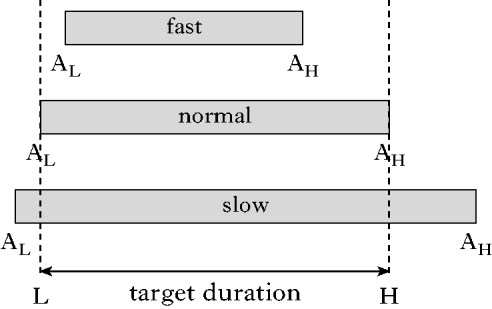
The relationship between a target duration and the relative locations of tones is illustrated schematically in Fig. 8 (reflecting the asymmetry between L and H). Suppose that in normal speech, L and H occur at their respective anchors and the duration from L to H is the target duration. In fast speech, the duration of segments decreases and the anchors get closer to each other: thus the time available to produce a rise is reduced. If the duration of the rise remains constant across speech rates, in fast speech L occurs earlier than AL, and in slow speech later. Conversely, H occurs after AH in fast speech, and before AH in slow speech.
Schematic illustration of target duration and its effects on the relative timing relationships between the anchor and L/H.
The observed pattern cannot be simply due to articulatory restrictions, because we do see earlier H peaks in slow speech – if the peak delay in fast speech were only due to articulatory unease (cf. Xu Reference Xu2001, Xu & Sun Reference Xu and Sun2002), we would expect the H peaks to occur at the anchor in slow speech, rather than preceding it. Instead, the observed deviation is in both directions: rises which are too long or too short are avoided. There could be perceptual reasons for this: too short a rise would be hard to detect (Greenberg & Zee Reference Greenberg and Zee1979, Thyer & Mahar Reference Thyer and Mahar2006), whereas too long a rise would be hard to perceive as a rise.
It should be noted that the anchors are assumed to be consistent across all speech rates. As an alternative to this, a reviewer suggests that one might think of a model where the anchor itself moves, depending on speech rate. For example, the anchor for the L shifts earlier in fast speech than in normal speech, and shifts later in slow speech. Likewise, the anchor for the H shifts earlier in slow speech and later in fast speech. Such a model could describe the pattern in the data, but it lacks explanatory adequacy. Such an approach cannot explain why the anchor has to move as a result of time pressure. An anchor that moves depending on speech rate runs the risk of circularity – that would just mean that the anchor is where the tones occur. On the other hand, in the proposed model, rate-dependent shifts in the tonal timing are explained as the avoidance of too short or too long rise duration, with the anchor remaining consistent across speech rates. Other previous studies also assume rate-independent anchors (e.g. Ladd et al. Reference Ladd, Dan, Hanneke and Astrid1999, Igarashi Reference Igarashi, Bel and Marlien2004, Prieto & Torreira Reference Prieto and Torreira2007). In Ladd et al. (Reference Ladd, Dan, Hanneke and Astrid1999), a segmental anchor is characterised as a point whose distance from a tone is not affected by variation in speech rate.
Recall that under the segmental anchoring hypothesis, it is claimed that tonal targets are independent of each other. That is, it has been argued that the L and H targets are independently aligned with respect to their anchoring points, so that the duration between L and H is entirely determined by the duration between the anchors. However, the deviation patterns of L and H shown above suggest that there should be a factor that governs the duration between L and H, so L and H are related to each other, while also aligned with respect to segments. If the timing of tones is predicted straightforwardly from their anchoring points only, the duration of the rise (H−L) and the distance between the anchors (AH−AL) should have a linear relation, with a slope of 1. However, this is not what is observed. In Fig. 9, H−L is plotted against AH−AL. The plot shows that H−L and AH−AL have a positive correlation, but H−L does not change as much as AH−AL changes. The slope of the regression line is significantly different from 1 (slope=0·649, t(2060)=26·93, p<0·0001).
H−L against AH−AL. The solid line is the regression line; the dashed line is y=x. All speech rates and speakers are pooled.

The results in §2.4.2 and §2.4.3 can be summarised as follows. There is a tendency to align a tone with respect to a certain segmental landmark. At the same time, the precise location of the tones is adjusted relative to the segmental anchor, depending on the absolute duration between the anchor for L and the anchor for H. In faster speech, the duration between AL and AH is shorter, so the rise tends to start slightly earlier than AL and terminates later than AH, compared to slower speech. The model predicting tonal timing thus requires two factors: segmental alignment and target duration. This kind of model is formalised in §3.
3 Modelling
3.1 The Alignment-Duration model
In §2 we proposed that the precise timing of the tones comprising the Seoul Korean accentual phrase intonation contour is determined by segmental alignment as well as a target duration. Segmental anchoring was observed, but there was also a pattern that could not be explained in terms of segmental anchoring only. To model these results, I adopt the constraint-based approach proposed by Flemming (Reference Flemming2001). This approach uses weighted constraints to model interactions of the targets for scalar phonetic representations, such as F2 values in vowels coarticulated with adjacent consonants (Flemming Reference Flemming2001: 19–23). Using this framework, a model for the timing of L and H in the Seoul Korean Accentual Phrase will be developed in this section. It will be suggested that a phonetic realisation grammar consists of constraints specifying alignment of tones to anchors and a target duration for the rise. Each of these factors is translated into a target in the model, in which constraints require that these targets be realised.
The proposed constraints and the cost of violation of each constraint are shown in (4), where T(L) is the time of L, T(H) the time of H, D is the target duration (a positive constant) and w L, w H and w D are positive weights.
(4)
The alignment constraint T(L)=AL requires that the L tone occur at its anchor. The cost of violating this constraint is the squared deviation between the time of L and the time of the anchor AL, multiplied by its weight w L. The same holds for T(H)=AH. At the same time, the Duration constraint requires that the duration of a rise correspond to a target duration. Because the model consists of alignment and duration constraints, it will be referred to as the Alignment-Duration (AD) model. The relative importance of these constraints is reflected in their weights. Violating constraints with higher weights incurs a greater cost, so it is more important to satisfy them. For example, L is more strictly aligned than H in Korean, so it is expected that Align(L) will have a higher weight than Align(H) (w L>w H), i.e. alignment of L is more important than alignment of H. This concept can be made quantitatively precise by the formulation in (5). The actual timing of L and H is determined as the values of T(L) and T(H) that minimise the summed cost of violations of these constraints (cf. Flemming Reference Flemming2001: 20).
(5)
The minimum of the cost function in (5) is found where its derivative is zero. By differentiating the cost function with regard to T(L) and T(H) respectively, we obtain the partial derivative functions for each. The equations in (6) are the expressions for T(L) and T(H) where the relevant partial derivatives are zero.
(6)
The expressions in (6) correspond to the experimental results presented in §2, reflecting the effects of segmental anchoring and target duration. The two terms in each equation represent the effects of segmental anchoring and target duration respectively. This means that timing of a tone is determined by the weighted average of the anchor and the position that would yield a rise duration D. The terms with AL and AH reflect the effects of segmental anchoring. It was shown that tones have a linear relation with their anchoring points, and the equations in (6) imply linear relationships between T(L) and AL (a) and T(H) and AH (b). The terms with D reflect the effects of target duration. According to the experimental results, tones deviate depending on speech rate. For example, H peaks occur relatively later than the anchor in fast speech, and earlier in slow speech. In (6b), the time of H is determined by the anchor (AH) and a point at a fixed duration from the actual time of L (T(L)+D), with differing relative importance. Whether the actual time of L or H is closer to the anchor or to the point which satisfies D depends on the constraint weights. If segmental anchoring is more important (i.e. the alignment constraints have more weight than the duration constraint), the time will be closer to the anchor than the point where the target duration would be satisfied. When speech rate is fast, the absolute duration between T(L) and AH decreases. If the duration between T(L) and AH is less than (T(L)+D), H will be more likely to be later than AH, in order to satisfy a target duration D. Similarly, if the speech rate is slow, the absolute duration between T(L) and AH becomes greater, and if the duration between T(L) and AH is greater than (T(L)+D), H will more likely occur earlier than AH, in order to satisfy a target duration D.
Furthermore, using the proposed model, it is possible to predict the times of L and H directly from the times of AL and AH only, without having to know the time of one of the tones. The direct solutions of optimisation for T(L) and T(H) are obtained as in (7), by substituting (6a) into (6b) and vice versa (cf. Flemming Reference Flemming2001: 22).
(7)
The expressions in (7) mean that T(L) and T(H) deviate from their respective anchors (AL, AH) by a proportion (u L, u H) of the difference between the inter-anchor distance and the target duration D. The proportion (u L, u H) depends on the relative weights of the constraints, as shown in (7). Thus for L, the more heavily weighted Duration and Align(H) are, the more the L tone deviates from AL. For H, the more heavily weighted Duration and Align(L) are, the more the H tone deviates from AH.
The proposed weighted-constraint model is similar to Optimality Theory (Prince & Smolensky Reference Prince and Smolensky1993) in that the surface form is determined by optimisation among conflicting constraints, but differs in how the conflicts are resolved, i.e. by constraint weighting vs. constraint ranking. In OT, the conflicts are resolved through ranking the constraints according to the principle of Strict Domination (Prince & Smolensky Reference Prince and Smolensky1993: 78). So surface forms are the ones that maximally satisfy the higher-ranked constraints. On the other hand, the constraints in the proposed model are assigned numerical weights, and surface forms are determined as the values that minimise the summed cost of violations of the conflicting constraints. In this regard, the proposed model is essentially the same as Harmonic Grammar (Legendre et al. Reference Legendre, Sorace, Smolensky, Smolensky and Legendre2006). Harmonic Grammar also uses the weighted sum of constraint violations to evaluate candidates. A candidate is evaluated in terms of its harmony, the sum of its violations, or its satisfaction score multiplied by the weight. A difference between the current model and Harmonic Grammar is that in the model developed here the same approach is applied to the evaluation of continuous phonetic representations (time of an event in milliseconds), instead of non-continuous phonological representations. Thus the proposed model is appropriate when dealing with scalar representations, in that it precisely quantifies the interaction of conflicting targets whose effects coexist in phonetic implementation.
3.2 Estimating model parameters: the precise anchors and constraint weights
In the equations in (6), the unknown parameters are the three weights (w L, w H, w D) and D. Mixed-effects models were fitted to the data to obtain estimates of these parameters. By using the corresponding coefficients from the fitted model, it is possible to estimate the locations of precise anchors (AL, AH), as well as constraint weights and D. In §2.4.2, the best anchoring points for L and H were located by testing several segmental points for the highest correlation with the time of a tone. It was established from that procedure that the anchor for L was the middle of the first rhyme, and for H the middle of the second rhyme. However, these estimates were based on the segmental anchoring hypothesis, in which the L and H tones are considered to be independently aligned. Thus these anchor estimates may not be accurate for the model proposed in this section, because the L and H tones are related in this model.
We can reorganise the expressions in (6) in order to make it easier to fit with a linear model, given the data discussed here. The expressions can first be rewritten with the aim of estimating the precise location of anchors. Using the same coefficients, the constraint weights can also be computed. The coefficients of AL and T(H)−D in (6a) sum to 1, as shown in (8).
(8)
The same holds for (6b). Thus the expressions in (6) can be simplified by substituting simpler variables for these coefficients, as in (9).
(9)
The expressions in (9) can be further rearranged as (10), by grouping the terms with the same coefficient (a and c respectively).
(10)
To estimate a precise anchor for L, it can be hypothesised that the anchor AL is somewhere in the first rhyme, because in the previous estimation the best anchoring point was the middle of the first rhyme. Then AL can be expressed as a point at some proportion of the first rhyme, and can be replaced by (v1+p×rhyme1), as in (11), where v1 is the beginning of the first vowel and rhyme1 is the duration of the first rhyme (that is, the distance from the beginning of v1 to the end of the first syllable). Then the anchor can be represented as some proportion of the rhyme.
(11)
The value for p can be found by fitting a linear mixed model to the data. To fit an appropriate mixed model, (11) can be rearranged as (12). A mixed model was fitted to the data with T(L) as the dependent variable, and (v1−T(H)) and rhyme1 as fixed effects. The coefficient of the T(H) term is known from the model in (12) to be 1. The lmer function allows the coefficient of a variable to be set to 1 by introducing that variable as an ‘offset’ in the model specification. Thus the variable T(H) was added to the mixed model as an offset. There were also by-speaker random intercepts and slopes for (v1−T(H)) and rhyme1.
(12)
In the mixed model, the coefficient estimate of (v1−T(H)) corresponds to a, and the coefficient of rhyme1 corresponds to a×p. From a and a×p, the value of p can be computed. In the mixed model, a=0·833, a×p=0·247, thus p=0·247/0·833=0·30. The precise anchor for L is therefore as in (13).
(13)
The same procedure is applied to T(H). For T(H), AH is divided into (v2+p×rhyme2), where v2 is the beginning of the second vowel and rhyme2 is the duration of the second rhyme. So we have the model of T(H) in (14).
(14)
A mixed model was fitted in a similar fashion as for T(L), from which AH can be estimated as in (15).
(15)
In summary, the anchor estimates are about 30% into the first rhyme for the L, and about 37% into the second rhyme for the H. These are somewhat earlier than the previous approximations (both at around 50% of the rhymes). The explanation for the particular locations of segmental anchors has not been clear in previous studies. We could perhaps say that timing F0 turning points early in the rhyme is likely to ensure that the turning points occur in a high-amplitude, voiced region of the syllable, where F0 is likely to be best perceived (the sonorous rhyme is the best place to realise the F0 contour in lexical contour tones; Zhang Reference Zhang, Hayes, Kirchner and Steriade2004).
Using the coefficients of the fitted models of T(L) and T(H), it is possible to compute constraint weights and D. Constraint weights and D are calculated using corresponding coefficients in the mixed models fitted to the data, using the relations in (9). The actual values are shown in (16).
(16)
In addition, w L+w H+w D=1 is assumed, because only the ratios of the constraint weights are relevant in this model. With this assumption and (16), we obtain w L=0·56, w H=0·33 and w D=0·11.
The relative constraints weights reflect the experimental results in §2 that L was more strictly aligned than H (Fig. 7a vs. 7b). The weighting (w L>w H) means that Align(L) is more important than Align(H). It should also be noted that the weights of the alignment constraints are higher than the weight of the duration constraint. That is, segmental alignment is still dominant in determining tonal timing. However, the weight of the duration constraint is non-zero, indicating that the target duration is operative. The statistical significance of the duration constraint in the AD model is tested in §4.
The estimates of the value of D, the target duration, are not the same in the T(L) and T(H) models. From (16a), D=196 ms, while from (16b), D=373 ms. The difference, 177 ms, is quite large, but, as we will see shortly, not statistically significant. The real problem is that both estimates of D have very wide confidence intervals, in part because of the apparent variability in the data, but more particularly because of the way D is calculated. For example, D in (16a) is the ratio of the intercept, b, of the linear model in (10a), which is –32·71, and –(1−a), where a is the slope of the linear model, giving 0·167. The magnitude of b is much larger than 1, whereas (1−a) is around 0·2 for both the L and the H models, so when b is divided by (1−a), small errors in a can yield large errors in the calculated value of D. The value of (1−a) is small because the constraint weight for the target duration (w D) is small (0·11), so the low weight on this constraint makes it difficult to estimate its target precisely. In the next section, we show that the confidence interval for the difference between the two D estimates contains zero, which shows that they are not significantly different.
3.3 Estimating D values
As mentioned at the end of the previous section, the D value estimates from the T(L) model and the T(H) model were not the same. I refer to the D values from the two models as DL and DH respectively. The D values were calculated from the estimates of the intercept and the slope in each model. That is, from (16), DL=b/(a−1) and DH=d/(1−c), where b and d are the estimates of the intercept, and a and c are the estimates of the slope in each model. Whether the estimates of D are significantly different was tested by calculating a confidence interval for the difference between them. This approach was adopted because it is difficult to calculate variances of D estimates directly from the coefficients, as D values are ratios of model parameters.
When the object of interest is more complicated than individual coefficients, simulation is the easiest and most reliable way to compute the uncertainty of the estimates (Gelman & Hill Reference Gelman and Hill2007: 141). Following the procedure in Gelman & Hill (Reference Gelman and Hill2007), simulations were run to generate 1000 pairs of intercept and slope. The intercept and slope pairs were drawn stochastically, based on the variance of the intercept and slope in the given model (the resulting values are therefore slightly different at each try). 1000 is typically more than enough (Gelman & Hill Reference Gelman and Hill2007). D values were computed for each simulation draw of intercept and slope. For DL, b/(a−1) values were computed, and for DH, d/(1−c) values. 95% of the simulated samples of DL (i.e. 95% confidence interval for DL) was between 68 and 502 ms, and DH was between 206 and 945 ms. The overlap between the DL and DH values was substantial. That is, the differences between pairs of the simulated DL and DH were taken, and 95% of the differences were between –177 and 772. The interval includes zero, which indicates that DL and DH are not significantly different.
It was possible to estimate the most probable D value from the distribution of the DL and DH values. The method used was to find the peak of the combined probability distribution function of the two distributions (Papoulis Reference Papoulis1984). That is, the sampled distributions of DL and DH were first smoothed, to estimate the probability density function (PDF). PDFs were estimated over the range 0 to 1500 ms, since this covered the bulk of both distributions. The two PDFs in this range were multiplied; the peak in the combined PDF corresponded to the location of the most probable D value. This procedure yielded an estimated D value of 256 ms (cf. the actual H−L mean: 247 ms; sd=111 ms).
4 Testing the contribution of the target duration
In §2, we showed that tones show patterns of variation in timing which cannot be fully explained by segmental anchoring alone. In §3, we added a target duration to the model of tone alignment to account for the deviations from strict segmental anchoring of tones. In this section, we test whether the addition of the target duration contributes significantly in predicting the tonal timing pattern. To do this, the Alignment-Duration model proposed here is compared with models where the time of a tone is determined by its anchor only, not in relation to the other tone. A fundamental difference between the AD model and a strict segmental anchoring model is that in the AD model, the time of one tone is dependent on the time of the other tone, as a result of the duration constraint. On the other hand, strict segmental anchoring implies that the L and H tones in a rising movement are independent of each other. Tonal timing is thus predicted by segmental alignment only, not by the relation with the other tone.
A model in which tonal timing is based on segmental anchoring alone has the form shown in (17).
(17)
That is, the times of L and H are determined strictly by the location of their anchors, with a slope of 1. The intercepts b, d may not be zero, in order to allow for the cases such as Greek, where the peak occurs at a fixed interval from the anchor. However, this model is inadequate for the Korean data presented in §2, because the slope of the relationship between T(H) and AH was significantly less than 1.
To provide a more stringent test of the hypothesis that the times of H and L are not independent, we can also compare the AD model to a more relaxed model that allows for slopes of less than 1 and non-zero intercepts, while maintaining the independence of L and H. This model is described in (18).
(18)
The model in (18) allows for linear relationships of the kind observed in our experiments in §2 for L and H respectively. The slope of the anchor for H in the regression model was not 1, and the intercepts were not 0. That is, T(L) and T(H) had linear relationships with their respective anchors as shown in (18), where c<1 and b, d≠0. This model is thus richer than the SA model.
The H model in (18b) has previously been suggested for the timing of the Korean phrase-initial H peak (Cho Reference Cho2007). It can be interpreted as resulting from the interaction of two constraints, one requiring that H be aligned with AH, and the other requiring that H occur at a fixed duration from the phrase onset, rather than at a fixed duration from L. The time of the H target is the time that minimises the deviations from the location of the anchor and the point after the fixed interval (D) from the phrase onset (L). That is, the slope c is the weight of the alignment constraint and the intercept d is the constant that reflects the target duration (the duration from the phrase onset to H) and its constraint weight, as in (19).
(19)
In Cho (Reference Cho2007), the model in (19) was proposed for T(H), without a corresponding model for T(L). It was assumed that the rise starts from the phrase onset, i.e. L is always at the phrase onset. In the present study, this turns out to be false (L is anchored at the 30% point in the first rhyme). Nevertheless, the model in (19) can be reinterpreted and separately applied to L in the same way, as in (20). That is, just as the model in (18b) is equivalent to (19), so the one in (18a) is equivalent to (20). The time of L is the weighted average of its anchor (AL) and a point at a fixed interval from the phrase onset (say d – certainly much shorter than D). Here, the target duration for the L is d.
(20)
Thus the model in (18) is not based on segmental alignment only, but crucially does not include a constraint on the duration between L and H, and so predicts that the timing of the two tones should be independent. We can therefore refer to it as the independent alignment (IA) model.
The IA model can be compared to the AD model proposed here, in order to test the prediction of the Duration constraint that the timing of L and H should be interdependent. The difference between AD and IA is the presence of the target duration, which explicitly refers to the timing difference between L and H. The AD model in (9) is repeated in (21). The model of T(L) has a T(H) term, and the model of T(H) has a T(L) term.
(21)
When fitting the AD model in the previous section, the precise anchor was estimated based on the model, as demonstrated in §3.2. Because those anchor estimates were based on the AD model, the anchors should be re-estimated for the IA and SA models. As before, the anchor for L is supposed to be in the first rhyme, and the anchor for H is supposed to be in the second rhyme. AL is therefore split into (v1+p×rhyme1), where v1 is the beginning of the first vowel, rhyme1 is the duration of the first rhyme and p is the proportion into the first rhyme. A similar approach applies to AH, which is assumed to be in the second rhyme. In this way, the IA model in (18) can be expressed as in (22).
(22)
To find the value of p for T(L) in (22a), a mixed model was fitted to the data, with T(L) as a dependent variable, v1 and rhyme1 as fixed effects, by-speaker random intercepts and slopes for v1 and rhyme1. In this fitted model, the coefficient for v1 was 1·004, the coefficient for rhyme1 was 0·447, thus a=1·004, a×p=0·447, and so p=0·45. Thus, AL can be estimated as in (23a). AH was estimated following a similar procedure, shown in (23b).
(23)
According to the coefficient and intercept estimates of the fitted models, T(L) and T(H) in the IA model are expressed as in (24).
(24)
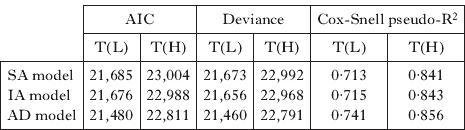
To compare goodness of fit of the SA, IA and AD models, the Akaike Information Criterion (AIC) values and deviance were compared (see Table I). The AIC is a measure of goodness of fit of a statistical model. It is equal to the deviance of the model, with a penalty added for each parameter in the model.Footnote 5 Because the AIC is a measure of information lost, the lower the AIC the better the model fit. For two models of the same data, if the difference in AIC values for two models is greater than ten, the rule of thumb is that there is ‘essentially no support’ for the model with the higher AIC (Burnham & Anderson Reference Burnham and Anderson2002: 70ff). As can be seen in Table I, for both L and H models, the AIC values are lower in the AD model than in the SA or IA models – the differences in the AIC values are all greater than ten.
Comparison of the models.
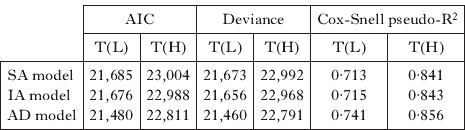
AIC values and deviance decrease as we move from SA to IA to AD, indicating that the AD model is the best-fitting model. This also means that explained variance increases from SA to IA to AD, although the differences are relatively modest, and indicates that the SA model accounts for much of the variation in the data.
An alternative measure of goodness of fit is provided by Cox-Snell pseudo-R2.Footnote 6 In linear models without random effects, R2 is an intuitive statistic that shows explained variance. However, in mixed-effect linear models, there is no precise analogue of R2, because these models contain multiple variance components (Snijders & Bosker Reference Snijders and Bosker1999: 99ff). A variety of pseudo-R2 measures have been proposed, ranging from 0 to 1, with a value of 1 representing perfect fit and a value of 0 indicating no improvement over the null model (see Sun et al. 2010 for a review), although none is generally accepted. With this proviso, the Cox-Snell pseudo R2 is presented here as an alternative way of assessing the relative fit of the three models compared to a null model. The null model here is an intercept-only model, without by-speaker random intercept.
The comparison between the IA and AD models only tests the contribution of the non-independence of L and H, rather than the contribution of a target duration, compared to strict segmental anchoring alone, because the IA model is not a simple segmental anchoring model. In the IA model, L and H have independent target durations – so L and H are independent. This was the reason for including the SA model for comparison, as there is no target duration of any kind in that model. It can be seen that the Cox-Snell pseudo-R2 increases as we move from SA to IA to AD. This gives an intuitive sense of how well the AD model fits to the data, compared to the other two models; still, a standard interpretable measure of overall model fit is the AIC shown in Table I.
However, these statistics do not provide us with a significance test of the difference of goodness of fit between the models. For nested models, where one model is a special case of another model, the likelihood ratio test (LRT) is used to see whether an additional parameter makes a significant contribution to the fit (Faraway Reference Faraway2006). The difference in fit between the SA and IA models can be tested in this way because the SA model is a special case of the IA model, where slopes are fixed at 1. The LRT shows that the IA model is significantly better than the SA model for both L and H (for L: χ2(4)=17·317, p<0·01, for H: χ2(4)=24·068, p<0·0001).
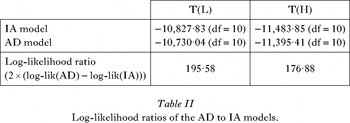
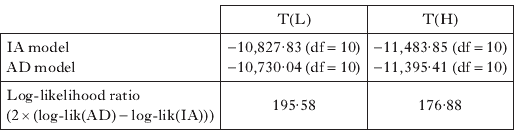
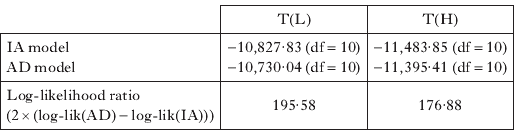
Testing the difference in fit between the IA and AD models is not simple, because they are not nested, so the usual LRT cannot be used. Instead, we used the parametric bootstrap LRT for non-nested models, following Lewis et al. (Reference Lewis, Butler and Gilbert2011). The same test statistic, the log-likelihood ratio, or the difference between the deviances of the two models, is used here, but with non-nested models the distribution of this test statistic is unknown, so we estimate its distribution using a parametric bootstrap method (Faraway Reference Faraway2006: 160–161, Lewis et al. Reference Lewis, Butler and Gilbert2011). That is, 1000 sets of simulated data were generated from the IA model, and each data set was used to fit an IA model and an AD model, and then to calculate the log-likelihood ratio (LR) of the IA model to the AD model.Footnote 7 This procedure yielded an estimate of the distribution of LRs, under the null hypothesis that the IA model is correct. The probability of obtaining the observed LR under this null hypothesis was then calculated by determining the proportion of this distribution which is more extreme than the LR of the models fitted to the actual data. The actual LRs are shown in Table II. For both L and H models, this method yielded p<0·0001, so the AD models fitted significantly better than their IA counterparts. Since there is no natural null model when comparing non-nested models, the procedure was repeated under the null hypothesis that the AD models are correct, i.e. generating simulated data sets from the AD models. For the L models, the resulting p value was 0·389, so it is not possible to reject the null hypothesis that AD is the correct model. The p value for the H models was 0·2, leading to the same conclusion. So the combined results of these tests show that the AD models fit the data significantly better than their IA counterparts, as shown in Table II.
Log-likelihood ratios of the AD to IA models.
To summarise, this section has shown that the proposed Alignment-Duration model provides a better account of the data than the SA or IA models in the case of the Seoul Korean phrase-initial rise. This means that the addition of the target duration contributes significantly to the fit of the AD model.
5 Discussion
In this paper, we have shown that phrase-initial L and H tonal targets in Seoul Korean show systematic deviations from segmental anchoring, which we interpret as evidence that there is a target duration for the rise. Segmental anchoring is still the dominant factor in determining tonal timing, as the relative weights show, but target duration has a significant effect. Some previous findings that show deviation from strong segmental anchoring may also be reinterpreted as effects of constant duration. In this section we review these findings.
Prieto & Torreira (Reference Prieto and Torreira2007: 485) found a similar pattern in Spanish, though analysed in terms of a categorical speech-rate distinction. H peaks occur later relative to segmental landmarks, in the order fast, normal and slow speech. Syllable structure (open vs. closed syllable) also had effects on the alignment. In closed syllables H peaks are found within the coda, while in open syllables H peaks are found around the end of the vowel.
Given such results, Prieto & Torreira argue that ‘there is a genuine phenomenon of ‘segmental anchoring’, whereby the duration of pitch movements in speech is finely adjusted to the duration of the accompanying segmental material' (2007: 491), though they do not propose any explicit model. They attribute the variations in alignment to the distinct modes of gestural coordination in syllable-initial and syllable-final positions. That is, gestures at the syllable onset are more tightly coordinated than gestures at the syllable-final position. However, their results also seem to be consistent with a model of the kind proposed here for Korean. Given a target duration for the rising F0 movement, the peak is expected to occur earlier than the end of syllable when the syllable rhyme is long (i.e. in closed syllables); and around or later than the end of syllable when the syllable rhyme is short (i.e. in open syllables).
Welby & Lœvenbruck (Reference Welby and Lœvenbruck2005, Reference Welby and Lœvenbruck2006) found that there was a considerable variation in the alignment pattern of L2 and H2 (the late rise) in the French LHLH and LLH accentual phrase melodies. Neither segmental anchoring nor constant duration was supported (2005: 2371–2372). There was considerable variation in the alignment pattern of L2 in the French LHLH accentual phrase, so pure segmental anchoring was not supported, but nor did they find support for the constant shape (slope, duration) hypothesis, since the duration of the rise was not constant. Based on these findings, they proposed the ‘anchorage’, a temporal range within which an intonational turning point can anchor. For example, the anchorage for H2 was the region from approximately 20 ms before the end of the vowel to the end of the accentual phrase (2005: 2372).
However, the concept of an anchorage cannot fully explain cases such as Seoul Korean, where the variation is systematic, and is conditioned by local speech rate. It is also uncertain on the basis of Welby & Lœvenbruck's description whether the observed variability in French was also partially systematic. We find at least some indications of the effect of constant duration in some of their subjects. For example, rise duration was not significantly different across different speech rates (normal, fast) for three out of five speakers (2006: 104). L2 was aligned later in normal speech than in fast speech for two out of five speakers (2006: 106). This is comparable to the L deviation pattern of Seoul Korean, although it is not the same: in French, alignment of H2 was not significantly different in fast and normal speech rates.
The empirical evidence from Seoul Korean and French just mentioned shows that both segmental anchoring and constant duration requirements are violable. It is therefore appropriate to treat the two competing hypotheses as violable constraints. The constraints that require a target to be realised are universal, and the weights of the constraints determine the relative importance of the targets. The proposed model thus explains the patterns that involve neither strict segmental anchoring nor constant duration, but are a compromise between the two conflicting requirements.
5.1 Cross-linguistic applications of the proposed model
A constraint-based approach naturally leads to the hypothesis that there are constraints that are common across languages, and that cross-linguistic differences are reflected in the relative weights of these constraints. Thus we may hypothesise that the three constraints in the AD model will apply in other languages as well, and different languages can have different relative weights on the constraints. This prediction is borne out in recent studies, where the proposed model has been applied to other languages with diverse tonal phonologies (Mandarin (Cho & Flemming Reference Cho and Flemming2011), English (Cho Reference Cho2011) and Japanese (Cho Reference Cho2010)). Here we have hypothesised that lexically contrastive accents (e.g. Mandarin and Japanese accentual tone) or prominence-lending pitch accents (e.g. English) will be more strictly aligned to the relevant tone-bearing units than boundary tones (e.g. Seoul Korean and Japanese phrase-initial tone), on the assumption that the timing of the tones of the former types will be perceptually more significant and functionally relevant than the timing of the boundary tones. We found that the effects of both segmental anchoring and target duration exist in all the languages examined. Moreover, the relative constraint weights showed systematic differences depending on phonological nature of tones. For example, in languages where contour tones are contrastive (Mandarin (High vs. Rising tones) and English (H* vs. L+H*)), the weights of the duration constraint are higher than in languages where they are not (Japanese and Seoul Korean). In this way, the proposed model provides a framework where different phonetic realisation patterns of tones, for example those depending on the phonological nature of tones, can be specified. Finally, these cross-linguistic studies show that many languages show the dominance of segmental anchoring, i.e. the weight of alignment constraints was in general higher than the duration constraint. Only in Mandarin was the weight of the duration constraint almost as high as those of the alignment constraints.
6 Conclusion
The segmental anchoring hypothesis and the constant duration hypothesis make conflicting predictions, so previous studies have asked which properties are invariant in F0 movements, alignment or duration. The present study has shown that segmental anchoring and target durations are simultaneously operative in determining the precise timing of tones in the Seoul Korean phrase-initial F0 rise. The proposed Alignment-Duration model provides a framework in which these observations can be made quantitatively precise. In the proposed model, tonal timing is determined through compromise among constraints that impose conflicting requirements, adopting the weighted-constraint approach to continuous phonetic representations (Flemming Reference Flemming2001). The proposed model adds a constraint for imposing a target duration on the rising pitch movement, which makes the L and H tonal targets dependent on each other. It turns out that the contribution of the target duration constraint significantly improves the model fit. This means that the L and H tonal targets constituting a phrase-initial rising movement in Seoul Korean are not independent of each other.