In recent years, sparked by the path-breaking reports issued by the American Association of
Colleges and Universities (AACU) in 1991 (Wahlke 1991), the
political science profession has paid an increasing amount of attention to the relationship
between the structure of the political science major and student learning outcomes. A few
studies have recently sought to examine this relationship empirically (Breuning, Parker, and
Ishiyama 2001; Ishiyama and Hartlaub 2003;
Ishiyama and Breuning 2003). However, these studies have focused
largely on using the political science curriculum as an independent variable (i.e., affecting
student outcomes) and in most cases have been limited to one or two institutions (with the
exception of Ishiyama 2004). No study has broadly and systematically
examined variations in curricular design across several institutions, nor has any study
examined which factors affect how institutions have structured their majors in the way they
have.1
For some recent studies that have surveyed graduate
programs in political science, see Hesli, Fink, and Duffy (2003);
Schwartz-Shea (2003).
This paper addresses this dearth by
broadly surveying a number of liberal arts and sciences colleges and universities across 10
Midwestern states (Illinois, Indiana, Iowa, Kansas, Michigan, Missouri, Minnesota, Nebraska,
Ohio, and Wisconsin) to determine how many political science programs structure their majors
in ways according to the recommendations made by the Wahlke report.
Literature
Since 1991, organizations and individuals in and outside of the political science community
have made several recommendations regarding the structure of the political science major.
Most noteworthy were the reports issued by the AACU on the Liberal Arts and Sciences and the
report produced by the APSA Task Force on Political Science (Wahlke 1991; see also Breuning, Parker, and Ishiyama 2001;
Ishiyama and Hartlaub 2003). These reports are very critical of
unstructured programs. The AACU report argued that only a consciously structured major that
entails sequential learning promotes the development of the “building blocks of knowledge
that lead to more sophisticated understanding” and critical thinking skills (AACU 1991, 24). The development of such thinking skills cannot be
accomplished “merely by cumulative exposure to more and more … subject matter” (AACU 1991, 24). Majors which emphasize breadth at the expense of depth result
in “shallow learning unless students also grasp the assumptions, arguments, approaches, and
controversies that have shaped particular claims and findings” (Wahlke 1991, 49).
Among the many recommendations made by the APSA task force report, three in particular
stand out:
- The undergraduate political science major should entail an
integrated and sequential course of study rather than a disconnected set of individual
courses. Such an integrated curriculum provides for sequential learning, with the knowledge
acquired in one course extended and developed in a subsequent course. A broad-based, common
introductory course to the major for incoming freshmen is a necessary first step to this
sequence of learning.
- The goal of the curriculum is to familiarize students with
the assumptions, methods, and analytical approaches of the discipline. This does not mean
requiring that political science students take statistics. Rather, students should be
exposed to the broad contours and logic of social scientific inquiry and familiar with the
assumptions, methods, and analytical approaches of the discipline (Wahlke 1991, 52). This recommendation requires that students enroll in a
course on research design and methodology, preferably fairly early in their collegiate
career.
- The curriculum should culminate in a “capstone experience” or equivalent
(Wahlke 1991, 52). This capstone course, such as a senior seminar
or a senior experience (not merely a senior thesis), should provide a broad synthesis of
what the student has learned during the course of the major, while offering a strong sense
of the context of different fields toward a greater appreciation of their methodological
strengths and weaknesses.
Evidence has emerged in recent years that illustrates the benefits of just such a
structured and sequenced political science major. A few studies have suggested a link between
curriculum structure and learning outcomes. Breuning, Parker, and Ishiyama (2001), for instance, demonstrated the value a structured and sequenced
curriculum has in promoting student learning. Other works suggest a relationship between the
structure of majors and the development of abstract and critical reasoning skills. Ishiyama
and Hartlaub (2003), in comparing two similar institutions, found
that graduates from a structured program are better at developing abstract and critical
thinking skills, and are better prepared for graduate and professional education. Further,
Ishiyama (2004, forthcoming), in a survey of 32 colleges and
universities, found a very strong relationship between the degree to which a political
science major program is structured and student knowledge, even when controlling for
plausible alternative explanations for student performance. The results support the notion
that majors that are characterized by a sequenced set of courses, the existence of a senior
seminar or capstone course, and a required research methodology course taken early in a
student's career better prepare political science students than do relatively unstructured
majors.
To what extent, then, do liberal arts programs at smaller colleges and universities in the
Midwest follow these recommended characteristics?
Method
To assess the various programs I first consulted the Carnegie classification system and
identified the masters I, masters II, and primarily baccalaureate liberal arts institutions
from 10 states in the Midwest (Illinois, Indiana, Iowa, Kansas, Michigan, Missouri,
Minnesota, Nebraska, Ohio, and Wisconsin) as the focus of this study. In total, I examined
285 institutions, out of which 193 (or 67.7%) reported offering a political science
major.2
A Political Science Major was defined as including
majors listed as “political science,” ”politics,” ”government,” and “political science and
international relations.” Not included were combination majors (such as “History and
Political Science” and “Politics and Sociology”) nor were interdisciplinary majors with a
concentration in political science. This is because the Wahlke report did not speak
directly to these majors, and we can thus expect them to be structured very differently
than purely political science majors.
(See
www.apsanet.org/ps/jan05/ishiyamalist/ for list of schools—for description of the
methodology see the Appendix).
To investigate the structure of the political science majors at these 193 colleges and
universities, I examined the web sites of the respective institutions. Since many students
narrow down their choice of colleges by examining their web sites as a prelude (or sometimes
alternative) to a campus visit, web sites are becoming an important tool for universities to
advertise and explain their majors. While deriving data from college and university web sites
may have its limitations (such as the inability to distinguish between what is officially
listed on the catalog as opposed to what is actually practiced in class) it also provides
important insights into each university's offerings, and is an efficient way to gather
comparative data. Although the actual content of a course may differ from its description on
a college or university catalog, the fact that a program does not publicly advertise
structure indicates a lesser degree of commitment to a structured major. Similarly, if a
program publicly advertises structure, then it indicates at least some commitment to the
concept of a structured political science major. Thus, reliance on data gleaned from course
catalogs represents a relatively efficient means to attain data on whether programs are
committed to adopting the recommendations of the AACU and APSA task force
recommendations.
Results
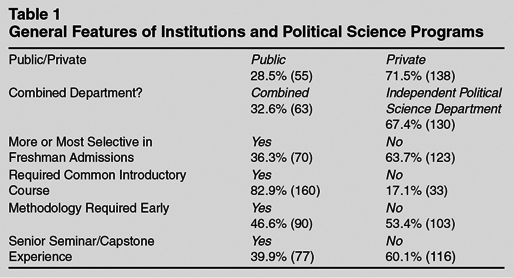
Table 1 reports some basic institutional characteristics, as well
as characteristics of the political science majors for the 193 colleges and universities
studied (for a full discussion of the methods employed see Appendix). Most of the schools
were private (71.5% of the total) and most of the political science departments were
independent (67.4% of the total), meaning they were not combined with other disciplines to
form a department (such as history or sociology, for example). Most of the political science
programs required a common introductory course (82.9%), less than half (46.6%) required a
research methodology course, and even fewer (only 39.9%) required a senior seminar/capstone
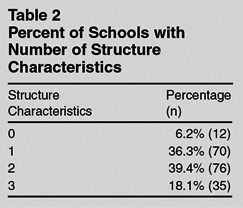
course. Even more striking is how few (18.1% or 35 of 193) of the programs employed all three
structure characteristics (common introductory course, required research methodology, and a
senior capstone course). Thus, it appears that only a small minority of the political science
programs surveyed in this study met the minimal structural recommendations made in the Wahlke
report.
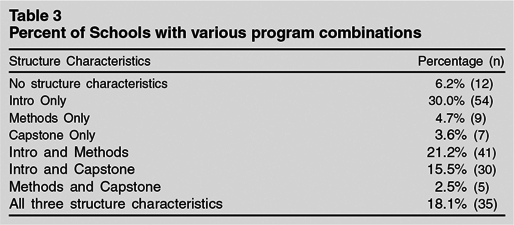
Table 3 shows that political science programs most commonly
require only a common introductory class (30.0% of the sample), followed by departments that
require both a common introductory course and a research methodology course (21.2%). These
patterns were often characterized by “distributional” requirements, where students had the
option of taking courses from required fields in addition to a common introductory course and
a methods course.
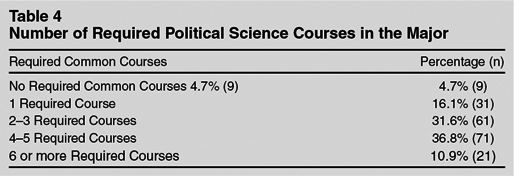
Table 4 reports the overall number of required courses (which may
or may not include a common introductory level course, a research methods course, or a senior
capstone course). Departments that require majors to take between four to five common courses
(71 or 36.8% of the total) are followed by programs that require two to three common courses
(31.6% or 61). Only 21 departments, or 10.9%, required six courses or more.
Which institutional features are associated with variations in political science program
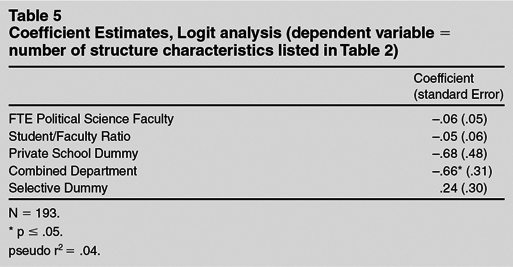
curricular design? Table 5 reports the results of a logit analysis
where the dependent variable is defined as the number of structure characteristics identified
in Table 2. This is regressed against several “independent”
variables, the size of the department (defined by the number of FTE political science
faculty), the institution's reported student/faculty ratio, whether the institution was
private or public, whether the political science program was administratively housed in a
“combined” department, and whether the institution was classified as “more” or “most”
selective by US News and World Report.
As indicated in Table 5, there is no discernable relationship
between the size of the department (political science FTE), the student/faculty ratio, and
the extent to which a political science major is structured. In addition, no difference
exists when comparing the structure of political science departments at private and public
institutions. Further, an institution's classification as either most or more selective was
unrelated to the structure of its political science program. The only independent variable
that exhibited a statistically significant relationship with the structure characteristics
dependent variable was whether the political science program is administratively housed in a
“combined” department. The sign of the coefficient (−.67) indicates that political science
programs that are administratively housed in combined departments are significantly less
likely to be structured than political science programs housed in exclusively political
science departments.
This finding makes some sense. There is likely much greater pressure in a combined
department to relax certain requirements (in many cases, methodology) to make the political
science major more congruent with its shared other discipline (such as history, which was the
most often major combined with political science). It may also be the case that political
science faculty recruited into combined departments are more inclined toward a vision of
political science as an eclectic and flexible discipline, a vision that may militate against
the adoption of curricular structures that (to many) may resemble a straight jacket.
Discussion and Conclusions
This study was designed primarily to survey the political science programs of 193
Midwestern colleges and universities to ascertain the extent to which they conformed to the
minimal structural features recommended by the Wahlke and AACU reports. In sum, only a small
proportion of programs have adopted the structural recommendations of those reports. This
finding is quite surprising (and somewhat troubling). Why don't undergraduate institutions in
the Midwest (a region where the emphasis on systematic and quantitative approaches to
political science is quite popular) follow even the minimal structural characteristics of
these reports?
It is far too early to present a full explanation here, but some of the results hint at
answers. Perhaps the structure of political science programs has to do with departmental
characteristics. For instance, the finding that political science programs that were
administratively housed in combined departments were less likely to be structured than those
housed in single discipline political science departments, suggests that introducing a
structured curriculum in combined departments may face special challenges. This finding has
some potentially important implications. For instance, the recent budgetary problems facing
many colleges and universities may increase the proportion of institutions which combine
their political science programs with other disciplines, with the result that even fewer
schools will follow the Wahlke recommendations in the future.
On the other hand, the fact that the institutional variables identified had little to do
with whether political science programs are structured along the lines of the Wahlke report
(especially with so little of the variance in the programs explained by the model, with the
pseudo r-square at .04) may suggest other reasons. For instance, it may be that political
science programs find the recommendations either inappropriate to their institutions, or
difficult to implement. Or it may be that political scientists at small liberal arts and
sciences institutions are wholly unaware of the Wahlke report. Examining these and other
explanations, however, will have to await further qualitative analysis (e.g., interviewing
programs that did not choose to follow the recommendations of these reports). Such research
really has to wait for a full review of the impact of the Wahlke report.
Over a dozen years later, there is little evidence to suggest that the recommendations made
by the AACU and Wahlke reports have been widely adopted by their primary audience:
undergraduate, liberal arts institutions. It is time for political scientists to revisit the
issue of how the political science major should be structured.
APPENDIX: Methodology
Each college and university that had a political science major was coded for both
characteristics of the major and of the institution. The major characteristics that were
coded included whether or not the political science major had: (1) a common introductory
course that was required of all majors; (2) a research methodology course; (3) a senior
seminar or capstone course.
The first characteristic, the presence of a common introductory course that was required of
all majors, was coded as a “1” if an introductory freshmen level course to political science,
introduction to American government, or world politics, was included in the required
curriculum. In some cases, students were afforded a number of choices or introductory
“tracks” (often differentiating between American politics and “world” politics—a euphemism,
no doubt, for comparative politics and international relations). However, under such
circumstances students are not exposed to a common introductory course to “political
science”—contradicting the recommendations made regarding the creation of a “structured”
major. If this were the case then it was coded as a “0.”
The second characteristic, the presence of a research methodology course taken relatively
early in a student's career, was coded as a “1” if a research methods course was included
and it was listed as a third-year level course or less. This could include a
non-political science course, as long as it exposed students to the logic of social science
research. On the other hand, a major that merely required students to take a statistics
course does not necessarily require students be exposed to the logic of empirical political
analysis or research design. Thus, if a major required that a student take a research methods
course, and this was listed as at least a junior-level course or lower (e.g., 300 level or
below) then this was coded as a “1.” Otherwise it was coded a “0.” This is because if a
research methods course is listed as a fourth-year course or higher then it signals to the
student that this course can be taken only near the end of a student's undergraduate
education.
The third characteristic, whether the curriculum included a senior seminar or capstone
course, was coded as a “1” if a clearly defined capstone course was identified (such as a
senior seminar course) in the political science section in the undergraduate catalog. This
did not include a senior thesis or directed research, because, although undergraduate
research promotes valuable skills for any student, such activities are not consciously
designed to provide a broad synthesis of what the student has learned during the course of
the major. A capstone experience should provide an opportunity for the student to get a
strong sense of the context of different subfields in political science, and to appreciate
their methodological strengths and weaknesses. A senior thesis experience is not generally
designed to accomplish these goals.
From these separate indicators, I created a composite measure of curricular structure (by
simply adding the number of structure characteristics). I did so because the Wahlke report
emphasized these characteristics as part of an integrated curricular package (so it would
make little sense to analyze each characteristic individually). As to the institutional
characteristics, data were collected on the number of Full Time Equivalent (FTE) faculty
lines that were available for the political science program (as an indicator of the size of
the program). In addition, to get some sense of the size of the school relative to the number
of faculty, I also collected data on student/faculty ratios. Third, I coded whether or not
the political science program was administratively housed in a “combined” department (such as
a Department of History and Political Science or a Department of Social Science, or
Behavioral Sciences).3
Departments that were listed as
“Political Science and International Relations” were coded as Political Science
Departments, given their common genealogy.
This provided some indication as to the
relative freedom political scientists have to construct their own curriculum. Fourth, I coded
a private school dummy variable, to determine if a difference existed between private and
public schools in the level of structure in their relative political science programs.
Finally, in order to discern the “quality” of the institution, I created a dummy variable of
whether or not the institution was classified as “most or more selective,” which was coded as
“1” for schools that were listed as either most or more selective, and “0” if otherwise by
America's Best Colleges (
US News and World Report,
2000). I used this measure rather than other indicators of quality (such as faculty
research productivity) because: (1) unlike other measures this was a classification
officially ascribed to the institution as opposed to being created based upon subjective
indicators and; (2) these institutions are more likely to market themselves as quality
teaching institutions, rather than research institutions.