INTRODUCTION
On Tunisian coasts, two species of mackerel are present: the blue or Atlantic mackerel (Scomber scombrus) and the shub mackerel (Scomber japonicus). In the official statistics of fishing in Tunisia, these species are generally confused but some differences in morphology, eco-biology and genetics are noted between these species. Thus, morphologically, we can simply distinguish between the two species by the number of the spines on the first dorsal, by the colour of the head which is transparent for the Scomber japonicus and especially by the bands on the dorsal region which are irregular for Scomber scombrus and rearranged in V for the S. japonicus. The period of spawning in Tunisia is from December to February for S. scombrus and from December to August for S. japonicus (Hattour, Reference Hattour2000). Molecular variance analyses showed a differential genetic structuring for the Atlantic mackerel (Scomber scombrus) and the shub mackerel (Scomber japonicus) (Zardoya et al., Reference Zardoya, Castilho, Grande, Favre-Krey, Caetano, Marcato, Krey and Patarnello2004).
In the western Atlantic, Scomber scombrus is present from Labrador to Cape Lookout (USA) and in the eastern Atlantic from Iceland to Mauritania, including the south-western Baltic Sea, the Mediterranean Sea and Black Sea.
The mackerel stock in the eastern Atlantic includes currently three main stock units (southern, western and North Sea). The southern component spawns in Spanish and Portuguese waters, and the western component spawns in the Bay of Biscay and northwards around Ireland and west/north-west of the UK. Whereas, the eastern Mediterranean populations (Greece and Italy) are separated genetically from the western Mediterranean stock (Barcelona) (Zardoya et al., Reference Zardoya, Castilho, Grande, Favre-Krey, Caetano, Marcato, Krey and Patarnello2004).
The mackerel is a migratory species. After spawning, adults of the north-east Atlantic (southern and western components) migrate during the second half of the year to the feeding areas (Norwegian Sea and North Sea), and then return to the spawning areas at the beginning of the following year (Rankine & Walsh, Reference Rankine and Walsh1982).
The stock assessment of a migratory population needs updated data for all its habitats during its biological cycle. The literature shows that this species is not equally studied in all its habitats. Most studies concerning the blue mackerel are undertaken in the Atlantic and there are only a few studies in the Mediterranean.
The ageing and growth parameter estimations are fundamental prerequisites for the stock assessment. In order to achieve a sustainable management of the fisheries, several works have studied the mackerel growth: Kandler (Reference Kandler1957); Nedelec (Reference Nedelec1960); Aker (Reference Aker1961); Castelló & Hamre (Reference Castelló and Hamre1969); and Postuma (Reference Postuma1972) in North Sea and Skagerrak; Gordo et al. (Reference Gordo, Martins and Jorge1982); Cort et al. (Reference Cort, González and Ilardia1986); De la Hoz & Villegas (Reference De la Hoz and Villegas1987); and Lucio (Reference Lucio1997) in the South Atlantic; and Villamora et al. (2004); and Robert et al. (Reference Robert, Castonguay and Fortier2007) in the north-east Atlantic. However, only a few studies have been undertaken for the growth of the blue mackerel in the Mediterranean: Andreu & Rodriguez-Roda (Reference Andreu and Rodriguez-Roda1953) in Spain; Djabali et al. (Reference Djabali, Boudraa, Bouhdid, Bousbia, Bouchelaghem, Brahmi, Dob, Derdiche, Djekrir, Kadri, Mammasse, Stambouli and Tehami1990) in Algeria; and Hattour (Reference Hattour2000) in Tunisia.
The blue mackerel Scomber scombrus is an abundant pelagic species caught in different regions of Tunisia. In general, around 80% of the total landings come from pelagic fisheries whose catches of about 15% are represented by the blue mackerel alone, which represented in 2006 about 4850 tons. According to the General Direction of Fishing and Aquaculture in Tunisia (DGPA), almost half of the total landings in 2009 were composed of pelagic species. Generally speaking, the production is always fluctuating from year to year, with a general decreasing tendency. For instance, the national production of pelagic species registered by the DGPA for 2004 is about 25000 tons distributed differently during the year with a maximum in summer (June, July and August).
Several fleets and gears exploit seasonally the mackerel resource in Tunisia including purse seine, trawl and gillnet. But the majority of landings are carried out using a locally named technique (fire fishing) which uses a purse seine as a gear and a source of light to attract fish by night.
The stock assessment of fisheries requires in general specific studies on species ageing and growth characteristics which are currently missing in Tunisia, except perhaps the study of Hattour (Reference Hattour2000) which used the whole otolith. Our study is the first work using the micro-increments in ageing the blue mackerel in Tunisia.
The aim of this paper is to study the growth of the blue mackerel on Tunisian east coasts using the otolith microstructure. We intend to establish the relationship between the somatic growth and the length for males and females of the blue mackerel and to estimate the parameters of the Von Bertalanffy equation describing the age–length relationship needed in the stock assessment.
MATERIALS AND METHODS
Sampling and laboratory procedures
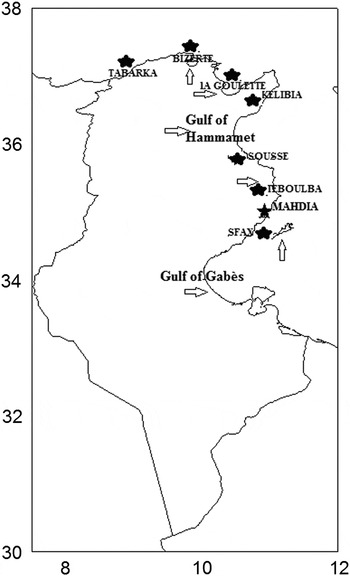
From September 2004 to January 2006, monthly samples were undertaken from catches coming from the three fish zones in Tunisia, the North zone (Tunis and Bizerte), the East zone (Monastir and Hammamet) and the South zone (Gabès and Kerkennah) (Figure 1). Biological analyses were carried out on 320 specimens (172 females, 148 males and 36 undetermined) of the blue mackerel for estimating the age and in 366 individuals to determine the weight–length relationship. Thus, only commercial sizes were studied.
Most blue mackerel samples were analysed fresh. The fork length and the wet weight were measured. The sex was determined by macroscopic examination of the gonads and sagitta otoliths removed.
Otoliths were cleaned carefully with alcohol and dried with absorbent paper. Then, they were successively covered with resin, cut at 0.4 mm near the nucleus and polished on both sides using 30 µm, 3 µm, 1 µm and 0.25 µm metallurgical lapping films to obtain a thin layer allowing the visualization of the hatch mark and the initial growth rings. The number of increments was counted at 1000* using a microscope connected to an Image-analyser system with a digital camera (Visilog, TNPC Software, v.3.2, Ifremer, France). The age was estimated by interpreting and counting micro-increments on the otoliths.
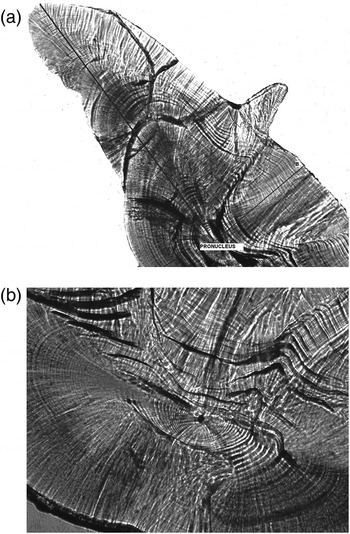
The number of rings was counted twice from the more prominent dark check on the axis A (Figure 2). A third counting is carried out if the two first countings are different, and the repeated value is retained. If there is no repetition, the otolith is rejected and the axis B is used instead.
Map of the study area showing sampling regions (indicated by arrows).

Sagittal otoliths of the Tunisian mackerel Scomber scombrus at 1000 × 8 magnification: (a) Counted increments and axes used (A: principal axis and B: secondary axis); (b) position of the nucleus.

Sagitta otoliths were also extracted from 338 individuals, of which only 320 otoliths were clear to read.
Data analysis
The Von Bertalanffy equation used in stock assessment is a length–age key:
 $$Lt = L_{\infty} \lsqb 1 - \exp \lpar -k \lpar t - t0\rpar \rpar \rsqb$$
where L t is the mean fork length at age t, L ∞ the asymptotic mean length, k is the growth parameter and t 0 is the theoretical age at zero length. The growth parameters were calculated for the two sexes separately and combined.
The growth curve shape which is determined by the values of L ∞, k and t 0 was established using the software Statistica 11.0 and the non-linear iterative regression analysis, and growth curves were compared between sexes by the Student's t-test.
The index of performance (Fi) was also calculated using the following formula:
 $$\Phi_{\iota} = \log_{10} \lpar \hbox{K}\rpar + 2\,{\ast} \log_{10} \lpar \hbox{L}_{\infty}\rpar$$
RESULTS
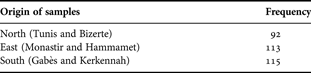
Mackerel samples used were equally distributed in the three regions among the Tunisian coasts (Table 1). The number of males was 112 and the number of females was 172 individuals. The 36 undetermined individuals were counted also for males and females.
Distribution of samples of the blue mackerel in the three Tunisian regions.

Sagitta otoliths were selected for growth analyses and they have a small size (not exceeding a few mm) (Figure 2). Daily deposition of increments were not considered in this study, but it was assumed to be related to other studies on the Atlantic blue mackerel such as those of D'Amours et al. (Reference D'Amours, Landry and Lambert1990), Villamora et al. (2004) and Mendiola & Álvarez (Reference Mendiola and Á'lvarez2008).
The interpretation of the daily increments in the majority of the sample is realized in the axis A. The use of micro-increments is easier than macro-increments on a whole otolith.
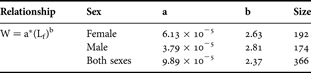
The relationship between length and weight of Scomber scombrus was determined for the two sexes separately and combined (Table 2). It showed a non-isometric relationship for males, females and sexes combined with a length growth faster than weight in the three cases (b < 3).
Relationship between weight and length for the Tunisian blue mackerel. W, total weight; Lf, fork length.

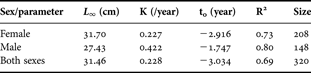
The age–length relationships determined by the Von Bertalanffy equations for the two sexes separately and combined are illustrated in Table 3.
Von Bertalanffy growth parameters for the blue Tunisian mackerel (L ∞, k and t 0) and equation for male, female and sexes combined.

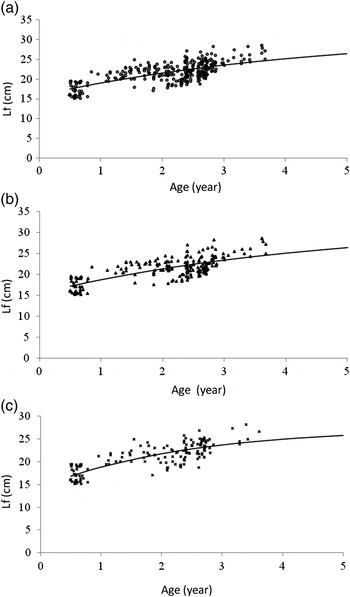
The t-test indicated that males and females have not a significant difference in growth (P = 0.19 > 0.05) (Figure 3). But the index of performance (Fi) showed that males reached the L∞ more rapidly than females (Ffemale = 2.358 and Fmale = 2.502).
The Von Bertalanffy growth curve length–age for both sexes (a), female (b) and male (c) of the blue mackerel for the 2004–2006 period.

DISCUSSION AND- CONCLUSION
The acoustic survey undertaken within the framework of an FAO project aboard a commercial trawler has shown the presence in Tunisian waters until the −100 m-isobath of an important potential of small pelagic fish, sardine (Sardina pilchardus) and mackerel (Scomber scombrus and Scomber japonicus) (Hattour, Reference Hattour2004). Between −100 m and −180 m, the pelagic fish stock is less exploited essentially for the mackerel. However, between −180 m and –300 m, the saurel and the mackerel are particularly abundant, but not wholly exploited.
The study carried out by Hattour et al. (Reference Hattour, Ben Abdallah and Guennegan2004) made a case for the possibility of non-reasonable exploitation of the small pelagic fish. It showed also the appreciable potential of these species in the Tunisian fisheries but that these species are not well exploited, especially on the southern coasts of Tunisia (Gulf of Gabès).
In order to evaluate and manage these stocks, biological parameters are needed, especially growth-related parameters. The evaluation of ageing fish can be undertaken by different methods, such as scalimetry and otolithometry. For Scomber scombrus, ageing using whole otoliths is a delicate method due to the small size and the opacity of the sagitta. But, this method gives generally reliable results for the blue mackerel (Robert et al., Reference Robert, Castonguay and Fortier2007). Scales are more difficult to prepare but easier to use (Dawson, Reference Dawson1991). Thus, the formation of scales is not immediately after blossoming and regenerated scales, which are abundant for blue mackerel, and are not useful in studies of ageing. We have tested some scales but for the reasons cited below and because of the small size of them we have preferred otoliths. On the whole otoliths, opaque rings were not so visible because of the thickness of sagitta. So we have chosen the microstructures on otoliths which are more visible by transparency (D'Amours et al., Reference D'Amours, Landry and Lambert1990).
In the present study, we have estimated the age of the Tunisian blue mackerel by analysis of the sagitta microstructure. We suppose that one increment corresponds to one day referring to validations made for the blue mackerel in the Atlantic by Mendiola & Álvarez (Reference Mendiola and Á'lvarez2008).
This study is the first to use microstructures of sagitta otoliths for the estimation of the age and the growth of the blue mackerel in Tunisia.
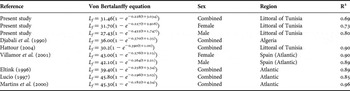
Parameters of the Von Bertalanffy equation obtained in this study were compared with other works carried out on the same species in the Atlantic and in the Mediterranean and which used the whole otoliths or the sagitta microstructure. Thus, the growth curve of the Tunisian blue mackerel determined in this study seems to confirm the results obtained by Hattour (Reference Hattour2004) in Tunisia using whole otoliths. But, these results seem to be lower than those obtained for the same species in the Atlantic (Eltink, Reference Eltink1996; Lucio, Reference Lucio1997; Martins et al. Reference Martins, Á'lvarez, Cotano and Martins de Murguía2000; Villamor et al., Reference Villamor, Abaunza and Fariña2001) (Table 4). This could be especially due to the difference of the productivity and the climatic parameters since the blue mackerel prefers cold waters.
Comparaison of Von Bertalanffy parameters from different regions for Scomber scombrus. R2, coefficient of determination.

In the Mediterranean, only a few results are given by Andreu & Rodriguez-Roda (Reference Andreu and Rodriguez-Roda1953) in Spain and by Djabali et al. (Reference Djabali, Boudraa, Bouhdid, Bousbia, Bouchelaghem, Brahmi, Dob, Derdiche, Djekrir, Kadri, Mammasse, Stambouli and Tehami1990) in Algeria and they are comparable with the present results (Table 4).
Despite an abundant literature studying the growth of the north-east Atlantic mackerel, only few works have compared the growth between males and females. In Tunisia, no published study has raised this comparison to date.
The growth of the blue mackerel varies with age, but is more important for the juvenile stage.
Villamor et al. (Reference Villamor, Abaunza and Fariña2004) indicate that in the first 3 years of life neither of the sexes dominated in terms of the growth rate, and the differences between lengths were not statistically significant. For the few individuals older than 4 years, females were significantly longer than males.
The Tunisian blue mackerel is an appreciable species belonging to the Scombridae known by their migration. The stock assessment of this species needs the collaboration of different countries because of its migratory behaviour. The study of growth is needed in models of evaluation of the stock of exploited fishes. This function, well described by the Von Bertalanffy equation has been established using ageing on the sagitta otoliths microstructures.
Although the use of micro-increments in ageing the blue mackerel has been successful, it will be judicious in the future to analyse the growth by studying the micro-chemical composition of otoliths. Several studies on other species have demonstrated that the micro-chemical composition of otolith is correlated with the biotope of the species. Thus, it will be more useful to evaluate the migration of the mackerel for a real stock assessment.
Our samples come from three different regions, and only Mahmoudi (Reference Mahmoudi2005) has compared the growth of the blue mackerel in these regions. He demonstrated that the growth of the stock of the eastern region (Monastir and Hammamet) is significantly different from the growth of the stock of the North and the South of Tunisia. However, this conclusion concerns only mackerels of more than 1 year, because juveniles are not sampled, which could bias the results, or these results could be better adjusted to a Gombertz model (Cotano & Á'lvarez, Reference Cotano and Alvarez2003).
In the Atlantic, Martins (Reference Martins2007) showed a significant difference between year-classes in terms of weight at length for males, females and both sexes. We need also to study further the annual variability of growth in Tunisian and Mediterranean waters.