I. INTRODUCTION
X-ray diffraction (XRD) methods have a central role in materials science since its foundation. Powder diffraction provides not only crystallographic structures of materials and mixtures of phases but also size and microstrain information about the constituent grains. Powder diffraction depends on getting a sufficiently accurate average over many grains of the sample. A newer method, introduced to exploit the relatively high coherence of the X-ray beams generated at the latest synchrotron sources, called Bragg coherent diffractive imaging (BCDI), attempts to undo this powder average and examine the size and strain information separately from each individual grain. It therefore has the advantage of being much more specific in providing a 3D image of the grain and a projection of the strains present inside it, but loses the averaging capability of powder diffraction. Here we apply BCDI to an important question in materials science, the structure of the crystalline grains formed after heating an amorphous material, an iron-based metallic glass.
BCDI depends on the coherence of the X-ray beam diffracting from a small crystal being sufficient to cause phase interference between the diffracted beams from all parts of the sample. Interference from the boundaries of the crystal is responsible for the appearance of strong fringe patterns in the place of the traditional Bragg spots. The fringe pattern is related to the structure of the crystal through a Fourier transform relationship and therefore has a “phase problem” associated with inverting the diffraction into a real-space image. This phase problem can be solved using algorithms based on the idea that the diffraction can be “oversampled” with respect to its spatial Shannon frequency, as proposed by Sayre in 1952. Reference Sayre1 When averaged over a large enough number of grains, these interference patterns revert to the classical powder diffraction peak shape, with the customary reciprocal relationship between the peak width and the crystal size, as provided by the Scherrer formula. But the ability of BCDI to obtain real-space 3D images is lost by this averaging.
BCDI is measured with a specialized diffractometer at one of the beamlines of a third generation synchrotron radiation source. The beam is made spatially coherent with the use of slits and temporally coherent with a narrow-band monochromator. The sample is centered in this beam using a piezoelectric positioning system. By rocking the crystal through its Bragg condition, one can observe that this fringe pattern extends to three dimensions. Reference Williams, Pfeifer, Vartanyants and Robinson2 This three-dimensional (3D) pattern of fringes is the magnitude squared of the Fourier transform of the crystal shape, in an appropriately chosen coordinate system. Reference Pfeifer, Williams, Vartanyants, Harder and Robinson3 It also contains information about any distortions of the crystal lattice due to the presence of strain. If the X-ray detector is far enough away from the sample, the fringe pattern surrounding each Bragg peak can be oversampled with respect to the Nyquist–Shannon limit and so the diffraction pattern can be inverted, Reference Sayre1 using support-based iterative phasing algorithms, Reference Robinson and Harder4 to create a real-space image of the crystal, which is generally a 3D complex function. The amplitude of this image represents the “Bragg density” which measures the diffracting strength of that region of the crystal; this is often just the electron density of the crystallized material, but it can be reduced by the presence of lattice disorder or defects. The phase of the image represents a projection of the local displacement of the crystal along the direction of the momentum-transfer vector, Q, used for the measurement Reference Robinson and Harder4 ; it therefore images the strain fields present in the crystal.
Since the first discovery of metallic glass (MG) by Klement and his colleagues using splat-quenching technique, Reference Klement, Willens and Duwez5 various kinds of MGs with different glass forming capabilities have been synthesized with the development of higher cooling rate treatment methods. Fe-based MGs, due to their relatively low cost and excellent mechanical and magnetic properties, attract lots of interest from both science and engineering. To further broaden their industrial applications, bulk metallic glass (BMG) with sizes up to 16 mm have been made. Reference Shen, Chen, Sun, Fan and Wang6 While the absence of dislocations and other lattice defects often leads the MG materials to ultrahigh strength, they have little global plasticity and hardness. For example, the compressive strength of Fe-based BMG can reach 4000 MPa, Reference Inoue, Shen and Chang7 however its plastic strain is usually below 0.5% at room temperature. Recent attempts to design Fe-based BMG with improved ductility have been done, however, their performance is still far from desirable, with 3.6% compressive plastic strain in Fe71Mo5P12C10B2 Reference Gu, Poon, Shiflet and Widom8 and 5.2% in Fe40Ni40P14B6. Reference Yao and Zhang9
To bypass this problem, Fe-based amorphous metallic coatings (AMCs) were developed because brittleness is not a limitation for coatings and can be a desirable quality. By various treatments including plasma spraying, Reference Kobayashi, Yano, Kimura and Inoue10–Reference Huang, Guo, Fan and Shen12 laser cladding, Reference Wu and Hong13 electric-spark deposition, Reference Liu, Gao, Li, Zhang and Hu14 cold gas dynamic spraying, Reference Ajdelsztajn, Jodoin, Richer, Sansoucy and Lavernia15 explosive welding, Reference Liu, Liu, Chen, Wang, Yan and Li16 wire arc spraying, Reference Cheng, Liang, Xu and Wu17,Reference Cheng, Liang, Xu and Wu18 and thermal spraying including high velocity oxygen fuel (HVOF) spraying and high velocity air fuel (HVAF), Reference Wang, Zheng, Ke, Sun, Hou, Chang and Wang19–Reference Zhu, Qu, Wang and Zou24 many functional Fe-based AMCs have been produced. These AMCs show excellent corrosion and weather resistance, strong hardness, and good hydrophobic properties. Reference Zhou, Wang, Wang, Zhang, Liu and Xu20 Especially HVAF treated products, with their relatively cheap price and high mechanical and corrosion performance, are attracting strong interest recently. Reference Guo, Zhang, Chen, Yang, Li and Liu25,Reference Wang, Xing, Luo, Rahman, Jiao, Qu, Zheng and Shen26
Because of the inherent metastability of amorphous matter, Fe-based AMCs produced by thermal spraying are expected to contain a limited portion of crystallized “glass” within their “amorphous” matrix materials. The crystallization in this process could be derived from several mechanisms involving the “hitting” of the sprayed particles on the target. One of them is the so-called “over hitting” since continuous hitting to build up a “thick” deposit generates huge amount of heat, which could partially recrystallize the amorphous MGs in the coatings. Reference Chokethawai, McCartney and Shipway27 Devitrification of Fe-based AMCs tends to weaken their corrosion resistance, for example; studies show that an increasing amount of crystallized material in the Fe48Cr15Mo14C15Y2B6 based AMC deteriorates corrosion resistance sharply, by 5 and 17-fold in coatings with 79 and 39% amorphous fraction, compared with fully amorphous based coating. Reference Yang, Zhang, Peng, Yu and Liu28,Reference Liu and Zhang29 On the other hand, devitrification can enhance some mechanical properties, Reference Cheng, Liang and Xu30 in the Fe-based AMCs, nanocrystallites formed within the amorphous matrix enhanced the hardness of the coatings. However, further grain growth led to a subsequent decline in hardness. Reference Kishitake, Era and Otsubo31,Reference Blagojevic, Minic, Zak and Minic32 The mechanism of these nanocrystalline effects is still an open question to be addressed in this work. Some studies attribute to the increasing of hardness to nanocrystallite grains, which may have higher critical stress levels Reference Mishra, McFadden, Valiev and Mukherjee33 or a disability to support dislocation pileups. Reference Weertman, Farkas, Hemker, Kung, Mayo, Mitra and Van Swygenhoven34 Others ascribe this to solute enrichment of remaining amorphous matrix. Reference Greer35
Fractal theory, introduced by Mandelbrot in 1977, is a useful conceptual tool to describe nonlinear behavior in dynamical systems. Various works have been carried out to study the formation of fractal structures and extend their applications in many fields, especially materials science. Models such as diffusion-limited aggregation (DLA), Reference Witten and Sander36 cluster–cluster aggregation model, Reference Meakin and Wasserman37 and the Kardar–Paresi–Zhang (KPZ) growth model Reference Kardar, Parisi and Zhang38 were introduced to explain structure and its evolution far from equilibrium. All these studies depend on the central concept of fractal dimension (FD), which is widely used to study surface roughness and growth type. FD appears to be a powerful parameter to quantitatively characterize the fractal property. Chen et al. studied the worn surface of a Fe-based alloy coating and used FD to describe its surface morphology. Reference Chen, Wang, Ma, Kang and Xu39 Chang et al. used FD to analyze fracture surface morphologies and found a linear relationship between fracture roughness and the square root of the FD increment. Reference Chang, Chen, Ru, Yue, Yu and Zhang40
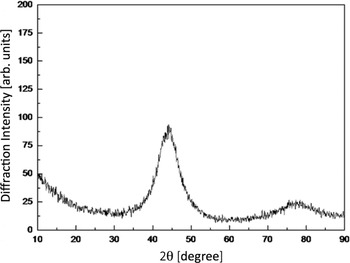
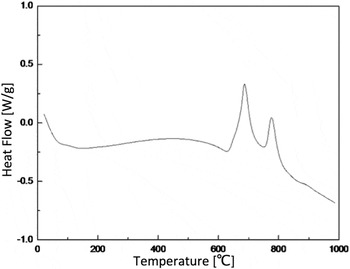
To understand the crystallization of Fe-based MGs as well as its morphology and role in AMCs, Fe-based amorphous alloys with nominal composition of Fe49.7Cr18Mn1.9Mo7.4W1.6B15.2C3.8Si2.4 were produced and annealed at different temperatures, and then Bragg coherent diffraction imaging (BCDI) experiments were conducted on them to investigate the crystallization within the annealed material. The powders were produced via high-pressure Ar gas atomization method. Firstly, pure elements of Fe, Cr, Mn, Mo, W, B, C, and Si with 99.9 wt% purity were mixed and then induction melted in an Argon atmosphere. The molten alloy was atomized by inert gas jets into fine metal droplets and then formed into powders. This cooling rate was sufficient to preserve the amorphous state, as seen in the X-ray diffraction (XRD) pattern in Fig. 1, measured using a D/MAX2550VB3 (Rigaku Corporation, Tokyo, Japan) with Cu Kα radiation. The size distribution of the samples, measured with scanning electron microscopy, was found to be mostly between 10 and 30 µm in diameter. The differential scanning calorimetry (DSC) in Fig. 2 was measured using an MDSC-Q100 instrument in an Argon atmosphere at a heating rate of 20 K/min.
Powder X-ray diffraction (XRD) scan of the Fe-based amorphous alloy material used for this study. The sample has a nominal composition of Fe49.7Cr18Mn1.9Mo7.4W1.6B15.2C3.8Si2.4. Conventional Cu-K wave length X-rays (1.542 Å) were used, for which the first α-Fe (110) Bragg peak would appear at 45°. Good amorphous sample quality is seen.

Differential scanning calorimetry (DSC) trace of the Fe-based amorphous alloy material used for this study. The sample has a nominal composition of Fe49.7Cr18Mn1.9Mo7.4W1.6B15.2C3.8Si2.4. Clear exothermic peaks are seen at around 682 °C (T X1) and 774 °C (T X2).

II. RESULTS
A. Amorphous characteristic of Fe-based MG
Figure 1 presents the X-ray powder diffraction pattern of the Fe-based amorphous alloy powders measured in this work. A broad halo peak appears in the 2θ range of 30–50° confirming the amorphous nature of the prepared material. Figure 2 shows differential scanning calorimetry (DSC) curve of the Fe-based alloy. The glass transformation temperature and crystallization temperature are around 579 °C and 628 °C respectively. It can also be seen that there are two exothermic peaks, which indicates a two-stage crystallization process, around 682 °C (T X1) and 774 °C (T X2). According to Köster et al. Reference Köster and Harold41 and many studies afterward, the product of primary crystallization at T X1 is usually a supersaturated α-Fe type phase while product after T X2 is an intermetallic phase such as Fe2B, Fe23B6. For our samples, the peak separation was about 92 °C, therefore it was enough for us to prepare primary crystallized phase without forming intermetallic phase by thermal annealing.
B. BCDI experiment and reconstructed images
For the current BCDI investigation, samples were prepared by attaching to a silicon wafer substrate using tetraethyl orthosilicate (TEOS) as a bonding agent. Reference Monteforte, Estandarte, Chen, Harder, Huang and Robinson42 Upon calcining at 300 °C for 2 h, TEOS is converted to SiO2 and was found to immobilize the samples against motion in the focused X-ray beam. The samples were annealed in air in a laboratory furnace at 700 and 750 °C. The annealing temperatures are chosen right between the two exothermic peaks of the DSC. Most of the results discussed below were for samples annealed at 750 °C, which were safely in the α-Fe phase.
Samples were centered on the primary rotation axis of the diffractometer at beamline 34-ID-C of the advanced photon source (APS). A focused coherent X-ray beam of 9 keV was selected to illuminate the samples. The focal spot size was 600 × 800 nm, significantly larger than the grains being imaged. The penetration depth was approximately 5 µm, sufficient to reach the interior of the particles below the depth of any oxidized region on their outsides. The coherence of the beam was set by a 100 µm horizontal slit at 26 m from the source, followed by a set of 30 × 60 µm2 (H × V) slits at 50 m, just in front of the Kirkpatrick Baez (KB) focusing optics. The Si (111) double crystal monochromator provided an incident coherent beam flux around 109 photons per second in the focal spot. A MediPix area detector with 55 μm pixel size was positioned on the diffractometer arm at a distance of 0.53 m from the sample. The strongest Bragg peak was found at 39.7°, which is the (110) peak of pure α-Fe at 9 keV. The 3D diffraction patterns acquired by BCDI measurement were used to reconstruct 3D images through a combination of error reduction (ER) Reference Fienup43 and hybrid input–output (HIO) Reference Fienup44 algorithm. Shrink-wrap (SW) Reference Marchesini, He, Chapman, Hau-Riege, Noy, Howells, Weierstall and Spence45 and GHIO (Guided HIO) Reference Chen, Miao, Wang and Lee46 methods were also applied to help the algorithms to converge.
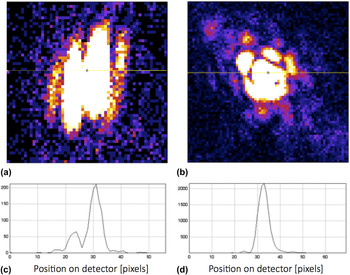
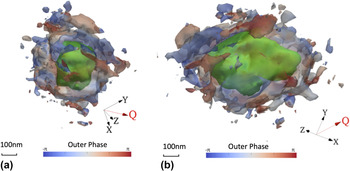
Examples of the diffraction patterns obtained at the α-Fe Bragg peak are shown in Fig. 3. From the spacing of the fringes seen in Figs. 3(c) and 3(d), the sizes of crystals formed after 700 °C and 750 °C annealing were 60 nm and 330 nm respectively. This difference in dimension can be understood from the increasing temperature in heat treatment that can lead to a higher diffusion rates and hence crystal growth rate. Figure 4 shows isosurface views of the reconstructed 3D images of crystal formed after annealing at 750 °C. The structure reveals two distinct regions: a compact, solid core, colored green and shown at a 50% contour level of the image amplitude (Bragg electron density) and a porous surface-region surrounding it, at a 6% contour level. The surface region is colored by phase using the color scheme indicated at the bottom of the figure. Various values of the phase are seen in the porous outer region, indicating the presence of strains there. The density is connected in a way that resembles a dendritic outer layer on the exterior of the crystals.
Coherent X-ray diffraction patterns measured from nanocrystallites found after recrystallization of the amorphous alloy sample at (a) 700 °C and (b) 750 °C for two hours. The intensity is deliberately saturated in the center to show the pattern of coherent diffraction fringes outside. Horizontal cross sections through the patterns, indicated with lines in (a) and (b), are shown in (c) and (d). From these sections the nano-crystal sizes have been estimated.

Isosurface views of the reconstructed image of crystal, annealed at 750 °C for two hours. The isosurfaces have been colored according to the phase values found for the image, representing strain. The inner contour shows the compact core of the crystal, while the outer contour shows the rough shape of the porous surface layer.

C. Identification of fractal structure
Our BCDI experiment measured the α-Fe crystallites in an intact state grown within an amorphous MG matrix, through which the 9 keV X-rays can penetrate. We note that the contrast between crystal and less-crystallized material all comes from its crystalline signal in the Bragg peak. Such imaging would be very difficult by electron microscopy (EM) because the sample preparation would probably disturb the delicate surface structure of the crystals. However, the resolution of the reconstructed X-ray images is only around 50 nm. At this resolution level, detailed information on the surface of materials is not available.
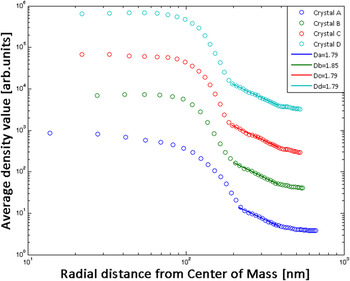
The nature of the porous external structure is best seen by further analysis of the curves in Fig. 5. We extracted radial density functions by histogramming the image amplitude in bins of radial distance, r, from the center of mass of the density, plotted on a log–log scale. The porous structure at the surface of the nano-crystallites is identified as a linear decay of density with radius on this log–log plot. Three of the four crystals imaged after annealing at 750 °C showed the same equiaxed, compact core of uniform high density surrounded by a porous network of crystalline structure, resembling a dendrite. The fourth crystal had two protruded tips and is elongated perhaps by a double nucleation event. All show the same linear decay of density with radius in the outer porous region, whose slope can be identified as the fractal dimension (FD) of the dendrite.
(a) Radial histogram of the Bragg density (image amplitude) maps of four reconstructed crystallites, annealed at 750 °C for two hours. The radial distance is plotted from the center of mass of the crystal averaged over all three dimensions. Log–log plots, offset along the vertical axis (one order magnitude between each other), are used to show the crossover from the compact core to the fractal surrounding region. (b) Enlargement of the fractal region showing the best fit linear regression curves used to extract the exponents.

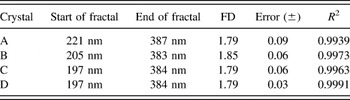
As seen in Fig. 5(a), the 3D radial density function has two clear slopes at the surface of the crystal with the second slope much more gradual than the first one. The sharp slope probably represents the boundary of the compact core while the gradual slope probably comes from the porous fractal structure in the surface region surrounding it. Figure 4(b) and Table I show the FDs (second slope) extracted by least-square procedure. The presence of systematic error in the FD values can be observed from the fact that the pure fitting errors listed are smaller than the scatter between the fitted FD values.
Fractal dimensions (FDs) of surface region determined for the four different crystals shown in Fig. 5.

The FD values of the four crystals range from 1.79 to 1.85, which is in good agreement with the predictions of the DLA model. Reference Witten and Sander36 These large and reproducible values of the FD found are probably connected with the presence of significant surface roughness, which can be seen also in the real-space image in Fig. 4.
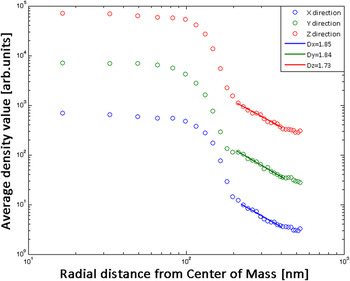
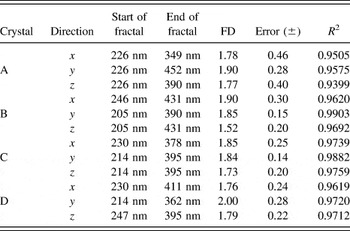
To confirm that the fractal structure is isotropic, we extracted 2D radial density functions by the very same method in Fig. 6 and find a similar 2-slope result. The FDs extracted from the slopes in the x, y, and z directions are shown in Table II. It can be seen that these crystals have similar FDs in all 3 directions. This demonstrates the spherical symmetry of the crystals in the reconstructed images, suggesting they are in the same growth mode and have close to the same growth rate in all directions.
Radial histogram of the Bragg density (image amplitude) maps of crystal C, annealed at 750 °C for two hours. The radial distance is plotted from the center of mass of the crystal averaged over two-dimensional slices in the x, y, and z directions.

Fractal dimensions (FDs) of surface region determined for two-dimensional (2D) slices across the same four crystals.

III. CONCLUSIONS
Fe-based amorphous alloy samples with composition Fe49.7Cr18Mn1.9Mo7.4W1.6B15.2C3.8Si2.4 were prepared and annealed at 700 and 750 °C. A Bragg coherent diffraction imaging (BCDI) experiment was carried out to investigate the crystallization behavior and visualize the nano-sized crystals that formed after annealing. Based on discussion and results above, the following conclusions can be drawn:
-
(1) The Fe-based amorphous alloy experiences a two-stage crystallization upon annealing. The product of primary crystallization is pure α-Fe. The sizes of these crystals were found to be around 60 nm after annealing at 700 °C and about 330 nm after annealing at 750 °C. The BCDI reconstructed images of the crystals formed after 750 °C annealing show a compact, typically equiaxed central core with an unstrained structure, surrounded by a porous, strained outer region.
-
(2) Radial density functions appear to show a solid core and fractal exterior. Fractal dimensions (FD) could be extracted in the surface regions. In our three-dimensional analysis, the FDs range from 1.79 to 1.85, and show good fractal behavior as a linear dependence of density with radius on a log–log plot. Analysis of two-dimensional cross sections showed FDs ranging from 1.66 to 1.90. It is believed that these crystals have solid, compact cores and isotropic fractal surface regions.
-
(3) The fractal structure observed for the recrystallized amorphous alloy may be consistent with a diffusion limited aggregation (DLA) description in which an initial nucleus promotes crystallization of the neighboring regions in a diffusive manner. It may also relate to the observation of fractal growth kinetics in the time domain, as reported from DSC of CuZr. Reference Lad, Maaroof, Raval and Pratap47
ACKNOWLEDGMENTS
This work was supported by the UK Engineering and Physical Sciences Research Council (EPSRC) grant EP/I022562/1 “Phase modulation technology for X-ray imaging”. Work performed at Brookhaven National Laboratory was supported by the US Department of Energy, Office of Basic Energy Sciences, under Contract Number DE-SC00112704. Work at TongJi University was supported by the Talent Program “Materials Nano-structure” with grants 152221 and 152243, National Natural Science Foundation of China grants 51371127 and 51274151 as well as Shanghai Natural Science Foundation grant 13ZR1462400. The experimental work was carried out at Advanced Photon Source Beamline 34-ID-C, built with funds from the US National Science Foundation under Grant DMR-9724294 and operated by the US Department of Energy, Office of Basic Energy Sciences under Contract DE-AC02-06CH11357. We thank Ross Harder and Evan Maxey for assistance with the beamline.