INTRODUCTION
Septoria diseases occur throughout the world and affect a number of crops. Leaf blotch (Anamorph: Septoria tritici Roberge in Desmaz. Telemorph: Mycosphaerella graminicola (Fuckel) Schröter) and glume blotch (Anamorph: Stagnospora nodorum (Berk.) Castell. & Germano; Teleomorph: Leptosphaeria nodorum E. Müler) of wheat are among them (Agrios Reference Agrios1997). Septoria diseases represent the primary pathogenic constraint on wheat production of England and Wales (Polley & Thomas Reference Polley and Thomas1991) and S. tritici has become dominant over S. nodorum since the 1980s (Leitch & Jenkins Reference Leitch and Jenkins1995). The change in the proportions of the two pathogens has resulted in the development of epidemics of disease in summer, whereas previously they occurred mostly in winter and early spring followed by a decline in summer (Royle et al. Reference Royle, Shaw and Cook1986). The widespread occurrence of strains of S. tritici resistant to methyl benzimidazole carbamates fungicides is suspected to be one of the reasons for later epidemics (Polley & Thomas Reference Polley and Thomas1991), in addition to the prevalent use of susceptible wheat cultivars in the early 1980s (Bayles Reference Bayles1990). Some have argued that the replacement of tall cultivars by semidwarf cultivars increased the severity of S. tritici, as the reduced distance between consecutive leaves of short-strawed wheat cultivars could facilitate the movement of conidia when spread by splashy rain (Bahat et al. Reference Bahat, Gelernter, Brown and Eyal1980; Baltazar et al. Reference Baltazar, Scharen and Kronstad1990). Cultivars might not be the only factor that affects the movement of conidia through plant architecture: some agrochemicals including fungicides and plant growth regulators cause a morphological change in plants (Benton & Cobb Reference Benton and Cobb1995).
The importance of the effect of the state of plant nutrition on the severity of diseases has been recognized (Olesen et al. Reference Olesen, Mortensen, Jørgensen and Andersen2000); however, few studies have been carried out so far to investigate the effect of N on the severity of Septoria diseases. Conflicting results and statements are found in the literature. For example, Shipton et al. (Reference Shipton, Boyd, Rosielle and Shearer1971) stated that N applications increase the susceptibility of plants to S. tritici. This is supported by Prew et al. (Reference Prew, Church, Dewar, Lacey, Penny, Plumb, Thorne, Todd and Williams1983), who conducted a field experiment to investigate the relative importance of eight management practices, among which N rates and timings were tested, on the performance of the wheat crop. They applied N at two rates, 160 and 250 kg/ha, at two application timings: a single application in April and three-way split in March, April and May, and observed an increased incidence of Septoria diseases with greater rates of N. Leitch & Jenkins (Reference Leitch and Jenkins1995), in 2 years of field experiments, also found increased severity of Septoria diseases with the increased N application rates. They suggested that the increased incidence of Septoria diseases could be induced by the increased nutritional status of the host tissue. A similar view was shared by Simón et al. (Reference Simón, Cordo, Perelló and Struik2003), who observed increased necrosis in plots treated with 100 kg/ha of N as urea at sowing in comparison with unfertilized plots.
In contrast, Zadoks & Schein (Reference Zadoks and Schein1979) suggested that high N concentrations keep the leaves in a more juvenile state and resistant to S. nodorum. Gooding & Davies (Reference Gooding and Davies1992) mentioned a case where increasing soil application of granular ammonium nitrate resulted in lower levels of late-season S. tritici. Datasets that support such a statement are, however, limited. Johnston et al. (Reference Johnston, Macleod and Clough1979) observed an inverse linear relationship between N rate and Septoria blotch on spring wheat. Broscious et al. (Reference Broscious, Frank and Frederick1985) observed such an inverse relationship in one of the 13 field experiments they carried out on farms in Pennsylvania, USA, but concluded that the severity of Septoria blotch would generally increase as more spring N is applied.
Most studies have focused on the influence of N on the expansion of the necrotic area or pycnidial coverage of the leaf caused by S. tritici without paying enough attention to yield and yield component losses (Simón et al. Reference Simón, Perelló, Cordo and Struik2002). Forrer & Zadoks (Reference Forrer and Zadoks1983), in their inoculation study of S. tritici, observed a yield reduction that was fully explained by the necrotic leaf area induced by the pathogen; in other words, the reduction of photosynthetically active leaf area. For this reason, it is recognized that the area under the disease progress curve (AUDPC) is an important measure when assessing the relationship between disease and yield (Jeger Reference Jeger2004), and the AUDPC has been used to assess fungicidal control of S. tritici in wheat (Marroni et al. Reference Marroni, Viljanen-Rollinson, Butler and Deng2006). However, since S. tritici is a necrotroph, and produces disease symptoms similar to physiological senescence, a measure of total leaf senescence (area under the senesced progress curve (AUSPC)) may provide a better relationship with crop yield than AUDPC. Cases have been reported, however, where susceptible cultivars of wheat showed no significant reductions in yield under the severe epidemics of S. tritici (Ziv & Eyal Reference Ziv and Eyal1978; Zuckerman et al. Reference Zuckerman, Eshel and Eyal1997). It was observed with such a cultivar that a higher rate of photosynthesis compensated for the reduced photosynthetically active leaf tissues (Zuckerman et al. Reference Zuckerman, Eshel and Eyal1997). Influence of disease on the host is expected to vary depending on the timing and duration of infection. Emphasis is very often placed on infection during grain filling due to its importance in forming yield: however, earlier infection might affect disease development later in the season and consequently yield (Thomson & Gaunt Reference Thomson and Gaunt1986). Early infection could affect numbers of tillers, spikelets and florets as well as grain weight, while the effect of infection during the grain-filling period is limited to a reduction in grain weight. Interestingly, cases have been observed where poor early growth was compensated by later growth, for example, a decreased grain number was compensated by an increased grain weight (Thomson & Gaunt Reference Thomson and Gaunt1986), but such compensation could not always be expected (Lim & Gaunt Reference Lim and Gaunt1981, Reference Lim and Gaunt1986).
The objective of the present study was to measure the combined effect of N and a strobilurin fungicide in comparison with a triazole fungicide on the progress of Septoria disease, leaf senescence and yield losses. Within this objective attention was paid to the association between plant N status and the severity of Septoria disease.
MATERIALS AND METHODS
Site and experimental design
Four field experiments with winter wheat were conducted during the period between 1999 and 2002 at Harper Adams University College, Shropshire, UK (52°46′N, 2°25′W, 63–82 m asl). The four experiments are referred to as Expt I (1999/2000), Expt II (2001), Expt III-A (2001/02) and Expt III-B (2001/02), respectively. The first two experiments were conducted on a stoneless sandy loam or loamy sand soil of Bridgenorth series, while the last two were on slightly stony sandy clay loam or sandy loam soil of Salwick series. A bread-making cultivar, Hereward, was employed in all four experiments. Experiments were randomized block designs with a plot size of 1·75×10 m. The factors tested were spring N fertilization rates combined with either three or four fungicide programmes (for Expts I, II and III-B). Seeds were sown at 350 seeds/m2 except for Expt III-A, where seed rate was used as a factor in addition to N fertilization rates, but in this experiment fungicide programmes were not tested. The four field experiments were designed as factorial with either three (Expts I and II) or four replicates (Expts III-A and III-B) within a randomized block design. Weather data were recorded by the Harper Adams University College weather station, which was within 1 km of the experimental sites.
Treatments
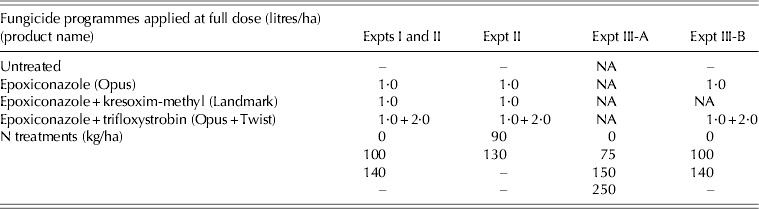
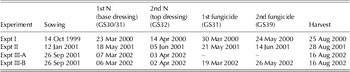
The fungicide treatments are presented in Table 1. The fungicide programmes consisted of: epoxiconazole (Opus, BASF Ltd; 1 litres/ha and 121 g a.i./kg product); epoxiconazole with kresoxim-methyl (Landmark, BASF Ltd; 1 litre/ha and 115 g a.i./kg product); and a mixture of epoxiconazole and trifloxystrobin (Twist, Novartis Crop Protection UK Ltd; 2 litres/ha and 125 g a.i./kg product). The amount of epoxiconazole applied was the same for all the fungicide treatments. Fungicides were applied at growth stage (GS) 31 and 39 (Zadoks et al. Reference Zadoks, Chang and Konzak1974). Fungicides were applied to each plot at 200 litres/ha as a medium-quality spray, using a CO2-powered hand-held knapsack sprayer. Plant growth regulators, chlormequat chloride and trinexapac ethyl were applied to all the plots at GS 30/31 and were mixed with fungicides where applicable. The rates of N fertilizer were determined by reference to the recommendations by MAFF (Anon. 2000) for the individual experiments to follow commercial practice and were based on soil type, previous cropping and crop requirement. A variation from this was also used to test the effects of N as well as its interaction with fungicide treatments. At GS 30/31, which is the onset of stem elongation (Zadoks et al. Reference Zadoks, Chang and Konzak1974), and at GS 32, ammonium nitrate (0·345 N) was broadcasted manually to each plot obtaining a uniform cover. The total amount of N corresponding to treatments for each experiment is presented in Table 1. Where N was applied to plots, it was split into two applications: 40 kg/ha applied at GS 30/31 and the remainder at GS 32. The dates when each operation was conducted are presented in Table 2.
Fungicide and nitrogen treatments used in each of the four field experiments conducted on winter wheat cvar Hereward

NA, not applicable.
Dates of sowing, timing of nitrogen fertilizer and fungicide applications and harvest dates for four field experiments conducted on winter wheat cvar Hereward

GS, growth stage.
Visual assessment of lesions of Septoria diseases and senesced leaf area
Areas of lesions are considered to be a more appropriate measure than numbers of lesions in studying the effect of the fungus on host (Shaw & Royle Reference Shaw and Royle1987). The proportion of leaf area covered with the lesions of Septoria diseases was visually assessed according to the disease key of Wheat Septoria, Key Nos. 1.6.1. and 1.6.2 (Anon. 1976). It was clear from visual assessment that S. tritici was the causal pathogen of the disease assessed in these experiments, although trace levels of S. nodorum may have been present. In addition to the disease assessment, the proportion of senesced leaf area was visually estimated for each leaf. The datasets of both the proportion represented as the score between 0 and 1 of leaf area covered with lesions of S. tritici and that of senesced leaf area were arcsin transformed to stabilize the variances.
Plant height and internode length
Plant height and internode length between leaf 1 (flag leaf) and leaf 2, as well as that between leaf 2 and leaf 3, of 20 plants chosen at random were measured for each plot when visual assessment of lesions of S. tritici was conducted.
Calculation of AUDPC and AUSPC
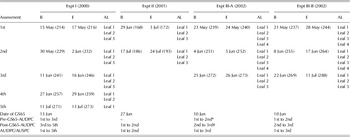
AUDPC was calculated following the method given by Shaner & Finney (Reference Shaner and Finney1977) for either the top three or four leaves using the original values of disease assessment without transformation. However, at later GSs, lower leaves were found to be mostly senesced and therefore were omitted from the assessment. AUSPC was calculated in the same way. Assessment dates, assessed leaf at each assessment and the assessment data employed to calculate AUDPC and AUSPC are given in Table 3.
Dates of foliar disease assessment, the assessed leaf at each assessment and the assessment data employed to calculate AUDPC and AUSPC in Expts I, II, III-A and III-B

* Pre-GS59-AUDPC.
† Post-GS59-AUDPC.
B, beginning date of each sampling; E, end date of each sampling; AL, assessed leaf; GS, growth stage.
The number in parentheses shows DAS for each field experiment.
Plant N analysis
Total N concentration of plant samples was determined by the Kjeldahl method (Bremner Reference Bremner and Black1965) using a Kjeltec Auto 1030 and 1035 analyser (Tecator) for Expt I, while it was determined using an FP-528 (LECO) for Expts II, III-A and III-B. The results were adjusted to 1·00 dry matter basis.
Grain number per area (GNA), mean grain weight (MGW) and yield
All the ears of each plot were removed and threshed at the same time by a plot combine, either a Haldrup (2000) or a Wintersteiger (2001, 2002). Harvested grain weight was recorded from each plot and yield was adjusted to 0·85 dry matter, after measuring moisture content with a protimeter, Grainmaster I (Protimeter plc, Marlow, Buckinghamshire, UK). A sample of 1 kg was retained from the combine-harvested grains of each plot for the determination of MGW. Approximately 500 grains from a sub-sample of the harvested grains were counted and weighed. The same procedure was repeated and MGW was calculated as the average of the two measurements. In Expt II, MGW was determined at pre-harvest. The number of grains in a known area (0·1–0·175 m2) was counted to determine GNA (expressed as 1/1000 grains/m2) at pre-harvest sampling.
Statistical analysis
Analysis of variance and regression analysis were performed using the GENSTAT (5th and 6th edition) and SPSS 13.0 (SPSS Japan, Tokyo, Japan) statistical programmes. Fungicide treatments, N rates and seed rates were treated as fixed factors. Standard errors are given at P⩽0·05 in all figures and tables.
RESULTS
Weather
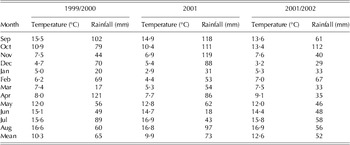
Mean daily temperature was calculated by averaging the maximum and minimum temperatures for each month. The wet conditions in the autumn of 2000 delayed the drilling of Expt II until January of 2001. In addition, Expt II was characterized with a dry spell that prevailed during much of June (Table 4).
Mean daily temperature and total rainfall over the three seasons of the experiments

Dominant diseases
S. tritici was the dominant disease throughout the four field experiments, although S. nodorum may have been present at trace levels. The only other foliar disease observed in any of the experiments was powdery mildew (Erysiphe graminis f.sp. tritici Marchal). The most seen on any individual leaf did not exceed 0·04 and for most assessments it was absent altogether.
Septoria leaf area and senesced leaf area
In Expt I, only the leaf area covered with lesions of S. tritici (referred to as Septoria leaf area) was recorded. However, it was later considered that senesced leaf area was more important for biomass production from the view point of crop physiology, due to its direct relevance to photosynthetically active leaf area, and that recording Septoria leaf area alone did not seem to provide sufficient information as to the ability of the crop canopy to assimilate CO2. Therefore, in Expts II, III-A and III-B, senesced leaf area as well as Septoria leaf area was measured. In the present study, senesced leaf area was defined to include Septoria leaf area and, therefore, senesced leaf area was always either equal to or greater than Septoria leaf area when the former was regressed on the latter. Over the three field experiments, senesced leaf area showed statistically positive linear relationships to Septoria leaf area (P<0·001) for the top three leaves within the period, mostly the heading and grain-filling period, when visual assessments of both of Septoria leaf area and senesced leaf area were conducted (Table 5). In Expt II, the variability accounted for between the two variables became weaker in the 2–3 weeks after anthesis, except for leaf 1. The reduction in variability accounted for was the greatest for leaf 2. A similar trend was observed in Expt III-A. In this case, however, the variability accounted for stayed the same for leaf 2 and it increased slightly for leaf 1 during the same period. In Expt III-B, the variability accounted for between Septoria leaf area and senesced leaf area increased during the period between anthesis and 3–4 weeks after anthesis. It declined for leaf 3 during the same period. AUDPC showed statistically a positive linear relationship to AUSPC in Expts II (P<0·001), III-A (P<0·001) and III-B (P<0·001) (Table 6).
Coefficients of linear regression analysis of the relationship between Septoria leaf area and senesced leaf area (both arcsin transformed) in Expts II, III-A and III-B

Coefficients of linear regression analysis of the relationship between Total-AUDPC and AUSPC in Expts II, III-A and III-B

Treatment effects on AUDPC and AUSPC
No interactions were observed between factors in any of the experiments. The main effects of fungicide programmes, N rates and seed rates on AUDPC as well as AUSPC are given in Tables 7–9 respectively.
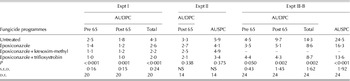
AUDPC and AUSPC for fungicide programmes in Expts I, II and III-B

Pre 65, pre-GS65-AUDPC; Post 65, post-GS65-AUDPC; Total, summation of pre-GS65-AUDPC and post-GS65-AUDPC; NS, not significant.
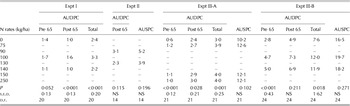
AUDPC and AUSPC for N rates in Expts I, II, III-A and III-B

Pre 65, pre-GS65-AUDPC; Post 65, post-GS65-AUDPC; Total, summation of pre-GS65-AUDPC and post-GS65-AUDPC; NS, not significant.
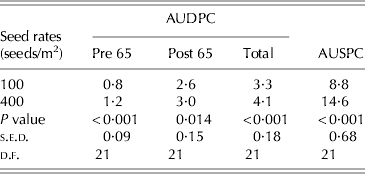
AUDPC and AUSPC for seed rates in Expt III-A

Pre 65, pre-GS65-AUDPC; Post 65, post-GS65-AUDPC; Total, summation of pre-GS65-AUDPC and post-GS65-AUDPC.
In Expt I, untreated plots showed a greater total-AUDPC compared with those treated with fungicides (P<0·001). Within fungicide treatments, the plots treated with epoxiconazole alone showed a greater total-AUDPC than those treated with a mixture of epoxiconazole and trifloxystrobin (P<0·001). The plots treated with a mixture of epoxiconazole and kresoxim-methyl showed a numerically smaller total-AUDPC than those treated with epoxiconazole alone; however, the difference was not significant. The plots treated with strobilurin fungicide programmes showed a smaller pre-GS65-AUDPC than those treated with epoxiconazole alone, while a significant difference was detected between untreated plots and those treated with fungicides in the case of post-GS65-AUDPC. In Expt II, neither post-GS65-AUDPC (P=0·346) nor AUSPC (P=0·390) showed any significant difference between fungicide programmes. In Expt III-B, post-GS65-AUDPC (P=0·002) and total-AUDPC (P=0·002) in untreated plots were greater than those treated with epoxiconazole alone and those treated with a mixture of epoxiconazole and trifloxystrobin, while pre-GS65-AUDPC was numerically smaller for plots treated with epoxiconazole alone than untreated plots and those treated with a mixture of epoxiconazole and trifloxystrobin (P=0·050). Untreated plots showed a greater AUSPC than those treated with epoxiconazole alone and those treated with a mixture of epoxiconazole and trifloxystrobin (P<0·001).
In Expt I, the plots where N was applied at the rate of 100 kg/ha showed a greater post-GS65 (P<0·001) and total-AUDPC (P<0·001) than untreated plots and those where 140 kg/ha was applied. There was no significant difference in pre-GS65, post-GS65 and total-AUDPC between untreated plots and those where 140 kg/ha was applied. In Expt II, N rates did not affect either post-GS65-AUDPC (P=0·115) or AUSPC (P=0·196). In Expt III-A, overall, untreated plots showed a smaller pre-GS65 (P<0·001) and total-AUDPC (P=0·001) than those where fertilizer N was applied. The same trend was observed with post-GS65-AUDPC (P=0·028), although there was no significant difference between untreated plots and those where 75 kg/ha of N was applied. There was no difference in AUSPC between N rates (P=0·102). In Expt III-B, pre-GS65 (P<0·001) and total-AUDPC (P=0·018) were smaller for untreated plots than those where fertilizer N was applied.
In Expt III-A, the only experiment where seed rates were tested, pre-GS65 (P<0·001), post-GS65 (P=0·014) and total-AUDPC (P<0·001) as well as AUSPC (P<0·001) were significantly greater at the seed rate of 400 seeds/m2 than that of 100 seeds/m2.
Effects of fungicide programmes on plant height and internode length
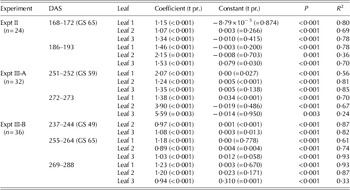
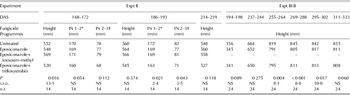
In Expt II, there was no interaction between treatments for plant height. Plant height was observed to be reduced by a mixture of epoxiconazole and trifloxystrobin compared with the untreated and the other fungicide programmes at 168–172 days after sowing (DAS; Table 10). There was also no interaction between treatments for internode length in this experiment (Table 10). At 186–193 DAS, the plots treated with a mixture of epoxiconazole and trifloxystrobin showed a shorter internode length between leaf 1 and leaf 2 (P=0·021) and between leaf 2 and leaf 3 than untreated plots, the plots treated with epoxiconazole alone and those treated with a mixture of epoxiconazole and kresoxim-methyl (P=0·043) (Table 10). There was no interaction between fungicide programmes for plant height and N rates in Expt III-B. The plots treated with epoxiconazole alone and those treated with a mixture of epoxiconazole and trifloxystrobin showed a shorter plant height than untreated plots at 255–264 DAS (P=0·004), at 269–288 DAS (P<0·001) and at 295–302 DAS (P=0·017) (Table 10).
Plant height and internode length in Expts II and III-B

* Internode between leaf 1 and leaf 2.
† Internode between leaf 2 and leaf 3.
NS, not significant.
Leaf N concentration and Septoria leaf area
From disease assessments, it was apparent that the amount of N applied had a significant influence on Septoria leaf area in three out of the four field experiments. It was hypothesized that the N status of the plant might provide further information as to the relationship between the rate of N application and severity of Septoria diseases. Either a linear or a quadratic equation was fitted to the relationships between leaf N concentration and Septoria leaf area. The mean value of each treatment was employed for these analyses.
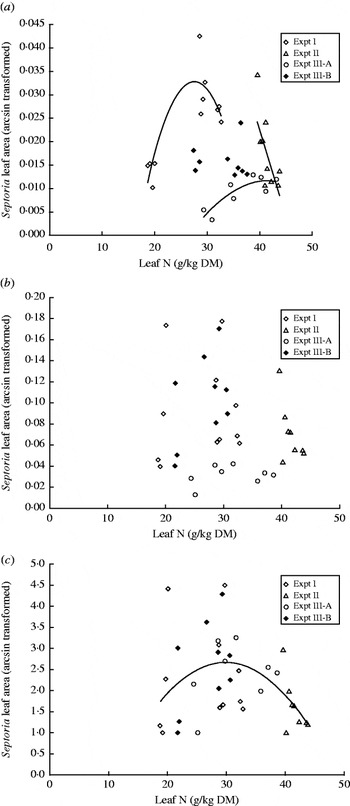
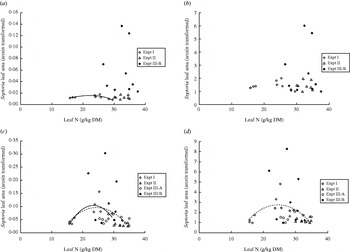
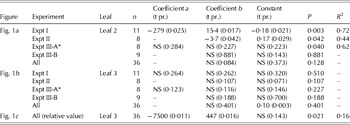
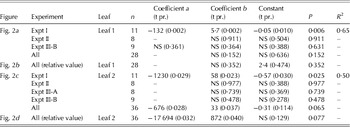
On leaf 2 at anthesis, Septoria leaf area showed a quadratic relationship to leaf N concentration (P=0·003) in Expts I and III-A (P=0·040), while in Expt II, a negative (P=0·042) linear relationship was observed (Fig. 1a, Table 11). No such statistically significant relationship was observed on either leaf 2 in Expt III-B or on leaf 3 in any experiment (Fig. 1b, Table 11). However, by converting the Septoria leaf area to a relative scale (the minimum value of Septoria leaf area observed within each experiment was set as a standard value of 1 and the rest were calculated according to the ratio to the standard) for each experiment and pooling them, a weak quadratic relationship between leaf N concentration and Septoria leaf area was obtained (P=0·021) (Fig. 1c, Table 11). During grain fill, no statistically significant relationship was observed between leaf N concentration and Septoria leaf area, except for Expt I where a quadratic relationship was observed on leaf 1 (P=0·006) and on leaf 2 (P=0·025) (Figs 2a and c, Table 12). Converting the Septoria leaf area for leaf 1 to a relative scale did not reveal any relationship between leaf N concentration and Septoria leaf area (Fig. 2b). On leaf 2, however, pooling the data of the four experiments suggested a quadratic relationship (P=0·065) between leaf N concentration and Septoria leaf area (Fig. 2c, Table 12). Converting the pooled data to a relative scale also suggests a quadratic relationship (P=0·077) (Fig. 2d, Table 12).
(a) Relationship between leaf N concentration and Septoria leaf area (arcsin transformed) on leaf 2 at anthesis. (b) Relationship between leaf N concentration and Septoria leaf area (arcsin transformed) on leaf 3 at anthesis. (c) Relationship between leaf N concentration and Septoria leaf area (relative value of arcsin transformed) on leaf 3 at anthesis.

(a) Relationship between leaf N concentration and Septoria leaf area (arcsin transformed) on leaf 1 during grain filling. (b) Relationship between leaf N concentration and Septoria leaf area (relative value of arcsin transformed) on leaf 1 during grain filling. (c) Relationship between leaf N concentration and Septoria leaf area (arcsin transformed) on leaf 2 during grain filling. (d) Relationship between leaf N concentration and Septoria leaf area (relative value of arcsin transformed) on leaf 2 during grain filling.

Coefficients of polynomial and linear regression analysis of the relationship between leaf N concentration and Septoria leaf area (arcsin transformed) at anthesis in Expts I, II, III-A and III-B

* Septoria leaf area recorded at GS59.
NS, not significant.
Coefficients of polynomial and linear regression analysis of the relationship between leaf N concentration and Septoria leaf area (arcsin transformed) during grain filling in Expts I, II, III-A and III-B

NS, not significant.
Effects of Septoria leaf area and senesced leaf area on yield and yield components
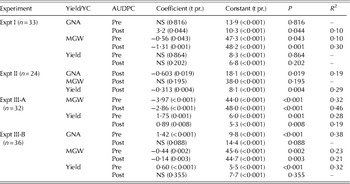
An attempt was made to explain grain yield from Septoria leaf area as well as senesced leaf area. Pre-GS65 and post-GS65-AUDPC were regressed against yield components and yield (Table 13). In Expt I, yield could not be explained by AUDPC, whether it was pre-GS65 or post-GS65-AUDPC. There was, however, a negative relationship between AUDPC and MGW for both pre-GS65 (P=0·043) and post-GS65-AUDPC (P=0·001). The degree of reduction in MGW with the increase in AUDPC was greater for post-GS65-AUDPC than for pre-GS65-AUDPC. A positive relationship was observed between post-GS65-AUDPC and GNA (P=0·044). In Expt II, post-GS65-AUDPC showed a negative relationship with both GNA (P=0·019) and yield (P=0·004), while no significant relationship was observed between post-GS65-AUDPC and MGW (P=0·195). In Expt III-A, a negative relationship was observed between AUDPC for both pre-GS65 (P<0·001) and post-GS65 (P<0·001) and MGW, while a positive relationship was observed between AUDPC and yield. In Expt III-B, a positive linear relationship was observed between pre-GS65-AUDPC and GNA (P<0·001); however, there was no significant relationship observed between post-GS65-AUDPC and GNA. A significant negative relationship was observed between AUDPC and MGW for both pre-GS65 (P=0·002) and post-GS65-AUDPC (P=0·003).
Regression analysis of pre-GS65 and post-GS65-AUDPC against yield and yield components in Expts I, II, III-A and III-B

YC, yield components; GNA, grain number per area (1/1000 grains/m2); MGW, mean grain weight (mg); GS, growth stage; NS, not significant.
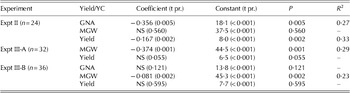
The results of regression analysis of AUSPC against yield components and yield are presented in Table 14. In Expt II, AUSPC showed a negative linear relationship with GNA (P=0·005) and yield (P=0·002). A negative linear relationship was observed between AUSPC and MGW in both Expt III-A (P=0·001) and Expt III-B (P=0·002).
Regression analysis of AUSPC against yield and yield components in Expts II, III-A and III-B

YC, yield components; GNA, grain number per area (1/1000 grains/m2); MGW, mean grain weight (mg); GS, growth stage; NS, not significant.
DISCUSSION
Visual assessment of Septoria diseases
The precision and accuracy of visual assessment of foliar diseases are questionable. Parker et al. (Reference Parker, Shaw and Royle1995) argued that estimates of disease severity are usually more subjective compared with disease incidence. Despite that, disease severity needs to be directly estimated on many occasions, especially where the relationship between incidence and severity is weak. In a study testing the reliability of visual estimates of disease severity on cereal leaves, Parker et al. (Reference Parker, Shaw and Royle1995) reported that S. tritici, mildew and senescence were not estimated accurately or consistently by several experienced observers. In addition, distinguishing the boundary between disease necrosis and physiological senescence was found to be a problem in assessing S. tritici (Parker et al. Reference Parker, Shaw and Royle1995), which was the case in this study. From the point of view of crop physiology, it is important to quantify the area of plants that are capable of photosynthesis. In the present study, for example, at anthesis, there was a relatively strong positive relationship between the leaf area covered with Septoria lesions and the senesced leaf area on leaf 3, but as time progressed it became difficult to distinguish disease-originated necrosis from physiological senescence. The proportion of leaf area covered with Septoria lesions may account, to some extent, for yield variability. It might not, however, be an appropriate index when a greater leaf area is senesced without clear evidence that it is attributable to foliar diseases. This was probably the case in Expt III-A, where the coefficient of the linear relationship between total-AUDPC and AUSPC was as high as 3·73 with the variability accounted for being 0·73, a value relatively lower than that observed in Expts II and III-B. The absence of fungicide treatments in Expt III-A is considered to be at least partly responsible for this relationship.
Effects of fungicide programmes on severity of Septoria diseases
In Expts I and III-B, AUDPC for both pre-GS65 and post-GS65 as well as total-AUSPC were always observed to be greater for untreated plots than the plots treated with fungicides, indicating the importance of applying fungicides to winter wheat to control of Septoria diseases. When strobilurin fungicide programmes were compared with the triazole-only programme, the plots treated with a mixture of epoxiconazole and trifloxystrobin tended to result in smaller AUDPC and AUSPC than those treated with epoxiconazole alone. This does not mean, however, that one can always expect significant effects from adding trifloxystrobin to epoxiconazole, as significantly smaller AUDPC and AUSPC were only observed in Expt I. Consistency of effects was even harder to see with a mixture of epoxiconazole and kresoxim-methyl, the performance of which was better only for AUDPC during the pre-anthesis period in Expt I compared with epoxiconazole alone. Within strobilurin fungicide treatments, a mixture of epoxiconazole and trifloxystrobin kept AUDPC during the post-anthesis period in Expt I significantly smaller than epoxiconazole and kresoxim-methyl; however, the difference in total-AUDPC between the two fungicide programmes was not significant.
Applying fungicides to the crop in Expt II seemed to give little or no benefit. Whether this was attributable to a host factor such as shortened growing period of the crop due to the late drilling or a relatively low disease pressure due to dry conditions during late spring and early summer in this season is not known. Nevertheless, in a so-called standard season, application of a mixture of epoxiconazole and trifloxystrobin is likely to give better control of Septoria diseases, keeping the senesced leaf area smaller than that of epoxiconazole alone, in the absence of any fungicide resistance issues.
Effects of N on severity of S. tritici
In Expt I, Septoria leaf area was the greatest for the plots treated with 100 kg/ha of N compared with those treated with either 0 or 140 kg N/ha at 257–259 DAS. A similar result was observed in Expt II, where Septoria leaf area was greater for the plots treated with 90 kg N/ha than those treated with 130 kg N/ha. This decrease in disease at higher N applications is supported by Johnston et al. (Reference Johnston, Macleod and Clough1979) who observed an inverse linear relationship between N rate and Septoria blotch on spring wheat. Other workers, however, have found increased disease severity by Septoria diseases with increased N application rates (Prew et al. Reference Prew, Church, Dewar, Lacey, Penny, Plumb, Thorne, Todd and Williams1983; Leitch & Jenkins Reference Leitch and Jenkins1995; Simón et al. Reference Simón, Cordo, Perelló and Struik2003). The combined evidence therefore indicates that there might be an optimum N concentration for Septoria diseases to develop.
The relationship between leaf N concentration and disease severity was examined to further study the effects of N on S. tritici. In Expt I, the relationship between leaf N concentration and Septoria leaf area was explained well by a quadratic function, indicating that there might be an optimum leaf N concentration for S. tritici to develop. In Expt II, a negative linear relationship was observed between the two components.
In Expt I, the range of leaf N concentration on leaves 2 and 3 was of the order of 20 and 30 g/kg DM at anthesis, and at c. 2 weeks after anthesis it had fallen to between 15 and 30 g/kg DM on leaves 1 and 2. In Expt II, the range of leaf N concentration on leaf 2 was higher at c. 30–35 g/kg DM at c. 3 weeks after anthesis. From the relationships observed in Expts I and II between leaf N concentration and the severity of S. tritici, it is tempting to conclude that there might be an optimum range of leaf N concentration in absolute terms for S. tritici to develop. For example, the severity of S. tritici showed a trend of decline in the range of leaf N concentration above 25 g/kg DM in both Expts I and II, indicating this range of leaf N status is supra-optimum for the development of disease. Such a conclusion, however, is hard to draw from the separate regression analyses from each experiment. This can be understood by simply referring to an observation that a trend of an increase in the severity of S. tritici was observed between the range of leaf N concentration between 25 and 30 g/kg DM in both Expts III-A and III-B, while there was an opposite trend of a decrease in Expt I.
To account for the variability in severity of Septoria diseases due to environmental factors particular to each experiment, Septoria leaf area was employed as a relative scale for further analysis and a weak but significant quadratic relationship between leaf N concentration and Septoria leaf area on leaf 3 at anthesis was obtained. This might suggest a hypothesis that there could be an optimum N concentration in host plants for S. tritici to develop rather than a simple increase or decrease with an increase in plant N concentration. Leitch & Jenkins (Reference Leitch and Jenkins1995) observed an increase in the severity of Septoria diseases on leaves 1 and 2 at range of leaf N concentration during grain fill between 10 and 25 g/kg DM. This range coincides with that in Expt I, where a positive linear relationship was observed between leaf N concentration and Septoria leaf area on leaves 1 and 2 during grain fill. The relationship between plant N concentration and severity of S. tritici was not analysed in the studies reporting a decrease in S. tritici with increased N application (Johnston et al. Reference Johnston, Macleod and Clough1979; Broscious et al. Reference Broscious, Frank and Frederick1985). It would be interesting to look at the relationship between leaf N concentration and severity of S. tritici in a wider range of host plant N concentrations.
Plant architecture and Septoria diseases
Overall, the seed rate of 400 seeds/m2 increased both AUDPC and AUSPC significantly compared with that of 100 seeds/m2. Considering that rain splash mediates the spread of conidial inoculum, this result is not surprising. When the crop canopy is dense, more efficient spread of conidial inoculum would be expected. The hypothesis suggested by Lovell et al. (Reference Lovell, Parker, Hunter, Royle and Coker1997) that horizontal movement would probably amplify the effect of vertical movement of inoculum would be likely to occur in a dense canopy rather than a sparse one.
It was shown that plant height was significantly affected by application of fungicides in both Expts II and III-B. In Expt II, plant height as well as internode length was reduced following the application of a mixture of epoxiconazole and trifloxystrobin, but not following that of a mixture of epoxiconazole and kresoxim-methyl or of epoxiconazole alone. It is not known why a mixture of epoxiconazole and trifloxystrobin reduced plant height, while the other strobilurin-containing fungicide programme, a mixture of epoxiconazole and kresoxim-methyl, did not; and there is little in the literature to support this observation. In Expt III-B, plant height was reduced by the application of a mixture of epoxiconazole and trifloxystrobin as well as that of epoxiconazole alone compared with untreated plots. The effect was absent at the 1st (194–198 DAS) and 2nd (237–244 DAS) sampling following the first fungicide application but became evident after the second fungicide application and continued until the 5th sampling (295–302 DAS). It is interesting that in the present experiment, plant height was reduced by both the triazole and the triazole plus strobilurin fungicide programmes: it is known that triazoles can have plant growth regulatory activity (Fletcher et al. Reference Fletcher, Hofstra and Gao1986).
Shortened stature of the plant following the application of fungicides might have an implication for the development of Septoria diseases, as vertical movement of inoculum by rain splash plays a role in inoculum transfer within the canopy of wheat crops (Royle et al. Reference Royle, Shaw and Cook1986). However, internode length could not be related to the severity of S. tritici in the present study (data not shown). In a study evaluating the effect of plant height on the development of S. tritici, Simón et al. (Reference Simón, Worland and Struik2004) argued that moderately short wheats were not necessarily more susceptible than the taller ones, following their observation that strong associations with plant height were only observed with very short wheats. Despite the fact that the shortened stature of the plant, due to fungicide application, favours the transfer of Septoria diseases, it would be difficult to detect such an effect, as this would probably be subtle compared with the fungicide's ability to control the disease.
Effects of S. tritici on yield and yield components
Septoria diseases are known to reduce MGW (Simón et al. Reference Simón, Perelló, Cordo and Struik2002), which was the case in three out of the four experiments in the present study. In Expts III-A and III-B, the degree of reduction was greater when the AUDPC for the pre-anthesis period was regressed against MGW than in the post-anthesis period, while the opposite was observed in Expt I. In Expt II, GNA and yield both appeared to have been reduced by increased AUDPC and AUSPC. In addition to a shortened growth period caused by a later sowing date, the absence of a no-N treatment in this experiment might at least partly explain why this was the case. The trend of increased GNA and yield with increased AUDPC observed in Expts I, III-A and III-B was considered to be a result of N application on GNA and yield rather than being a real association.
The authors would like to thank the many members of Harper Adams staff who contributed much to this work. Mr S. Williams, Mr L. Gaonac'h and Ms M. Z. Black are mentioned with gratitude for their help in disease assessment. Support given by Ms K. Okada and Professor T. Horie is gratefully acknowledged. This work was financially supported by a PhD studentship of Harper Adams University College.