INTRODUCTION
Rapeseed (Brassica napus) acreage in China accounts for one-third of the world's oilseed rape acreage and continues to increase as >60% of all oil consumed among Chinese households comes from rapeseed and consumption worldwide increases under the name ‘canola oil’. Viral, bacterial and fungal diseases often hamper crop production and lead to low yield and poor seed quality. Over 400 economically important crops including rapeseed and domesticated Brassica oleracea, soybean and dicotyledonous grain legumes are host to Sclerotinia sclerotiorum (Lib.) de Bary, a non-specific fungus (Purdy Reference Purdy1979; Boland & Hall Reference Boland and Hall1994; Bolton et al. Reference Bolton, Thomma and Nelson2006; Mei et al. Reference Mei, Qian, Disi, Yang, Li, Li, Frauen, Cai and Qian2011). Sclerotinia stem rot (SSR) disease, although global, is a disease of major economic importance in China. Annual yield losses of 10–80% have been reported in China (Oil Crop Research Institute 1975).
To date, S. sclerotiorum has been difficult to control. Dark, unevenly shaped resting structures known as sclerotia and found in the stems of infected plants are known to remain viable in the soil for several growing seasons (van Maanen & Xu Reference van Maanen and Xu2003). In addition, sclerotia have been found to survive after exposure to temperatures of 107 °C (Hind-Lanoiselet et al. Reference Hind-Lanoiselet, Lanoiselet, Lewington, Ash and Murray2005). Application of chemicals has been established as the most effective management option available to farmers. Despite this efficacy, public concerns about the environmental costs of fungicide usage (Bardin & Huang Reference Bardin and Huang2001; del Río et al. Reference del Río, Bradley, Henson, Endres, Hanson, McKay, Halvorson, Porter, Le Gare and Lamey2007) and fears about the development of resistance to fungicides (Gossen et al. Reference Gossen, Rimmer and Holley2001; Brimner & Boland Reference Brimner and Boland2003) are increasing. Biological control methods that easily degrade sclerotia in the soil have been developed, but their efficacy remains in doubt due to inconsistent results (Boland Reference Boland1997; Brimner & Boland Reference Brimner and Boland2003). In addition, the costs of utilizing biological controls are not fully known. Using resistant plant varieties may provide the most consistent, sustainable means of managing the disease. Currently, no rapeseed variety has been developed that is completely resistant to Sclerotinia infection.
The inheritance of Sclerotinia resistance is complex, and no single consistent inheritance mode exists which is resistant to the disease. Several studies using rapeseed and other Brassicas have identified partial, dominant or polygenic control, including additive by additive epistatic interactions, which confer Sclerotinia resistance (Fuller et al. Reference Fuller, Coyne and Steadman1984; Baswana et al. Reference Baswana, Rastogi and Sharma1991; Zhao & Meng Reference Zhao and Meng2003; Li et al. Reference Li, Rimmer, Buchwaldt, Sharpe, Seguin-Swartz, Coutu and Hegedus2004; Wang et al. Reference Wang, Liu, Zheng, Wang and Yang2004; Zhao et al. Reference Zhao, Peltier, Meng, Osborn and Grau2004, Reference Zhao, Udall, Quijada, Grau, Meng and Osborn2006, Reference Zhao, Buchwaldt, Rimmer, Sharpe, McGregor, Bekkaoui and Hegedus2009). One to ten quantitative trait loci (QTLs) responsible for Sclerotinia resistance have been reported (Zhao & Meng Reference Zhao and Meng2003; Zhao et al. Reference Zhao, Udall, Quijada, Grau, Meng and Osborn2006; Yin et al. Reference Yin, Yi, Chen, Zhang, Tu, Fernando and Fu2010). Some studies have shown differences in the number of QTLs in different populations and variations depending on the inoculation techniques applied. Working with F2:3 populations, Zhao & Meng (Reference Zhao and Meng2003) reported a total of nine QTLs (six for leaf and three for stem) suggesting that Sclerotinia resistance in B. napus is tissue-specific. A similar study using two populations of Double Haploid (DH) lines also found that different QTLs control the same trait in different populations (Zhao et al. Reference Zhao, Udall, Quijada, Grau, Meng and Osborn2006). These general results reflect the nature of disease resistance inheritance, indicating resistance is under strong environmental influence. Although B. oleracea was used to develop and improve B. napus, understanding of the genetics of S. sclerotiorum resistance in B. oleracea still remains poor.
To understand the inheritance of S. sclerotiorum resistance in B. oleracea, a generation means analysis (Mather & Jinks Reference Mather and Jinks1982) was conducted using six generations including two parental lines (Brassica incana and B. oleracea var. alboglabra) (Mei et al. Reference Mei, Qian, Disi, Yang, Li, Li, Frauen, Cai and Qian2011) and four of their progeny. The objectives of the study were: to determine gene action of S. sclerotiorum resistance inheritance; to estimate variance components and heritability; and to determine minimum number of genes controlling S. sclerotiorum resistance.
MATERIALS AND METHODS
Plant material
The experimental population was developed from an inter-specific cross between susceptible B. oleracea var. alboglabra (P1) and resistant B. incana (P2) lines (Mei et al. Reference Mei, Qian, Disi, Yang, Li, Li, Frauen, Cai and Qian2011). B. incana is a wild species with a biennial growth habit, whereas B. oleracea var. alboglabra is an annual vegetable crop in China. During the 2008/09 growing season, a single resistant F1 plant was used as the male parent to develop BC1P1 (P1 × F1) and BC1P2 (P2 × F1) seeds for the first field season. A similar process was used to derive seeds for the second field season. The same resistant F1 plant was hand-pollinated to produce F2 progeny. The registered cultivar (Zhongyou 821), with partial resistance, was used as a control (He et al. Reference He, Yang and Luo1987).
Field experiments
The seeds derived from P1, P2, F1, F2, BC1P1, BC1P2 and Zhongyou 821 were sown in nurseries at the Southwest University's experimental station, at Chongqing China located (29°49′N, 106°26′E, 230 m a.s.l.). Seedlings from the six generations together with the control were transplanted 30 days after sowing into plots measuring 2·4 × 1 m. Plants were spaced 250 mm apart within rows with 300 mm between rows. Field management was conducted according to standard agricultural practice for the area.
Preparation of inoculum
A single Sclerotinia isolate collected from field-sown rapeseed plants at Southwest University, Chongqing, China was purified, maintained and cultured on potato dextrose agar (PDA) medium (20% potato, 2% dextrose and 1·5% agar) under dark conditions at 20 ± 2 °C to produce mycelium as a source of inoculums. Using the method described by Zhao & Meng (Reference Zhao and Meng2003) but modified slightly (Mei et al. Reference Mei, Qian, Disi, Yang, Li, Li, Frauen, Cai and Qian2011), the virulence of the inoculum was tested on leaves and stems before using them for the experiment.
Leaf and stem resistance tests
At the nine-leaf stage, every third fully expanded leaf was cut from field-grown plants to test leaf resistance in a controlled environment (n = 642 and n = 581, for the 2009/10 and 2010/11 seasons, respectively). One leaf per plant was tested for resistance and repeated twice at intervals of 30 days in each of the years. Detached leaves were placed on filter paper laid on moist towels on ply board measuring 2 × 1 m. Cotton wool, soaked in tap water, was used to cover the cut petiole. Each leaf was inoculated on the left and right sides of the lamina with a 6-mm-diameter plug of a 3-day-old S. sclerotiorum culture punched from the margin of PDA medium. The ply board carrying the inoculated leaves was placed on a four-legged aluminium frame and then mounted with another frame to form a chamber. The chamber was sealed with thick polyethylene and the temperature of the environment was maintained at 21 ± 2 °C. The polyethylene prevented external environmental interference and kept the humidity relatively constant.
Individual stems of the same plants whose leaves were inoculated were cut 100 mm above the ground and prepared into 400 mm lengths (n = 331 and n = 513, first and second field seasons, respectively) to test stem resistance. Each stem was inoculated at two positions (100 mm from the ends) with a 6 mm diameter plug of a 3-day-old S. sclerotiorum culture punched from the margin of PDA medium. The inoculation platform and post-inoculation treatment were similar to that described for the leaf inoculation.
Data collection
Lesion development (lesion size) was measured 72 h after inoculation for both leaves and stems. Leaf lesion size (S) was calculated based on the formula S=π×a×b/4, where a and b represent the diameters of each lesion. The data were transformed into relative resistance (R) using the formula R=V/V control, where V is the value of the individual plant tested (i.e. lesion size) for leaf resistance and lesion length for stem resistance while V control is the mean lesion size for Zhongyou 821 (control).
Statistical and genetic analyses
Leaf and stem resistance traits were analysed separately for the 2 years using JMP version 8.2 (SAS Institute Inc. 2009). ANOVA was used to examine the effects of plant, generation and plant × plot interactions on leaf and stem resistance for the two field seasons. Generation mean analyses were performed using a joint scaling test to determine the adequacy of either the additive-dominance model or the digenic–epistatic model through a weighted least squares analysis using the JNTSCALE software (Cavalli Reference Cavalli, Reeve and Waddington1952; Mather & Jinks Reference Mather and Jinks1982; Ng Reference Ng1990).
Since the lack-of-fit test for the three-parameter model (additive–dominance) was significant (P ⩽ 0·001) for all traits across the 2009/10 and 2010/11 field seasons, the three-parameter model was dropped and the six-parameter model (digenic–epistatic model) was adopted. This model, described by Mather & Jinks (Reference Mather and Jinks1982), uses the means and variances of the two parents, the F1 and F2, and backcrosses of the F1 to each parent. In addition to the estimates of the family means, additive and dominance effects, additive × additive, additive × dominance and dominance × dominance interactions were determined. The t-test statistic was used to test the significance (P ⩽ 0·05) of the digenic–epistatic interaction model. Broad- and narrow-sense heritability values were estimated as proposed by Allard (Reference Allard1960) and Warner (Reference Warner1952). The significant number of genes controlling both leaf and stem Sclerotinia resistance were calculated using the method described by Lande (Reference Lande1981). Lande's equation was based on the assumptions of both parents being inbred, alleles at all loci being additive, loci being unlinked and in random combination and no allelic interaction (epistasis).
RESULTS
Generation means and trait correlations
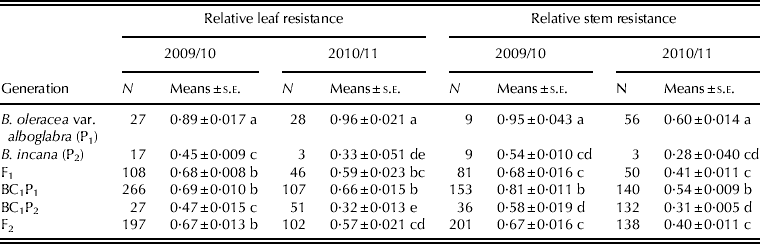
The ANOVA results for the field seasons indicated significant differences among the six generations for mean leaf and stem relative resistances in 2009/10 field season (F 5642 = 38·5, P < 0·001; F 5581 = 40·0, P < 0·001) and for 2010/11 field season (F 5331 = 77·7, P < 0·001; F 5513 = 126·2, P < 0·001). Tukey's honestly significant difference (HSD) test indicated that the mean values of relative resistance of the resistant (B. incana) and susceptible (B. oleracea var. alboglabra) parents were significantly different (P < 0·05) for both leaf and stem traits in the 2009/10 and 2010/11 field seasons (Table 1). The F1, F2 and BC1P1 leaf relative resistance means were not significantly different in the first field seasons and were intermediate to the two parental line means. The F1 and F2 leaf relative resistance means were not significantly different from each other in the second field season. Stem relative resistance means between F1 and F2 also did not differ for both the 2009/10 and 2010/11 field seasons (Table 1). The BC1P1 and BC1P2 plants varied in their mean relative resistance for the two traits and across the two growing seasons and BC1P2 plants did not differ significantly from the parent P2.
Generation means and standard errors (s.e.) of leaf and stem resistance to Sclerotinia sclerotiorum in six generations in a single cross between B. incana and B. oleracea var. alboglabra 2009/10 and 2010/11 field seasons

Means (±s.e.) in the same year with the same letter are not significantly different (Tukey–Kramer mean separation tests P < 0·05).
A small positive but not significant relationship (r = 0·004, P < 0·01) was detected between leaf and stem resistance in 2009/10 and a moderate (r = 0·445) and significant relationship was detected in the 2010/11 field seasons. However, the correlation for traits pooled over the two seasons was moderate (r = 0·312) and significant (P < 0·01).
Gene action and variance components
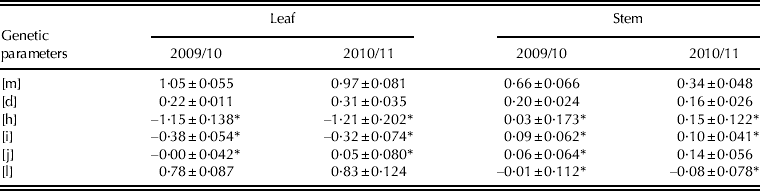
Because the lack-of-fit test was significant for both leaf and stem resistance to Sclerotinia across the two field seasons (data not shown), the three-parameter additive–dominance model was considered inadequate for explaining the gene actions controlling Sclerotinia resistance of the B. oleracea lines studied, indicating the presence of epistasis in the cross. The six-parameter model (digenic interactions) that includes a midpoint value [m], additive [d] and dominance [h] effects, as well as additive × additive [i], additive × dominance [j] and dominance × dominance [l] epistatic interactions presented the best fitting model for both leaf and stem resistance to Sclerotinia across the two field seasons. Combinations of negative dominance and additive × additive, and positive dominance and additive × additive epistatic interactions control the inheritance of leaf and stem resistance, respectively, across the two growing seasons (Table 2).
Estimates of the effects and s.e. for leaf and stem resistance to Sclerotinia sclerotiorum in six generations in a single cross of B. incana and B. oleracea var. alboglabra 2009/10 and 2010/11 field seasons
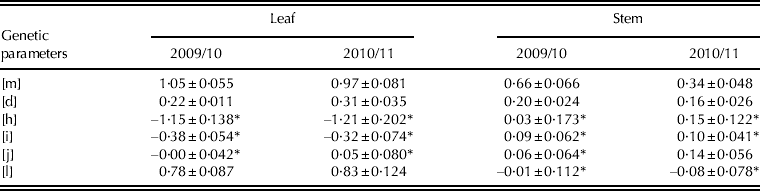
M = midpoint value; [d] = additive effect; [h] = dominance effect; [i] = additive–additive interaction; [j] = additive–dominance interaction; [l] = dominance–dominance interaction. * Significant at P < 0·05.
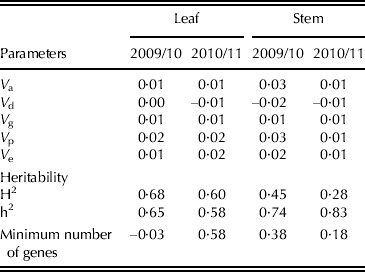
Results of variance component estimates are shown in Table 3. Environmental variance was not consistent for the two traits in the two seasons and was, in some cases, larger than or equal to the genetic variance for both traits. Additive genetic variance was positive and homogenous across the two field seasons for leaf and stem resistance to Sclerotinia. The dominance genetic variance was negative for stem resistance across the two years. In all the field seasons and for both leaf and stem resistance traits, additive variance was larger than the dominance variance (Table 3).
Estimates of variance components, heritability and minimum number of genes for leaf and stem resistance to Sclerotinia sclerotiorum in six generations in a single cross between B. incana and oleracea var. alboglabra lines in the 2009/10 and 2010/11 field season
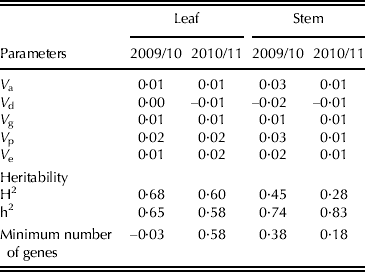
V a = additive variance; V d = dominance variance; V g = genotypic variance; V p = phenotypic variance; V e = environmental variance; H2 = broad-sense heritability; h2 = narrow-sense heritability.
Heritability and minimum number of genes
Broad-sense heritability estimates were moderately high (0·68 and 0·60) for leaf resistance but were below average (0·45 and 0·28) for stem resistance in the 2009/10 and 2010/11 field seasons (Table 3). Narrow-sense heritability estimates approximated that of broad-sense heritability for leaf resistance in the 2009/2010 and 2010/11 field seasons (0·65 and 0·58, respectively). Conversely, narrow-sense heritability estimates were higher (0·74 and 0·83) for the stem resistance trait than the leaf resistance trait in the 2009/10 and 2010/11 field seasons. In addition, narrow-sense heritability estimates for stem resistance were also higher than the broad-sense heritability estimates in the two growing seasons.
Minimum numbers of genes were relatively low for both traits and across growing seasons (Table 3). The estimated minimum numbers of genes for leaf resistance were –0·03 and 0·58 (2009/10 and 2010/11 field seasons), whereas the estimates for stem resistance were 0·38 and 0·18 (2009/10 and 2010/11 field seasons).
DISCUSSION
Generation mean analysis is helpful in population improvement and breeding decisions involving QTLs. In the present study, the parent and progeny populations were significantly different with regard to leaf and stem resistance phenotypes upon inoculation with Sclerotinia, demonstrating their potential for use in inheritance studies. Further, different relative resistance values observed between leaf and stem resistance over the two growing seasons corroborate previous findings on the tissue-specific nature of Sclerotinia resistance inheritance reported in F2:3 and DH B. napus populations (Zhao & Meng Reference Zhao and Meng2003; Zhao et al. Reference Zhao, Udall, Quijada, Grau, Meng and Osborn2006). The relative resistance means of F1 and F2 leaves and stems, which were found to be a near intermediate of the mean of the two parental lines across the two field seasons, may be an indication of quantitative inheritance of the two traits. Quantitatively inherited traits are difficult to classify into highs and lows; as such, trait segregation ratios in the segregating generations could not be determined in the present study.
Trait variation in the two growing seasons fit the digenic–epistatic interaction models. The three-parameter model did not adequately explain the genetics of the traits; therefore, the six-parameter model was adopted – a clear indication of epistatic interactions. Both negative and positive consistent multiple epistatic interactions (dominant and additive × additive) observed in the present study for both traits across the growing seasons points to the complexity of gene actions underlying the inheritance of Sclerotinia resistance in the leaf and stem of B. oleracea lines studied. Zhao & Meng (Reference Zhao and Meng2003) had reported six and three QTLs for leaf and stem resistance, respectively, as well as additive × additive digenic interaction in B. napus. However, the present study is the first to report multiple epistatic interactions for the inheritance of a single trait (either leaf and/or stem resistance). Several factors acting singly or in combination could explain this novel finding. For example, the plant systems adopted for the inter-specific cross (B. incana and B. oleracea var. alboglabra), were not inbred lines and traits were not fixed. Other possible explanations could be that sample numbers were insufficient or there were unidentified errors (technical) during the data collection. The inconsistent mean values obtained within generations and between the cropping seasons appears to favour environmental interaction. In addition, the negative significant digenic interactions for the leaf resistance trait observed in the two growing seasons seem to suggest a reducing and non-contributory effect on leaf resistance inheritance. Across the 2 years and for both traits, the dominance genetic variance estimates ranged from zero to negative. The negative estimates were assumed to be zero (Robinson et al. Reference Robinson, Comstock and Harvey1955), but were reported as recommended (Dudley & Moll Reference Dudley and Moll1969; Nyquist & Baker Reference Nyquist and Baker1991; Bernardo Reference Bernardo2008). Additive genetic variance (polygenic genes) was positive for the two traits in the different growing seasons and is important for explaining genetic expression of Sclerotinia resistance in the inter-specific cross between B. incana and B. oleracea var. alboglabra. Again, this result is similar to previous reports where, in addition to epistatic interaction effects, polygenic effects control SSR in B. napus (Zhao & Meng Reference Zhao and Meng2003), cauliflower (Baswana et al. Reference Baswana, Rastogi and Sharma1991), soybean (Kim & Diers Reference Kim and Diers2000; Burnham et al., Reference Burnham, Dorrance, VanToai and St. Martin2003) and dry bean (Fuller et al. Reference Fuller, Coyne and Steadman1984).
Moderately high broad- and narrow-sense heritability for leaf traits in the 2009/2010 and 2010/2011 field seasons suggest equal participation of genetic and environmental control of leaf resistance inheritance, implying that selections made on the basis of these approximately equal heritability estimates may be misleading. However, narrow-sense heritability estimates, which were larger than broad-sense heritability estimates for stem resistance in the 2009/10 and 2010/11 field seasons indicate that additive components may play a major role in the improvement of the stem resistance trait. Low minimum numbers of genes estimates for leaf and stem resistance in the 2009/10 and 2010/11 field seasons suggest an underestimation of QTLs controlling both leaf and stem resistance traits. Similarly low minimum numbers of genes have been reported in different crop species including maize and cotton (Zalapa et al. Reference Zalapa, Staub and McCreight2006; Hao et al. Reference Hao, Yu, Dong, Fan, Ma, Song and Yu2008). One possible explanation for underestimation of QTLs may be due to a failure to meet the no allelic interaction (epistatic) and no dominance assumption made in the analysis.
In conclusion, the present results indicate that additive genetic variance formed the basis of the genetic variance for both traits across the 2 years and that genetic control of leaf resistance to S. sclerotiorum was different from that of stem resistance. In addition, it was found that significant multiple epistatic interactions control both leaf and stem resistance. Since expression of relative resistance for the two traits across the two growing seasons was quantitative, traits may be fixed by selfing after each backcross. Selection gains and identification of QTLs can be maximized for marker-assisted-selection using differential selection (tissue-based selection) on a replicated plot basis.
We acknowledge the financial support from the 863 (grant no. 2010BAD01B02), 111 project (grant no. B12006), NSFC (grant no. 31171585) and CSTC (grant no. 201180001). The authors thank Dr H Hull-Sanders (Penn State/USDA Otis Laboratory Buzzards Bay, MA) for critically reading the manuscript.