In the aftermath of the protests that swept across the Tibetan areas of four western provinces of China in spring 2008, many observers questioned whether such events – and subsequent protests such as the ongoing wave of self-immolations that started in 2011 – would spur the central government to re-evaluate its particularly hard line approach to Tibet policy under the first half of the Hu–Wen administration. A large part of the answer to this question lies with the continued subsidization strategies in the Tibetan areas during the second half of the Hu–Wen administration. Rapidly increasing subsidies had effectively inundated the local economies of these areas since the late 1990s under various so-called western development strategies – the “open up the west” campaign (xibu da kaifa 西部大开发) launched in 2000 being the most well known. Resurgent subsidies have since served as a primary pillar of Tibet policy, as a counterweight to an assimilationist social and political agenda in dealing with Tibetan minorities.
Viewed through this fiscal lens, the government appears to have taken its post-protest subsidization strategies to a higher level, as the financial dimension of a broader approach to pacification through overwhelming force. Subsidization in the Tibet Autonomous Region (TAR) – the province-level entity typically regarded as “Tibet”Footnote 1 – surged after 2008 and started to reach levels from 2010 onwards never observed in any other province or in any other period of the PRC. As calculated in this article, direct budgetary subsidies from the central government to the TAR local government exceeded 100 per cent of the TAR gross domestic product (GDP) for the first time ever in 2010, exceeding even the levels reached during the peaks of subsidization during the Maoist period in the late 1960s and 1970s. Thereafter, subsidization continued to surge, reaching almost 116 per cent of GDP by 2012. These figures do not include investment not financed by the TAR government expenditure, most of which is also probably subsidized (overall investment in fixed assets reached almost 96 per cent of the TAR GDP in 2012, although some of this would involve double counting with local government expenditure). On a per capita basis, direct budgetary subsidies were equivalent to 4.6 times the per capita rural household income in the TAR in 2012, a ratio that had increased from 0.9 in 1990, to 1.6 in 2000 and then to 4.1 in 2010. The divergence in the per capita figures serve as an indication of the extent to which subsidies have been disconnected from the living standards of the majority of the permanent resident (Tibetan) population, although the minor portion of subsidies that have reached Tibetan rural areas has been large enough, given the overall flow, to induce rising incomes and a rapid degree of local socio-economic transformation.Footnote 2
Despite this apparent exceptionality, the surge in subsidization in the TAR was not entirely an isolated experience insofar as it reflects broader strategies of subsidization across western China. The national response to the global financial crisis in 2007–09 involved a further invigoration of western development strategies and ever higher levels of investment in China as a whole. Indeed, while investment levels in the TAR were the highest in China throughout most of the 2000s, they were actually surpassed by those of Qinghai in 2011 and 2012, and were approached by those of Gansu. Trends in the TAR therefore need to be carefully differentiated from broader regional trends before attributing changes in the former as necessarily pertaining to Tibet-specific policy concerns whereas they might in fact be reflective of more general regional and even national dynamics.
While there are some good quality studies by Chinese scholars on subsidies in the TAR, these studies do not engage with this broader interprovincial comparison. Some of the most recent research is also not particularly up to date and hence does not provide any insight into the post-protest reactions of the government. For instance, the excellent and refreshingly critical study by Jin Wei 靳薇 on aid projects and subsidization strategies in the TAR – perhaps the most critical study to be published by such a prominent scholar in recent years – covers the period from 1952 to 2005.Footnote 3 It thereby misses most of the Hu–Wen administration and in particular the subsidy surge that occurred after 2005. Moreover, the large surge in subsidies that took place in the TAR from 2001 to 2003 was closely related to the railway construction that entered the TAR in 2003, which was planned prior to the Hu–Wen administration. It was also related to large administrative expansions in 2001 and 2002, also prior to the Hu–Wen administration.Footnote 4
This article brings our insights on these matters up to the end of the Hu–Wen administration. Based on publicly available data published up to 2013, it aims to differentiate subsidy trends within western China. The challenge in conducting such an exercise is that provincially disaggregated data on budgetary subsidies for a complete set of western provinces are not publicly available, such as in the various national or provincial statistical yearbooks (and no data is available on the degree to which investment is subsidized).Footnote 5 Nonetheless, sufficiently detailed fiscal data are available in the provincial yearbooks of Gansu, Guizhou, Qinghai, Shaanxi, and the TAR. With the exception of Shaanxi, these are also among the most subsidized provinces in China. A measure of net direct budgetary subsidies is deployed for these five provinces as a means to gain some comparative insights into the similarities and/or differences between trends in the subsidization of these provinces. Notably, three of these five provinces (Guizhou, Gansu and the TAR) were among the four poorest provinces in China in 2012 according to per capita GDP.Footnote 6 All five were among the six poorest according to per capita net incomes of rural households – the fourth poorest was Yunnan.Footnote 7 These data are supplemented with more general measures of transfer payments calculated on the basis of local government fiscal deficits and data on investment in fixed assets, both for the full range of ten western provinces.
The analysis is presented in two sections. First, the exceptionality of the TAR is clarified through a presentation of these data, in particular the surge of subsidies that occurred after 2008 and the disassociation of such subsidization from production in contrast to other western provinces where intensified subsidization and investment have been clearly associated with industrial restructuring. Second, the extremes of the TAR are interpreted through insights from trade balance data. The conclusion discusses some of the implications of the scaled-up subsidization strategies in the TAR, including the consolidation of the role of the state in the structuring of most aspects of the economy, the deepening integration of the TAR into China through externalized patterns of ownership and extreme economic dependence, and the unsuitability of conceptualizing these in terms of either cultural insensitivity or marketization.
Discerning Subsidies from Transfer Payments in China
Local government deficits in China (i.e. consolidated provincial expenditures minus revenues from both tax and non-tax sources) roughly represent net transfer payments from the central government to a province given that sub-central levels of government are generally not permitted to borrow in order to finance expenditures, such as through bond financing or borrowing from banks (with some recent exceptions in coastal China).Footnote 8 As detailed by Brys et al., sub-central levels of government do not even have taxing powers, although they receive a prescribed share of revenues from taxes that are divided between the centre and lower levels of government.Footnote 9 It is generally agreed that central transfer payments have been insufficient to cover the spending responsibilities also assigned to sub-central levels of government, which in turn has impelled these lower levels of government to rely on various forms of non-tax revenue generation.Footnote 10 Borrowing restrictions on sub-central levels of government have also been partly circumscribed by the practice of borrowing through local state-owned investment vehicles from local state-controlled financial institutions. This has allowed for a substantial degree of financing for investment projects in infrastructure construction and urban development, although such sources of finance technically do not enter into the fiscal data (except indirectly by way of resulting land transfer fees or other non-tax administrative fees that are accrued as a result of such investments). In this sense, effective sub-central government expenditure is a constrained combination of locally assigned tax revenue, transfer payments and the non-tax revenues local governments manage to mobilize.
Transfer payments, however, include tax revenue raised locally by the central government (i.e. centrally assigned revenue) and then transferred to lower levels of government within the same jurisdiction.Footnote 11 Such transfers cannot be considered subsidies proper in the sense of the regional redistribution of fiscal resources raised outside of a province and transferred to that province. Centrally assigned revenue is identified in some provincial yearbooks as “revenue turned over to the central government” (shang hua zhongyang shuishou shouru 上划中央税收收入). It amounts to the difference between “total revenue” collected in that province (caizheng shouru 财政收入) and the “general budgetary revenue” (difang yiban yusuan shouru 地方一般预算收入) available to the local government for spending, which includes locally assigned tax revenue as well as locally raised non-tax revenue.Footnote 12 Net subsidies (versus transfer payments) can be calculated by deducting such centrally assigned revenue from the local government deficit (or else by deducting total revenue from general budgetary expenditure, which amounts to the same). The western provinces for which these data are available are Gansu (up to 2010), Guizhou, Qinghai, Shaanxi, and the TAR.Footnote 13 Data are also provided on subsidies from the central government (guojia caizheng buzhu shouru 国家财政补助收入) for Qinghai and the TAR.Footnote 14 However, these subsidy data are not used here because they do not appear to take centrally assigned local revenue into consideration, i.e. they are not calculated as net of such revenue. Other discrepancies also put into question the consistency and comparability of these data with the other three western provinces for which centrally assigned local revenue data are available.Footnote 15
With respect to local budgetary revenue, expenditure and deficits (and hence centrally allocated transfer payments), all provinces in China were running deficits from 1994 onwards (the year of the major tax reform that re-shifted the bulk of total national revenue back into the hands of the central government), including Shanghai, Guangdong and other coastal provinces. Deficits as a proportion of GDP also increased with the government response to the global financial crisis in 2007–09, which has contributed to concern about the sustainability of local government finances in China and the debt loads that local state-owned enterprises (SOEs) have rapidly built up since 2008. However, at the aggregate level, provincial deficits were mostly covered by central surpluses. For instance, the total consolidated fiscal balance for all provinces was in deficit by 5.6 per cent of national GDP from 2004 to 2007, 6.6 per cent in 2008, 8.3 per cent in 2009 and 2010, 8.5 per cent in 2011, and 8.9 per cent in 2012. This was compensated by a central government fiscal surplus, which increased from 4.1 per cent of GDP in 2004, to 6.1 per cent in 2007, 6.6 per cent in 2010, 7.4 per cent in 2011, and 7.2 per cent in 2012.Footnote 16 Rising provincial deficits in this sense represent the debit side of increasing regional fiscal mediation by the central government, particularly after 2007. Indeed, fiscal reform efforts have aimed at relieving the financing pressures faced by sub-central levels of government, particularly in light of parallel attempts to reform and expand the social security and health insurance systems, which are mostly provided by these levels of government.Footnote 17
Increasing regional fiscal mediation was also supported by a gradual reduction in the central government share of total national government revenue (via an allowance for a greater rate of increase in sub-central revenue, including non-tax revenue), from around 55 per cent in the early 2000s, to 53.3 per cent in 2008, 51.3 per cent in 2010, to 47.9 per cent in 2012 (the lowest it had fallen since the tax reform in 1994). Nonetheless, this was paralleled by an increase in the share of sub-central government expenditures in total national government expenditure from 65.2 per cent in 2000, to 74.1 per cent in 2005, 78.7 per cent in 2008, 82.2 per cent in 2010, and 85.1 per cent by 2012.Footnote 18 The substantially greater increase in the share of sub-central expenditures than sub-central revenues helps to clarify the increasingly crucial role of transfer payments in balancing the regional fiscal system.
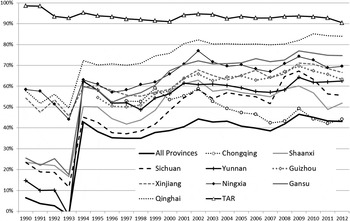
Deficits as a proportion of local government expenditure (i.e. the degree to which expenditure is financed by central government transfers) nonetheless remained more or less stable for the all-province fiscal balance. The proportions have been generally rising in most western provinces, reflective of the heightened role of subsidies in the various western development strategies since the mid-1990s, as evidenced in Figure 1. Large deficits started with the major tax reform in 1994, when the sum of consolidated fiscal balances for all provinces suddenly shifted from being balanced in 1993, with no net contribution from the centre, to a deficit equivalent to almost 43 per cent of expenditure in 1994. As discussed above, this was matched by a shift in the central government share of total government revenues from 22 per cent in 1993 to almost 56 per cent in 1994. Despite some oscillation, this proportion of deficit to expenditure in the all-province fiscal balance remained at 43 per cent in 2012. It is precisely this shift of revenue from the provinces to the central government that allowed the centre to subsidize the western region so intensively from the late 1990s onwards, first with the focus on western development in the Ninth Five-Year Plan, and then augmented under the “open up the west” campaign of the Tenth and 11th Five-Year Plans.
Local Government Deficit as a Proportion of Local Government Expenditure, 1990–2012

Western provinces have generally had a higher ratio of deficits to local expenditures than the all-province norm, reflecting the greater reliance on transfer payments that had been instituted since the Maoist regional development strategies in the 1960s.Footnote 19 Following the 1994 tax reform, there was an increase in the ratios of all western provinces besides the TAR, up to a peak in 2002 after which the ratios remained roughly at the respective 2002 level until 2012. The surge in this ratio for Sichuan from 2008 to 2010 was related to the relief and reconstruction efforts following the 2008 earthquake in that province, which is evident in the disaggregated government expenditure data.Footnote 20 In Chongqing, the relatively high level of deficit financing in the late 1990s was related to the creation of this province in 1997 and the associated construction of the Three Gorges Dam. The high ratio for Chongqing then dropped off after 2002 and joined the all-province average from 2008 onwards. The greatest increases in the reliance on transfer payments in most western provinces besides the TAR occurred in the late 1990s and early 2000s. Subsequent strategies mostly sustained the levels reached, but did not increase them further in a significant or sustained manner.
In contrast, the TAR was exceptional in the degree to which an extreme level of subsidy dependence was maintained throughout the entire period shown. The share in the TAR was already very high in the early 1990s, at almost 100 per cent in 1990 and 1991, and then declined slightly throughout the 1990s as economic growth was resuscitated in this autonomous region. The ratio nonetheless remained consistently well above 90 per cent; it was at the same level in 2012 (90.4 per cent) as it was in 2000 (91 per cent). Notably, the 1994 tax reform created no obvious change in this extreme dependence on transfer payments.
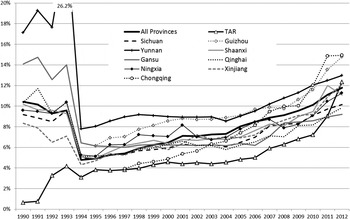
Local government revenue in the TAR had nonetheless increased substantially over these years. As shown in Figure 2, local budgetary revenue in the TAR had been at a low plateau of about 4–5 per cent of GDP from the early 1990s until 2006, which was the lowest level of local revenue to GDP in China (besides the first four years of Chongqing). This ratio then increased significantly after 2006, especially in 2011 and 2012, to the extent that it surpassed the all-province average in 2012, reaching 12.4 per cent of the TAR GDP. Ninety per cent of the steep increase in the TAR budgetary revenue, from 3.7 billion yuan in 2010 to 8.7 billion yuan in 2012, came from tax revenue, and by far the largest increase within tax revenue was from a very sharp increase in individual income tax, from a negligible sum of 0.2 billion in 2010 to 2.2 billion in 2012, or 44 per cent of the total increase in general budgetary revenue. The two other major sources were from an almost doubling of business tax revenue, or 18 per cent of the total revenue increase, and from corporate income tax, which accounted for 13 per cent of the total increase.Footnote 21 The sudden and sharp increase of individual income tax might have come as a result of criticisms of the generous allowances given to state sector employees working in the TAR, who had benefited from among the highest salaries in China – neck and neck with those of Beijing and Shanghai from 2001 to 2008.Footnote 22 For instance, a well-known Gongmen report criticized the government for creating a new aristocracy in the TAR through such generous wage policies.Footnote 23
Local General Budgetary Revenue as a Proportion of Local GDP, 1990–2012

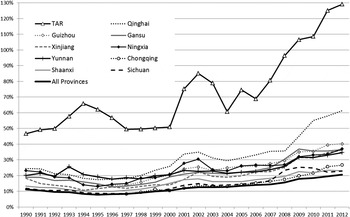
Nonetheless, the revenue increase only partially compensated the much greater increase in general budgetary expenditure in the TAR, which surpassed 100 per cent of GDP for the first time in 2009 and increased further to 109 per cent of GDP in 2010, 125 per cent in 2011, and 129 per cent by 2012, as shown in Figure 3. In nominal terms, the expenditure increased from 55.1 billion yuan in 2010 to 90.5 billion yuan in 2012. Hence, the revenue increase of 5 billion yuan amounted to only 14 per cent of the expenditure increase of 35.4 billion yuan. As a result, the TAR government budget remained overwhelmingly in deficit despite having reached the all-province norm of revenue generation relative to GDP.
Local General Budgetary Expenditure as a Proportion of Local GDP, 1990–2012

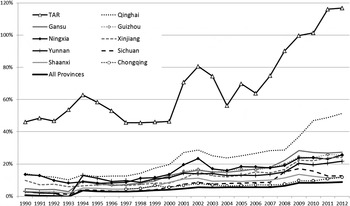
Owing to the fact that the TAR government expenditure was increasing rapidly as a proportion of GDP, the magnitude of deficits (and central transfer payments) reached record heights, as shown in Figure 4. Following a previous peak of 81 per cent in 2002 and then a trough of 64 per cent in 2006, the TAR government deficit surpassed 100 per cent of GDP in 2010 and then jumped to 116 per cent in 2011 and almost 117 per cent in 2012. These heights exceeded even the peak levels of subsidization during the Maoist period.Footnote 24 In contrast, whereas the extent to which expenditures in Qinghai were financed by transfer payments was approaching the levels of the TAR from 2010 onwards (for example, reaching 84 per cent in 2012), its deficit represented a much smaller proportion of GDP (51 per cent in 2012) because the expenditures also represented a much smaller share of GDP (61 per cent versus 129 per cent for the TAR). Hence, as with government expenditures, the TAR was exceptional in terms of the weight of these deficits (and transfer payments) relative to provincial GDP, even relative to the next most subsidized province in China.
Local Government Deficit as a Proportion of Provincial GDP, 1990–2012

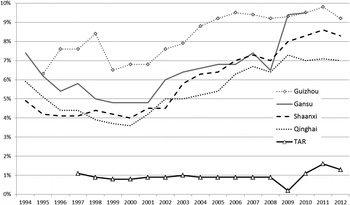
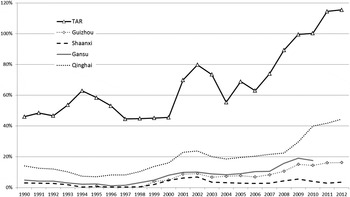
The magnitude to which such deficits represent net subsidies is presented in Figures 5 and 6 for the five western provinces with data available on revenue raised locally and assigned to the central government. Notably, despite the sharp increase in local government tax intake in the TAR, this was not matched by an increase in the central government tax intake in the TAR. Rather, revenue assigned to the central government in the TAR remained at around 1 per cent of GDP throughout the 2000s and increased only slightly to 1.3 per cent by 2012, versus substantial increases in other provinces from 2000 to 2012 (for example, from 6.8 per cent to 9.2 per cent in Guizhou, and from 4.8 per cent to 9.5 per cent in Gansu). In other words, local government revenue represented most of the total revenue collected in the TAR, in contrast to other western provinces where locally raised central revenue was a much more significant contributor to central transfer payments. By implication, the deficits in the TAR were mostly financed by central subsidies.
Local Revenue Assigned to the Central Government as a Percentage of GDP, 1994–2012

Net Subsidies as a Proportion of GDP, 1990–2012

This distinction bears little relation to poverty profiles given that the central government tax intake in these five provinces was the highest in Guizhou and Gansu, the two poorest provinces in China. Rather, the distinction appears related to the particular taxation policy of the central government in the TAR. For instance, the domestic value added tax (VAT) is the most significant source of national tax revenue and it is 75 per cent assigned to the central government.Footnote 25 Revenue from this tax in the TAR amounted to 8.4 per cent of total local government revenue in 2012, or 1.1 per cent of GDP. By implication, the central government intake of this tax should have been three times this amount, which was obviously not the case. The discrepancy possibly reflects VAT exemptions made by the central government to businesses operating in the TAR or that so much of the consumption in the TAR is of imported goods (recalling that the VAT in China is a production-type of VAT).Footnote 26
The amount of net subsidies as a proportion of GDP is shown in Figure 6, based on deducting centrally assigned local revenue (Figure 5) from the deficit data (Figure 4). The pattern for the TAR is logically much the same as with the deficit measure, given that the central government tax intake is so limited. According to this measure, subsidies also surpassed 100 per cent of GDP in 2010, and reached almost 116 per cent by 2012, just slightly lower than the deficit, which reached almost 117 per cent. In contrast, the rate of subsidization was relatively less in the other provinces, particularly in Shaanxi where the deficit was equivalent to 11.9 per cent of GDP in 2012, but subsidies were only 3.6 per cent of GDP, with the difference made up by central government local revenue collection of 8.3 per cent. Similarly, the difference in Guizhou was 25.4 per cent versus 16.2 per cent; in Gansu, 27.1 per cent versus 17.6 per cent (in 2010), and in Qinghai, 51.4 per cent versus 44.3 per cent. The extent to which expenditures were subsidy financed (versus deficit financed) was also less extreme. Subsidies were as low as 15.8 per cent of expenditures for Shaanxi in 2012 (versus a deficit equal to 51.8 per cent of expenditures); 40.3 per cent for Guizhou (versus 63.2 per cent); 49.3 per cent for Gansu (versus 74.7 per cent, again in 2010); and 72.4 per cent for Qinghai (versus 83.9 per cent). The subsidy/GDP trends were broadly similar to the deficit/GDP trends insofar as there was a rising degree of subsidization during the Hu–Wen administration in all of these provinces except Shaanxi.
The contrast with these other four provinces in terms of subsidies rather than deficits makes the sharp subsidy intensifications in the TAR appear all the more exceptional, such as from 2001 to 2003, from 2007 to 2009, and then in 2011 and 2012. By 2012, the TAR was 2.6 times more subsidized, relative to its local economy, than Qinghai, the next most subsidized province in China. This clearly shows the extremity of the subsidization priority given to the TAR, particularly in the second half of the Hu–Wen administration.
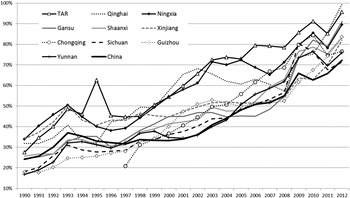
As noted above, this measure of direct budgetary subsidies does not include indirect subsidies, referring mainly to subsidized investments. Investment as a proportion of GDP rose rapidly throughout western China, and the TAR was only exceptional insofar as it led this trend for much of the decade, as shown in Figure 7. Nonetheless, the TAR was surpassed by Qinghai in 2011, where investment reached almost 100 per cent of GDP in 2012 (versus almost 96 per cent in the TAR). The trends in Gansu and Ningxia after 2008 were also almost identical to the TAR, suggesting a north-western regional pattern with which the TAR might have been associated. The upsurge in investment from 2008 to 2010, and then again in 2012, is notable in all of the cases and represents by far the highest levels of investment recorded in the PRC.Footnote 27 Hence, whereas relatively high levels of investment once appeared exceptional to the TAR, Qinghai and Ningxia in the early to mid-2000s, these levels became the norm across all of western China after 2008. This reflects the degree to which investment in fixed assets drove China's response to the global financial crisis, as well as efforts to re-orient aggregate demand towards domestic sources, and in which western development strategies have played a key role.
Investment in Fixed Assets as a Proportion of GDP, 1990–2012

Despite these similarities, the exceptionality of the TAR is again found in the extent to which investment has been subsidized from outside the province. Data are not available to substantiate this, although we can assume that the extent of subsidization in investment is similar to the extent of subsidization in local budgetary expenditures, as the latter would reflect the capacity of the local economy to finance high levels of investment. This would imply that the bulk of investment in the TAR is financed by the central government (for example, the railway was entirely subsidized by the Ministry of Railways), to a lesser degree by various coastal provincial governments (such as with aid projects subsidized by various coastal provinces), or by local government expenditure, which is mostly subsidized.
This deduction is supported by several unique characteristics that sharply differentiate investment in the TAR from all other provinces in China. One is the fact that state-owned units (SOUs) still accounted for 65 per cent of investment in the TAR in 2012, versus 46 per cent in Qinghai, 44 per cent in Gansu, 32 per cent in Sichuan, and 26 per cent in China.Footnote 28 The share in the TAR had fallen since 2001, when SOUs accounted for 95 per cent of total investment, or even since 2010, when the share was 72 per cent.Footnote 29 However, much of the fall was compensated for by the rise in the vague category of “other,” which had risen from 3 to 9 per cent of total investment between 2004 and 2012, whereas it was marginal in most other provinces. This category might refer to certain grey areas of state-ownership or control, such as government controlled NGOs.
Second, 56 per cent of the investment in the TAR in 2012 was financed through the state budget (which was mostly subsidized), versus only 19 per cent in Qinghai, 13 per cent in Gansu, 12 per cent in Xinjiang, 9 per cent in Sichuan, and 5 per cent in China overall.Footnote 30 Self-raised funds accounted for another 29 per cent of investment financing in the TAR. Self-raised funds were also the dominant source of investment financing in all other western provinces, as in China as a whole. However, it is likely that the large part of such funds in the more intensively subsidized provinces was raised outside the respective province and that most of these funds in the TAR would have been “self-raised” by SOEs outside of the TAR. Domestic loans were also a significant source of investment financing in several other poor western provinces, for example, 22 per cent in Qinghai, 23 per cent in Ningxia, and 20 per cent in Guizhou (all in 2012), whereas this source of financing was very marginal in the TAR, at barely 1 per cent of investment in 2012. In sum, it is likely that the majority of investment financing in the TAR came from subsidized out-of-province sources, either directly or via TAR government expenditures, while other western provinces showed much more capacity for local and/or non-subsidized financing.
The combined weight of direct budgetary subsidies and indirect subsidies via investment is difficult to calculate given the lack of data and also double counting across the government expenditure and investment data. Government expenditure data up to the 2007 China Statistical Yearbook included the category “expenditure for capital construction,” which reflected investment financed directly by local governments.Footnote 31 However, this category was discontinued in the expenditure reporting from the 2008 China Statistical Yearbook onwards. Using these data up to 2006 and assuming that all investment in the TAR was subsidized, direct and indirect subsidies roughly passed 100 per cent in 2001 and rose to 127 per cent of GDP by 2006.Footnote 32 Given the sharp increases in both budgetary subsidies and investment as proportions of GDP since 2006, we can presume that the combined subsidies were much higher than this by 2012, probably well above 150 per cent of GDP. In Qinghai, the next most subsidized province, subsidies reached 44 per cent of GDP in 2012 and investment reached 100 per cent of GDP, although the overall level of subsidization most likely remained below 100 per cent of GDP, given that investment in Qinghai was only 19 per cent financed through the state budget. The levels of subsidization in Qinghai by 2012 were equivalent to those of the TAR in the late 1990s, but it is only in the TAR where such extreme levels of subsidization have been observed more recently.
The other key difference is that subsidization in Qinghai appears to be associated with a vigorous industrialization of the local economy, whereas it has been consistently divorced from productive concerns in the TAR despite similar rates of rapid GDP growth. It suffices to point out that the GDP share of industry and mining in the TAR remained at more or less a consistent share, from 7.3 per cent of GDP in 1995 to 7.9 per cent of GDP by 2012, while rapid growth was dominated by the tertiary sector and construction. The tertiary sector in the TAR, which has been disproportionately constituted by government administration, increased from 34 per cent of GDP in 1995, to 46 per cent of GDP in 2000 and then to 55 per cent in 2002, and subsequently remained at that level until 2012, when it accounted for 54 per cent of GDP. Construction reached almost 27 per cent of GDP by 2012, apparently delinked from local industry and mining. In contrast, industry and mining in Qinghai went through a period of intensive restructuring in the late 1990s and early 2000s, remaining at around 31 per cent of GDP until 2003, while construction peaked in 2003 at 16 per cent of GDP. Industry and mining in Qinghai then surged to 47 per cent of GDP by 2012, and construction fell back to a share of around 10 per cent of GDP. Similar although less intensively subsidized patterns of industrial restructuring and regeneration were observed in Gansu and other western provinces.Footnote 33 It is only in the TAR where a particular economic model has emerged that is centred on government administration, tourism and construction disconnected from local production.
Interpreting the Extremes of the TAR
That such intensive subsidization of the TAR economy would be able to generate high rates of GDP growth is not at all surprising. The sustainability of the model is also not particularly problematic given that the magnitude of the subsidies is small relative to national government finances. For instance, the budget deficit of the TAR, at 117 per cent of its GDP in 2012, accounted for only 1.8 per cent of the total of all provincial government deficits in 2012 (albeit, for only about 0.2 per cent of the national population). The budget deficit of Qinghai, at 51 per cent of its GDP in 2012, similarly accounted for only 2.1 per cent of the total regional deficit (for about 0.4 per cent of the national population). The sustainability issue is more of a concern for large provinces such as Sichuan, with a deficit at 13 per cent of its GDP in 2012 accounting for 6.6 per cent of the total regional deficit, for 6 per cent of the national population, or Xinjiang, with a deficit of 24 per cent of its GDP accounting for 3.9 per cent of the total regional deficit, for 1.6 per cent of the national population. However, as analysed above, much of these larger deficits are financed by central government revenues collected within the respective provinces. They are also sustainable to the extent that they are counterbalanced by central government fiscal surpluses and the continued political commitment of the central government to regional redistribution.
Rather, it is the inefficiency of such subsidization in the TAR (from a local economy perspective) that has consistently raised political attention and debate in China since at least the 1980s, particularly in light of the fact that per person subsidies in the TAR have been many multiples of those of other poor western provinces. This fuels the perception that Tibetans are being pampered, even though most subsidies probably never reach the average Tibetan, as reflected by the fact that per person subsidies in the TAR were 4.6 times the average per person rural household income in 2012, up from 0.9 in 1990.Footnote 34 Notably, according to the 2000 census, Tibetans in the TAR were 85 per cent rural, and the TAR rural population was 97 per cent Tibetan.Footnote 35
Efficiency concerns have been particularly prominent since the 1980s, as highlighted by Wang Xiaoqiang and Bai Nanfeng in the 1980s, Yan Hairong and June Teufel Dreyer with reference to the 1990s, and more recently by Jin Wei.Footnote 36 The principle concern is that an increasing degree of subsidization is required in order to sustain a consistent rate of growth. This is usually measured in terms of the elasticity of growth to subsidies (or the multiplying effect of subsidies on growth), calculated as the increase in GDP value associated with a per unit increase in the value of subsidies. If calculated on a five-year basis, roughly matching the five-year plans, the TAR exhibited a declining multiplier effect of direct budgetary subsidies on growth (not including subsidized investments that were not financed by local government expenditures), to the extent that the multiplier fell below one during the 12th Five-Year Plan (2006–2010): for every one yuan increase in such subsidies, the GDP actually only increased three-quarters of a yuan.Footnote 37 This implies that the increase in subsidies created inefficiencies elsewhere in the economy or else outflows from the economy altogether, such that part of the effect of the increase was cancelled out. If subsidized investments were included in this measure, the multiplier would be even lower and would have fallen below one even earlier, possibly as early as 1999.Footnote 38
The negative multiplier effect of subsidies in the TAR effectively represents a return to the state of affairs during the Maoist period. For instance, Wang and Bai recorded a negative multiplier effect of subsidies on growth for the period from 1957 and 1983 in the TAR and Qinghai.Footnote 39 According to their data for the TAR, this situation started precisely in 1968, when the proportion of central government subsidies to output value (equivalent to the subsidy/GDP measure above, although not including the tertiary sector)Footnote 40 increased sharply, reaching 80 per cent in the 1970s and 97 per cent in 1980–83. Notably, they did not clarify that this intensification of subsidies occurred simultaneously with the late implementation of rural collectivization in the TAR, which only started to be fully implemented in 1969 and in the midst of the Cultural Revolution and intensive interior industrialization strategies.Footnote 41 Similar patterns continued in the context of reform in the sense that the real per capita GDP of the TAR was recessionary from the mid-1980s to the mid-1990s, despite the exceptional persistence of subsidies at close to half of GDP (whereas subsidies dropped substantially in other western provinces).Footnote 42 By the mid-1990s, the combined immensity of investment and subsidy increases served to buoy up real per capita GDP, although in an increasingly inefficient manner. Recent development strategies in the TAR have not altered the pattern of the very intense and very inefficient subsidization observed since the late 1960s in any significant way.
This has led to a renewal of criticisms, particularly in the aftermath of the 2008 protests. As noted in the introduction, perhaps the highest profile criticism to date has come from Jin Wei, director of ethnic religious studies at the Central Party School of the Communist Party of China in Beijing. During a presentation based on a studyFootnote 43 of 987 central government aid projects to the TAR between 1984 and 2005 at a forum on ethnic minority development hosted by Minzu University in Beijing on 15 December 2012, Jin Wei raised concerns about poor efficiency and noted in particular that many programmes had failed to consider cultural contexts.Footnote 44 A number of other scholars at the forum followed suit by stating that aid policies to ethnic regions needed to adapt to local conditions and include participation from local communities.
While noteworthy for their expressions of cultural sensitivity, these criticisms nonetheless place the blame for inefficiencies on institutional modalities of aid delivery rather than on the more fundamental structural drivers of subsidy inefficiency rooted in the mode of economic integration imposed on the TAR. These drivers would persist even in the absence of cultural insensitivity. Indeed, the most straightforward reason for the economic inefficiencies observed in the TAR is that a large proportion of government expenditure and subsidies is spent on imports from abroad or from elsewhere in China, as partially reflected by the provincial trade data.
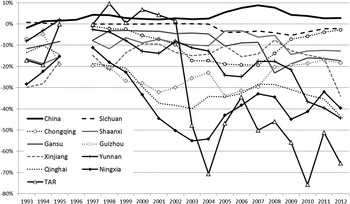
The provincial international trade balances calculated from the expenditure approach of provincial GDP accounting are shown in Figure 8. According to the expenditure approach, net imports (i.e. imports in excess of exports) are deducted from GDP calculations (i.e. GDP = consumption + investment + net exports), whereas they are not deducted from government expenditure or investment data. Hence, the expenditure or investment data can appear inflated in comparison to the GDP data to the extent that they are associated with a trade deficit, particularly if they are the cause of the trade deficit.
Provincial International Trade Balance as a Percentage of Provincial GDP, 1993–2010

This has been the case from 2003 onwards in the TAR, when its international trade balance suddenly fell from a slight surplus in 2002 to a massive deficit equivalent to 48 per cent of GDP in 2003 and 71 per cent in 2004. There was a correction after 2004, although the trade deficit remained at around 50 per cent of GDP, until it plunged again in 2010 to 76 per cent of GDP and remained at 66 per cent in 2012. The two periods when the trade account plunged into severe deficit – 2003–04 and 2010 – both corresponded to strong increases in the ratio of investment to GDP (as shown in Figure 7). The re-descent into deficit in 2010 was also strongly associated with the sharp increase in government expenditure to GDP over several years (Figure 3), suggesting a continued use of government expenditure for investment and capital formation. In 2003–04, the trade deficit was probably explained by the import of high-tech goods and related services, such as rail carriages from Bombardier in Canada, IT goods and services from Nortel in Canada, and the subcontracting of Japanese and other international engineers, for the large-scale railway construction that entered the TAR in 2003 and peaked in 2004. The variations in the trade deficit since then also probably reflect the import-intensive input needs of various large infrastructure projects in the TAR, such as the continued extensions of the rail network.
To a certain extent, the TAR context was not exceptional in western China. Development strategies in western China have generally been very import intensive, exhibiting substantial and often deepening trade deficits, even in the case of Xinjiang with its lucrative mining and hydrocarbons. This is in contrast to national trade surpluses driven by coastal provinces. Several north-western provinces with relatively small populations – namely Qinghai and Ningxia – experienced deep international trade deficits in the same range as the TAR from the late 1990s onwards. Ningxia's international trade deficit fell to 55 per cent of GDP in 2003, while Qinghai's fell to 40 per cent of GDP in 2003 – probably also connected to railway and related construction – and then reached 44 per cent by 2012. Hence, to a certain extent, the TAR joined this pattern (or re-joined after a respite from 1995 to 2002), albeit in a particularly sudden and dramatic manner. The exception was the disassociation of the deficits in the TAR from industry and mining, versus the close association of intensifying trade deficits and industrial restructuring in other western provinces, as discussed above.
The extent to which subsidies are spent on such imports helps to explain a large part of the discrepancy between subsidies and GDP in the TAR given that trade deficits are deducted from GDP but not from the government expenditure data. Indeed, the same would apply in other western provinces. Even if subsidies are not spent on imports, the monetary effect is the same in the sense that government subsidies amount to a direct and immediate monetary injection into the local economy (if they are not syphoned off before arriving in the province), while the trade deficit amounts to a direct and immediate monetary drain out of the local economy. Hence, this aspect of national accounting explains much of the apparent inefficiency associated with the intensification of subsidies in the 2000s. However, inefficiencies pre-dated the descent into international trade deficit in 2003. In other words, the weight and inefficiency of subsidies in the TAR economy are more endemic than a spending spree by the government on the latest high-tech railway and related gadgetry.
The more inherent and intractable aspect of this structural dimension follows the same logic, except with respect to the rest of China rather than the international economy. Similar to international trade, the TAR is most likely running a very large trade deficit with other provinces in China – and particularly with Sichuan, which supplies much of the interprovincial goods and services used in the TAR. This is in accordance with earlier analyses made by Wang and Bai who noted that the trade gap between Qinghai and the rest of China was equivalent to 84 per cent of the total subsidies to Qinghai in 1983, and that the TAR's trade gap was equivalent to over 58 per cent of the total subsidies to the TAR (or the same proportion of total output, given that subsidies were equal to total output in that year).Footnote 45 They also pointed out that 94 per cent of merchandise sold in the TAR in 1983 was imported from the rest of China and that financial outflows in some cases were also equivalent to the entire sum of central government subsidies.Footnote 46 This is actually the simplest and most straightforward explanation for the various macroeconomic attributes of the TAR, although these interprovincial trade data are no longer available.
The measurement of interprovincial trade balances was rendered impossible with the breakdown of state control over such trade in the 1980s. The lack of data is a problem because it is not clear to what extent, if at all, the interprovincial trade deficit is deducted from the calculation of provincial GDP.Footnote 47 If the interprovincial trade deficit in final goods and services has been deducted, then this would help to explain that the apparent inefficiencies of subsidies are due to the same reasons discussed above with respect to international trade deficits. However, if the interprovincial trade deficit has not been deducted, then the GDP data would be inflated by subsidies spent on interprovincial imports. This would not explain the inefficiency of subsidies, although it would imply that we have little idea of the actual level of GDP in the TAR, if properly calculated. It is likely that an unknown but definitely large and probably increasing proportion of the GDP would effectively represent the net purchases of goods and services from other parts of China rather than value-added produced in the TAR. The GDP data of other western provinces would also contain similar problems, although the extent of interprovincial trade deficits is probably much less in these other provinces given the presence of substantial secondary production activities, including in Qinghai and Ningxia. The paucity of productive activities outside of agriculture in the TAR would increase its dependence on imports from the rest of China in order to supply its consumption needs, particularly within its rapidly growing urban areas.
We can surmise that the interprovincial trade deficit of the TAR is probably increasing given structural changes in the local economy that proportionately shift the structure of demand towards imports. These include the declining GDP share of the primary sector, which is the only sector that is largely based on locally produced inputs in the TAR, the increasing share of import-intensive construction, and the related urbanization of the TAR population which then adopts more import-intensive consumption patterns. An important corrective on the export side is the booming trade in caterpillar fungus, although this too mostly goes unrecorded. The expansion of tourism in the TAR can also be seen as one strategy to correct the trade imbalance through the service account, although tourist industries have an endemic tendency – particularly in poor peripheral regions where the tourism sector is dominated by outsiders, as it is in the TAR – to intensify import demand and also to exacerbate other forms of financial outflow, thereby cancelling out much (and sometimes all) of the impact this sector can have on improving a trade balance. Similar problems arise for mining, which remains relatively limited in comparison to other western provinces, despite the speculation that subsidization strategies in the TAR have been oriented towards natural resource exploitation.Footnote 48 Beyond these obvious counterweights, it is likely that a substantial portion of subsidies is being syphoned out of the local economy through the remaining interprovincial trade deficit.
The subsidies that do manage to trickle down past the major diversions and drains of monetary aggregate demand still might amount to a considerable stimulus for the local economy in the TAR.Footnote 49 However, in the highly perforated nature of such an increasingly import-dependent economy, it is also clear how such a stimulus could become quite cloistered and underlain with a strong tendency for monetary outflows if and when there would be any lapse in the government's constant vigilance of directing monetary flows to various peripheral parts of the economy. As a result, even more so than in the 1970s, 1980s and even 1990s, economic growth metrics largely reflect the intensification of subsidies, in contrast to other western provinces where intensive subsidization has been directed towards restructuring the productive foundations of local economies.
Conclusion: Instituting Extreme Dependence in Tibet
The economy of the TAR has been rooted in heavily subsidized state-led development strategies initiated during the Maoist period and sustained throughout the early reform period. During the Hu–Wen administration, subsidies reached levels never before observed in the history of the TAR or elsewhere in China, especially following the 2008 protests in Tibet. Increasing levels of subsidization and investment were also common in the rest of western China, suggesting that much of the subsidy surge in the TAR was a reflection of the more general, national response to the global financial crisis of 2007–09. Nonetheless, the levels attained in the TAR are exceptional, even when considering these broader dynamics. They were also notably disassociated from changes in the local productive economy and have accentuated a particularly externalized mode of economic circulation and accumulation.
The exceptionality of the TAR suggests that the central government's response to the 2008 protests in Tibet was to amplify even further the subsidization strategy started at the beginning of the decade despite indications that this strategy was one of the prime factors inciting the protests in the first place.Footnote 50 This response might be seen as a financial expression of overwhelming power or as an attempt to reinforce a state of extreme dependence on the central government, in addition to parallel motivations such as poverty reduction. While sustainable from the perspective of central government finances given the small size of the TAR economy, the strategy has nonetheless exacerbated many of the pre-existing inefficiencies in the local economy, poignantly reflected by the declining multiplier effect of subsidies on growth, which became negative during the 11th Five-Year Plan. The inefficiencies are in part explained by the sharp worsening of international trade deficits (and, we can presume, interprovincial trade deficits with the rest of China). These reflect the import intensity of the various mega-infrastructure projects underway such as the Qinghai–TAR railway, which dwarfed the local economy, ongoing extensions of the railway to other locations in the TAR, and other large-scale projects, including the building of a 30 billion yuan tourist theme park outside Lhasa.Footnote 51 As a result, rapid economic growth over this period has been a reflection of the intensification of subsidies. To a certain degree, we do not even know the true value of the GDP given the pervasive dependence on imports in the local economy, although the strategy has allowed for a huge scaling up of infrastructure. The inefficiencies might appear sensible from the perspective of national industrial policy, insofar as subsidies might have been used to raise the capabilities of various national enterprises in dealing with complex engineering projects and advanced infrastructure technologies. Nonetheless, despite almost 20 years of intensive efforts since the central government started to prioritize development in the west of China and the TAR came out of a ten-year recession in the mid-1990s, this autonomous region has remained locked into the structural norms established during the Maoist period.
Regardless of the precise motivations for this strategy (on which we can only speculate),Footnote 52 this recent phase of intensive subsidization has effectively completed two principal tasks first envisaged during the Maoist era. One is the state-led engineering of a deep integration of the region into China through externalized patterns of ownership and/or control as the institutional basis for the TAR economy, thereby entrenching an extreme form of dependency as the modus operandi of the local economy. This is in contrast to every other province of western China where local productive concerns have been given far more attention. While source locations of ownership cannot be substantiated with publicly available data, external dominance can be clearly inferred through the particular characteristics of investment in the TAR, as well as by the sheer extent of subsidization of both government expenditure and investment in the local economy, as discussed in the first section. The second task is consolidating the role of the state in structuring most aspects of the economy, including the rural economies, despite the increasing use of a marketizing rhetoric to justify various policy interventions (such as resettlements). As a result, the economy of the TAR can be described in structural terms as having become a peripheral subsidiary of the central government and related interests. Local development dynamics (and people) are increasingly captive to the discretion of these central interests. Indeed, the strategy has occurred alongside a rapid shift in livelihoods out of agriculture, implying that this most recent phase of subsidization has probably irreversibly or irremediably locked even rural Tibetans into this trajectory of economic dependence.Footnote 53
The predominance of the state in the TAR economy puts into question the idea, as argued by Wang Hui, that the “complete permeation of market relations” in the Tibetan areas is vital to understanding recent social tensions.Footnote 54 The increased competition for jobs in Tibetan urban areas owing to the context of open migration and the erosion of preferential employment practices might be understood in terms of a marketization of employment relations within these areas, especially with reference to public employment.Footnote 55 However, generalizing the idea of marketization as an explanatory framework for the overall situation in Tibet de-emphasizes the extent to which both market dynamics and current social tensions are shaped by state policy. In particular, the state plays an overwhelming role in these areas in driving changes in the structures and institutional terms of employment. Generalizing the idea of marketization also de-emphasizes the potential that exists for mediating these dynamics and tensions through changes in state policy. In light of the fact that subsidies are so inefficient in the TAR (from a local economy perspective), the external biases that guide contracting, procurement and employment practices cannot be argued to be a necessity of economic efficiency. The argument that preferential policies towards Tibetans reduce economic efficiency holds little relevance outside of a narrow firm-level, cost-benefit perspective.
Alternatively, the suggestion that these outcomes are the result of cultural insensitivity or a lack of consideration of local conditions, as argued by Jin Wei,Footnote 56 also understates their fundamentally structural character. Taken in isolation, this criticism implies that greater cultural sensitivity would result in a greater efficiency of subsidies, or even that the development models that work for Han Chinese do not work in the distinct cultural context of Tibet. Proponents of this more moderate position in China do not necessarily question the necessity of deepening the integration of the TAR into China, but argue instead for more gradualist modes of integration and eventual assimilation (or acculturation). While not necessarily implied by scholars such as Jin Wei, this logic can nonetheless be easily interpreted according to the culturalist arguments of Wang and Bai, who blamed the inefficiencies and disfunctionalities of the TAR economy on the intrinsic backwardness of Tibetans rather than on central or local government policies.Footnote 57 The logic thereby tends to undermine arguments for empowering local agency through the enhancement of local ownership, and instead evokes the need for a return to vanguard state paternalism when dealing with minority regions, albeit along more culturally sensitive, gradualist lines. Wang and Bai's argument was especially ironic given that the TAR rural economy had barely de-collectivized at the time of their field research in the early 1980s, after being completely collectivized a little more than a decade earlier. There was little that was intrinsic in the conditions that the authors had observed in these regions. The urban economy itself remained almost entirely state controlled. It was more likely managed by Han rather than Tibetan cadres up until 1981, but both were probably somewhat disoriented by the ambiguous, and often lagged, reforms coming by way of directives from the east. Despite such dissonances, this culturalist line of analysis remains common in China, particularly in the aftermath of the 2008 protests in Tibet.Footnote 58
The most straightforward reason for the economic inefficiencies observed in the TAR is to be found in the structural patterns of economic integration with the rest of China, and in particular through the overwhelming dominance of economic units owned and/or controlled from outside the province. These patterns result in an externalized rather than indigenous institutional mode of economic circulation and accumulation. The perverse characteristics of this subsidized economic model, both past and present, cannot be attributed to local Tibetans given that local Tibetans have had little to do with the conception or path of this model. This has especially been the case since the rapid intensification of subsidies under the Hu–Wen administration, which was combined with a strong assimilationist orientation in labour and social policies. Such characteristics are unlikely to be significantly modified by increased cultural sensitivity in the application of various development strategies so long as the structures of ownership and power in the local economy remain unaddressed, and the principles of autonomy that were the original foundation for incorporating this region into China in the 1950s continue to be eroded.