

In the period following the September 11 terrorist attacks, incidents of discrimination and hate crimes against Muslim Americans have dramatically increased (Cainkar Reference Cainkar2002; Morello Reference Morello2011; Frumin and Sakuma Reference Frumin and Sakuma2016; Lichtblau Reference Lichtblau2016), with numerous mosque and Islamic center projects generating tremendous elite and public opposition (Wajahat et al. Reference Wajahat, Clifton, Duss, Fang, Keyes and Shakir2011).Footnote 2 Extant research further suggests that the public evaluates Muslim Americans more negatively than nearly all other racial, ethnic, or religious groups (Edgell, Gerteis and Hartmann Reference Edgell, Gerteis and Hartmann2006; Putnam and Campbell Reference Putnam and Campbell2010; Lajevardi and Oskooii Reference Lajevardi and Oskooii2018). This rising tide of anti-Muslim sentiment (Lajevardi and Abrajano Reference Lajevardi and Abrajano2018; Tesler Reference Tesler2018), which some suggest may have been partly driven by negative media coverage (Lajevardi Reference Lajevardi2017), has since translated into tangible legislative action. In 2011, 78 bills were introduced in 29 state legislatures and in Congress under the premise that “Sharia” or “Islamic law” is permeating the legal and judicial systems and thus must be eliminated (CAIR, 2013). In 2016, 10 states successfully passed such legislation into law and 15 additional states introduced similar bills (CAIR, 2016; NCSL, 2017).
The ongoing War on Terror, more recent incidents of terrorism in the United States and abroad, and Donald Trump's anti-Muslim rhetoric throughout much of the 2016 presidential campaign may have worsened the conditions for the American Muslim community (Calfano, Lajevardi and Michelson Reference Calfano, Lajevardi and Michelson2017). Ten days after the election of Donald J. Trump to the presidency, the Southern Poverty Law Center released a report detailing the rise of instances of harassment and intimidation faced by stigmatized groups, many perpetrators of which invoked the name of the incoming president.Footnote 3 In all, nearly 1,000 instances were reported, with Muslim Americans comprising a significant number of the victims. For example, hateful letters were sent to the mosques and cultural centers describing Muslims as “vile and filthy people,” among other epithets (SPLC, 2017).Footnote 4 A Muslim woman interviewed by a recent Pew study of Muslim Americans stated in plain terms the impact such events have had on the Muslim community: “A lot of us Muslims, we don't feel safe here anymore. Trump is kind of painting a bad picture for Muslims.” (69, Pew, 2017).
In this context of heightened discrimination, women who wear the hijab may be particularly vulnerable, because the headscarf is a visible marker of Muslim identity. Numerous women have reported being grabbed by their hijab by unknown attackers, including a San Jose State University student who was choked when a man pulled her head scarf from behind in a parking garage (SPLC, 2017). Experiences with anti-Muslim harassment and intimidation have been so prevalent that some women have contemplated altering their dress for self-protection, with some Muslim clerics even issuing a fatwa (non-binding legal opinion) permitting women to forgo wearing the hijab as it puts those who wear it in danger (Haddad Reference Haddad2007).Footnote 5
Muslim is an identifier, not necessarily ascriptively apparent, that describes a religious affiliation and a component of culture for those originating from majority-Muslim countries. However, especially after 9/11, Muslim Americans have become increasingly racialized and external markers of dress, skin color, accent, and language function as heuristics for a religion constructed as a threat to American culture and national security (Jamal Reference Jamal and Sinno2009; Selod Reference Selod2015). Within this context, the hijab is a meaning-making clothing accessory. Reasons for wearing it vary, but most women who wear the hijab do so by choice as an expression of identity, religious conviction, and empowerment (Bartkowski and Read Reference Bartkowski and Ghazal Read2003; Williams and Vashi Reference Williams and Vashi2007; Sloan Reference Sloan2011). Even so, some see the hijab as a backward relic signifying Muslim women's oppression within Islam (Williams and Vashi Reference Williams and Vashi2007; AlWazni Reference AlWazni2015).
While some research has found that women who wear headscarves face discrimination in hiring (Ghumman and Ryan Reference Ghumman and Ryan2013) and are perceived as less intelligent and attractive (Mahmud and Swami Reference Mahmud and Swami2010), systematic examinations of perceived discrimination among this population are still scant. To date, research has not fully examined how the hijab contributes to the marginalization of women in a variety of sociopolitical settings or what additional factors correlate with the perceptions of discrimination among Muslim Americans more generally. Our study addresses this gap by asking the following questions: What is the role of the hijab in aggravating the process of racialization? How do women who wear the hijab differ in their experiences with discrimination from their non-hijabi counterparts? Footnote 6 Do Muslim men and women perceive similar levels of discrimination? What additional factors impact perceived discrimination among all Muslim Americans?
In what follows, we argue that the hijab is a central component of self-reported experiences with discrimination and that Muslim Americans are racialized in ways that are highly gendered. To evaluate our theory, we leverage two surveys on Muslim Americans collected in 2007 and 2011 by the Pew Research Center.Footnote 7 Our results show that women who wear the hijab are significantly more likely than their counterparts to report having experienced discrimination across multiple domains. When compared with other predictors of self-reported discrimination, wearing the hijab is among those indicators with the largest impact. Interestingly, we also find that the inclusion of hijab in the multivariate analysis helps clarify the complex relationship between gender and perceived discrimination. Accounting for hijab reveals that men are actually more likely than non-hijab-wearing women to report discrimination across nearly all of the tested measures—a point which we will return to later. Given that substantive citizenship, personal safety, mental health, and well-being are at risk for the victims of discrimination (Padela and Heisler Reference Padela and Heisler2010; Hodge, Zidan and Husain Reference Hodge, Zidan and Husain2015), our analysis raises concerns for the advocates of civil and human rights. Likewise, our analysis suggests that the evaluations of the sociopolitical experiences of Muslim Americans—arguably the most marginalized group in the American politics today—should consider the role of gender and the hijab, largely overlooked by this body of work.
THE RACIALIZATION OF MUSLIM AMERICANS
There is a considerable evidence that Muslims have historically been linked to the stereotypes of violence, intolerance, and extremism (Said Reference Said1979; Esposito Reference Esposito1999; Shaheen Reference Shaheen2003), and that the attacks on September 11, 2001 and subsequent eventsFootnote 8 played a substantial role in shaping Americans’ perceptions of Muslims. Throughout the course of the 2016 presidential campaign, American attitudes toward Muslims abroad and domestic hardened to such a point that a YouGov poll conducted from March 24 to 25, 2016 found that 51% of respondents agreed that there should be “a total and complete shutdown of Muslims entering the United States until our country's representatives can figure out what is going on.” Over a third (35%) of respondents said they think Muslim Americans are more sympathetic to terrorists than to other Americans. Almost six in 10 (59%) said that Islam is more likely than other faiths to encourage violence among its believers.Footnote 9
More detailed investigations into mass attitudes toward Muslim Americans suggest that the negative affect toward this population is rooted in a generalized sense of ethnocentrism as well as relatively nuanced stereotypes. Kalkan, Layman, and Uslander (Reference Kalkan, Layman and Uslaner2009), for instance, suggest that the negative attitudes toward Muslim Americans are not only shaped by negative feelings toward racial and religious out-groups, but also toward cultural out-groups such as undocumented immigrants. Sides and Gross (Reference Sides and Gross2013), on the other hand, found that the attitudes toward the War on Terror depend on the attitudes toward Muslim Americans rather than a generalized sense of ethnocentrism and that stereotypes related to violence and untrustworthiness rather than laziness and unintelligence predicted unfavorable attitudes toward Muslim Americans. Research further suggests that the stereotypes focused on the threat of Sharia law and misconceptions about the mosque may play an even more important role in explaining anti-Muslim feelings than antipathy toward immigrants or other minority groups (Barreto, Dana and Oskooii Reference Barreto, Dana and Oskooii2013). This is despite the fact that various social scientists have found that religiosity and mosque attendance are associated with increased social and political incorporation (Jamal Reference Jamal2005; Bagby Reference Bagby2009; Howell and Jamal Reference Howell and Jamal2009; Dana, Barreto and Oskooii Reference Dana, Barreto and Oskooii2011; Dana, Wilcox-Archuleta and Barreto Reference Dana, Wilcox-Archuleta and Barreto2017; Oskooii and Dana Reference Oskooii and Dana2017), and not linked to the endorsement of radical views (Acevedo and Chaudhary Reference Acevedo and Chaudhary2015; Oskooii and Dana Reference Oskooii and Dana2017). Thus, while the Muslim American community is diverse and engaged in the American “mainstream” (Pew 2007, 2011), this line of research demonstrates that they are viewed as a homogenous group, as violent and untrustworthy, and a threat to the American way of life. More recently, Lajevardi and Oskooii (Reference Lajevardi and Oskooii2018) have argued that contemporary objections toward Muslim Americans are powerfully rooted in old-fashioned racist beliefs in one's racial superiority and other groups’ inherent inferiority.
Politically, Muslim Americans have been racialized through their perceived connection to terrorism, which policymakers are eager to preempt. Anti-terrorism policies often attempt to identify the acts of terror before they occur. In order to preempt terrorism, policymakers make various assumptions about who is likely to behave in certain ways and come up with the strategies to identify potential threats. Anytime administrators seek to identify nebulous threats not yet realized, they have to leverage visual, situational, and linguistic cues such as how a person looks, where she is from, and what language she speaks instead of assessing whether she has actually committed an act of wrongdoing. These identifiers often have nothing to do with an ascription to radical ideology, and they sweepingly cross national origin and cultural boundaries. As a result, institutional practices target Muslim Americans as a whole, politically reducing a diverse group to a homogenous “band of others” (Kalkan, Layman and Uslaner Reference Kalkan, Layman and Uslaner2009).
Institutional practices that target Muslim Americans, political rhetoric that unequivocally equates Islam with radicalization, unfavorable media coverage, and anti-Muslim rhetoric espoused by public figures entrench negative stereotypes in the American society through the process of racialization. Omi and Winant define this process as “The extension of racial meaning to a previously racially unclassified relationship, social practice, or group” (Omi and Winant Reference Omi and Winant2014, 64) where the “group” is coded as inherently dangerous, disloyal, or inferior (Selod Reference Selod2015; Lajevardi and Oskooii Reference Lajevardi and Oskooii2018). For Muslim Americans, their cultural and religious values have been portrayed as anti-American, perpetually foreign, misogynistic, and violent (Said Reference Said2003; Jamal Reference Jamal and Sinno2009; Barreto, Dana and Oskooii Reference Barreto, Dana and Oskooii2013; Sides and Gross Reference Sides and Gross2013; Selod Reference Selod2015).Footnote 10
The widespread purchase of negative stereotypes of Muslims can have profoundly negative consequences for how they experience life in the United States. While the extant literature has focused on mass attitudes toward Muslim Americans, information about discrimination from the perspective of this population is largely missing from the literature (but see, Selod Reference Selod2015 and Oskooii Reference Oskooii2016). We simply do not know whether Muslim Americans from different backgrounds have uniform or distinct experiences with discrimination.
The hijab, moreover, is a central component of the racialization of Muslim Americans and an object of cultural debate in the United States and abroad. Yet, we know very little about how the intersection of gender and religion uniquely shapes perceived discrimination. Given that a sizable portion of ordinary Americans and political elites do not contest negative attitudes toward Islam, these oversights grow increasingly conspicuous. To address these limitations, we turn to the gendered aspects of the racialization of Islam and consider its implications for perceived discrimination.
THE POLITICIZATION OF THE HIJAB
The hijab has historically been constructed by westerners as a backward, barbaric, and outdated relic signifying religious extremism and the oppression of Muslim women (Williams and Vashi Reference Williams and Vashi2007; AlWazni Reference AlWazni2015). The trope of the veiled Muslim woman as the object of oppression and violence is commonplace in the images disseminated by the media (Haddad Reference Haddad2007) and in the statements made by the political leaders (AlWazni Reference AlWazni2015), particularly after 9/11. Media images of Afghan women forced to wear the burqa under Taliban rule may have further promulgated the “otherization” and indeed the racialization of Muslim women both at home and abroad.
Women who wear the hijab are vulnerable to mistreatment because the headscarf is an easily recognizable signifier of Islam, coding those who wear it as distinctly “other.” Indeed, research finds that the religious groups with visibly different practices experience heightened levels of discrimination (Moore Reference Moore1987; Ghumman and Ryan Reference Ghumman and Ryan2013). This is particularly evident in Selod's (Reference Selod2015) qualitative study of Muslim Americans. Among the women she interviewed, most of whom were natural born U.S. citizens, experiences with discrimination were common. Wearing the hijab played a prominent role, associating women with foreign threat and an identity treated as mutually exclusive to American citizenship. Some participants highlighted the nuance between claiming a privileged “white” identity when they removed the hijab, as opposed to the foreign and “other” identity they experienced when wearing it. Others, like Miriam, provided more detailed accounts of their experiences: “One time I was at [a chain restaurant], and there was this woman who was reading a newspaper. She kept staring at me, and like reading her paper, and then giving me this evil eye. And so, I was just like, ‘Oh, can I help you?’ And she was like, ‘You and your people all ought to just go home. You're no good to this society.’ And I got real upset, and I was like, ‘Well, you know, you should really read some of your statistics, ‘cause I think an overwhelming majority of us have done more good for this society than anything else.’” (p. 10, Selod Reference Selod2015).
Clearly, images that cast Muslim women as outsiders appear to have had a profound impact on their routine, day-to-day experiences (AlWazni Reference AlWazni2015). Interestingly, these images, which likewise cast them as oppressed, sometimes invite more empathetic discriminatory interactions, but which are nevertheless biased and rooted in stereotypes. Nazia's account—also interviewed by Selod—neatly demonstrates this type of discrimination: “I used to wear a hijab, and there was this lady who came and asked me why I did this. She told me, ‘Why do you have to do this? You don't have to do this here in America.’ So I said, ‘You know what, I just started doing this after coming to America. I didn't do it before when I was in India. I did after coming to America because I learned more about Islam.’ She was probably thinking since Muslim women are seen as being oppressed, she probably thought that she would let me know that it's not the case here in America.” (p. 9, Selod, Reference Selod2015). Nazia's experience highlights that although not all the attention received from wearing the hijab is hostile in that some appear to have “good intentions,” the hijab nevertheless exposes women to increased scrutiny, often placing them in the position of defending their faith and the Muslim community more broadly. Asma, a lawyer, elected to stop wearing the hijab for this exact reason: “I was tired of being a political spokesperson for my faith…I felt that I should be able to put that away, and wearing a headscarf in public doesn't give you that luxury. I was tired of trying to prove that Muslim women in headscarves are also empowered, [by saying] ‘look at me, I'm working in a white-shoe law firm with a headscarf on.’” (Gjelten Reference Gjelten2016).
While these accounts suggest that wearing the hijab is central to understanding perceived discrimination among Muslim Americans, we should note that the relationship between gender and discrimination is more complicated than it appears. One perspective is that Muslim men may be subjected to greater discrimination than their female counterparts because men are more likely to be viewed as “radical outsiders” ready to engage in violence (Sides and Gross Reference Sides and Gross2013). There is a rich comparative literature on the construction of Muslim men as violence-prone (e.g., Hopkins, Reference Hopkins2004; Dwyer, Shah and Sanghera, Reference Dwyer, Shah and Sanghera2008; Ewing, Reference Ewing2008). Much of this research identifies dress choice, beard, and skin color as markers that identify young men in western Europe as Muslim, and therefore as a threat. From this strand of scholarship, one could deduce that men may actually experience more hostility than women. A second perspective on gender and discrimination, however, contends that women who wear the hijab are easily racialized as foreign and culturally threatening compared with their counterparts. The hijab is a highly relevant indicator of Muslim identity, perhaps more so than wearing a beard or other male cultural markers of Islamic affiliation. Thus, while the average woman may not perceive as much discrimination as the average man, veiled women may experience more discrimination than both men and non-hijabi women. Furthermore, it is possible that the headscarf plays an outsized role in social, every-day settings, but is less pronounced in institutional settings where national security is a focal concern—such as in airports (Oskooii Reference Oskooii2016). Given that men who appear “Middle Eastern” are stereotyped as threatening and violent, hijabi women may face less scrutiny from government agents even if they are easily identified as distinctly Muslim. Therefore, while it is reasonable to assume that wearing the hijab is likely to heighten the perceptions of discrimination, the extent to which experiences with discrimination are gendered likely varies by the context in which individuals find themselves in.
ADDITIONAL ANTECEDENTS OF PERCEIVED DISCRIMINATION
A convincing examination of the relationship between gender, hijab, and differential treatment requires identifying other important predictors of perceived discrimination. External markers of identifying as Muslim or originating from a Muslim-majority country aside from dress are likely important, even if less politicized than the headscarf. In order to develop a more nuanced theory around the antecedents of perceived discrimination among Muslim Americans, we turn to research on other racialized groups. In particular, we pay close attention to the literature on marginalized groups with large immigrant subpopulations, since many Muslim American families are immigrants themselves and are constructed as “outsiders” regardless of nativity. This body of work suggests that group identity, participation in ethnic and cultural organizations, nativity, and racial and ethnic background may play a prominent role in whether individuals perceive any discrimination.
Chief among these factors is group identity. Social psychologists have shown that individuals who identify strongly with a stigmatized minority group are aware of their devalued status in various contexts, and are likely to attribute negative and even ambiguous encounters with high-status group members (e.g., Whites) as discriminatory (Crocker and Major Reference Crocker and Major1989; Shelton and Sellers Reference Shelton and Sellers2000; Operario and Fiske Reference Operario and Fiske2001; Major, Quinton and McCoy Reference Major, Quinton and McCoy2002; Mendoza-Denton et al. Reference Mendoza-Denton, Downey, Purdie, Davis and Pietrzak2002). Drawing from this literature, it can be reasoned that strongly identifying as Muslim makes one more attuned to discriminatory behavior, especially in the current climate of Islamophobia. Relatedly, participation in ethnic, cultural, or religious institutions may not only strengthen one's group identity but also heighten the perceptions of mistreatment because such organizations provide regular meeting spaces for individuals to interact and discuss events and issues salient to the group (Verba et al. Reference Verba, Schlozman, Brady and Brady1995; Calhoun-Brown Reference Calhoun-Brown1996; Brown and Brown Reference Brown and Brown2003; Mc-Clerking and McDaniel Reference Mc-Clerking and McDaniel2005; Putnam and Campbell Reference Putnam and Campbell2010). Given that the mosques and Islamic centers have faced tremendous backlash in the past several years, regular attendance in such organizations can increase the members’ sensitivities to the issues of stigmatization.
Proficiency with the English language and nativity may also shape how Muslim Americans experience discrimination. While previous research finds that Americans perceive accented speakers as less attractive (Cargile Reference Cargile1997) and more foreign (Goto, Gee and Takeuchi Reference Goto, Gee and Takeuchi2002; Lavariega Monforti and Sanchez Reference Lavariega Monforti and Sanchez2010), highly skilled English speakers may be more familiar with American customs and be attuned to nuanced forms of discrimination. In this sense, language proficiency may actually increase the perceptions of discrimination. Nativity may similarly heighten the perceptions of discrimination since U.S.-born Muslims are likely well-versed in American norm-violations. Having been raised in the United States with the expectation that their citizenship translates into de facto assimilation into the American society, U.S.-born Muslims may react negatively to perceived race-based slights out of a sense of entitlement to equal and fair treatment. Foreign-born Muslims, however, may not recognize disparate treatment as discriminatory and may lack a sense of entitlement to fair treatment that accompanies citizenship.
Given the diversity within the Muslim American community, individuals from different racial backgrounds are likely to have heterogeneous experiences with discrimination. This is particularly the case in the United States, where race impacts most facets of American democracy. On the one hand, Middle Eastern (e.g., Arab, Iranian, Afghani) or even South Asian (e.g., Pakistani) individuals may experience heightened discrimination compared to their Black/African-American counterparts since that region of the world has been, for a long time, explicitly linked to the negative images of Islam (Said Reference Said1980, Reference Said1979). On the other hand, because Middle Easterners often appear phenotypically “White” and are recommended to identify as such on the U.S. Census, and many indeed do, their South Asian and Black Muslim American counterparts may be subjected to more discrimination.Footnote 11 It is therefore not entirely clear how race and ethnicity may function in this context, given that religious affiliation is the primary conduit of racialization among Muslims. Certainly, Muslim Americans who are phenotypically darker contend with multiple constructions of race; those associated with their religious and cultural identity and those associated with their skin color. This complexity makes predictions difficult, necessitating more detailed investigation into how racial and ethnic differences may uniquely shape the perceptions of discrimination among diverse religious communities.
In sum, Muslim Americans have historically been racialized as foreign, violent, and as a threat to national security and to the American way of life. The process of racialization has occurred along the vector of religion, aided by 9/11, other terrorist attacks in the United States and Europe, and the reaction of political elites and the news media to these attacks. This racialization is also distinctly gendered, since wearing the hijab makes women's Muslim identity highly visible, and the hijab has been crudely reduced to signify women's oppression within Islam. Yet, little systematic evidence exists about the experiences of Muslim Americans with discrimination, and even less is known about the intersection of religion and gender in shaping these experiences.
DATA AND MEASURES
To evaluate the correlates of perceived discrimination, we rely on the 2007 and 2011 Pew Surveys of Muslim Americans.Footnote 12 Both surveys were conducted with live-callers in English, Arabic, Urdu, or Farsi and focused on a variety of questions related to the sociopolitical and religious beliefs, practices, and experiences of Muslims in the United States.Footnote 13 We selected the Pew datasets for two reasons. First, the surveys contain a specific question about our key variables of interest, the hijab experiences with discrimination across a variety of contexts, both societal and institutional. Without detailed questions about the hijab and discrimination in different domains, we would not have been able to assess our key research questions. Second, nearly all of the questions used to construct the key explanatory and control variables across the 2007 and 2011 datasets are identical. As such, we are able to replicate the 2007 analysis with the 2011 data in order to assess whether the antecedents of perceived discrimination are robust across two datasets of Muslims with nearly identical survey questions and methodologies.
While the Pew datasets offer two key advantages, we should make note of one important shortcoming. Since only three non-English languages were offered to the participants, it is possible that some Muslim Americans were unable to partake in the study or fully understand the survey questions. Therefore, individuals proficient in languages such as Turkish, Swahili, Bengali, or Spanish may have had a lower probability of completing or participating in the survey and may be under-represented.
OUTCOME VARIABLES
We selected three questions out of a battery of five items related to discrimination as outcome variables. For each item, respondents were asked to report whether they have encountered the particular situation in the past 12 months because they are Muslim.Footnote 14 Two of the three questions are related to the experiences with day-to-day, societal discrimination: (1) Have people acted as if they are suspicious of you? and (2) Have you been called offensive names? The third question is more specifically about the experiences with institutional discrimination; respondents were asked if they have been “singled out by airport security” [because they are Muslim].
Figure 1 reports descriptive statistics for each outcome variable across the two datasets using the original survey sample weights. Possible response options were either “Yes” or “No.” Receiving suspicious looks was the most common type of negative experience reported followed by verbal abuse and being singled out by airport security. A little over a quarter of all the respondents across each dataset stated that people acted as if they are suspicious of them because of their religious identity. A glance at the percentages across the samples shows a slight uptick in the reported discrimination in 2011. While almost all of the differences fall within the survey's margin of error of ±5%, reported verbal abuse is noticeably higher in 2011 compared with 2007—a difference of seven percentage points. While we cannot make any definitive claims about what may have contributed to this difference or whether this difference is a function of survey sampling effects, there is some evidence to suggest that the climate of Islamophobia in the United States may have worsened between 2010 and 2011. A series of anti-sharia legislation were introduced before the midterm elections in 2010, and anti-mosque movements started to take form across several states and localities during that time period (Dana, Barreto and Oskooii Reference Dana, Barreto and Oskooii2011; Wajahat et al. Reference Wajahat, Clifton, Duss, Fang, Keyes and Shakir2011). It is therefore possible that such a climate may have contributed to a larger portion of Muslim Americans reporting unpleasant encounters in the form of verbal harassment.
The 2007 and 2011 Pew discrimination measures

Before moving to a discussion of the explanatory variables of interest, a note on the discrimination measures is necessary. Even though we are measuring self-reported, direct experiences of individual-level discrimination, rather than mere perceptions of discrimination toward one's group, various scholars across disciplines note that the experiences with discrimination involve subjective evaluations that may or may not reflect objective levels of discrimination present in a given context (Major, Quinton and McCoy Reference Major, Quinton and McCoy2002; Kaiser and Major Reference Kaiser and Major2006). For instance, individuals with a heightened sense of minority status may identify ambiguous encounters with higher status persons (e.g., whites) as discriminatory whereas those with a weaker minority identity may not (Operario and Fiske Reference Operario and Fiske2001; Major, Quinton and McCoy Reference Major, Quinton and McCoy2002; Mendoza-Denton et al. Reference Mendoza-Denton, Downey, Purdie, Davis and Pietrzak2002). However, scholars find that whether discrimination actually exists is much less important for attitudinal, behavioral, and mental health outcomes than whether individuals feel marginalized due to various structural, personal, and/or situational factors (Barreto and Woods Reference Barreto, Woods, Gary M. and Bowler2005; Rippy and Newman Reference Rippy and Newman2006; Barreto and Bozonelos Reference Barreto and Bozonelos2009; Walker Reference Walker2014; Oskooii Reference Oskooii2016). It is therefore important across a variety of disciplines to identify the conditions leading to heightened perceptions of discrimination.
EXPLANATORY VARIABLES
Having described the specific questions that were selected to construct the three separate binary outcome variables, we now turn to the key explanatory variable of interest to this study: the hijab. All the female participants in both surveys were asked the following question: “When you are out in public, how often do you wear the headcover or hijab (hee-jab)? Do you wear it all the time, most of the time, only some of the time, or never?” Figure 2 illustrates that a significant proportion of women either never wear the hijab or wear it all the time, with a much lower percentage of respondents falling somewhere in the middle. Looking at the 2007 survey results, almost half (49%) of the female respondents stated that they never wear the hijab in public, while 38% stated that they do so all the time. The 2011 results show a similar trend, albeit a smaller proportion of women selected “never” wearing the hijab and a larger proportion reported that they “sometimes” wear the hijab. Comparing those who wear the hijab “all the time” across the two datasets reveals no statistical or substantive variation—only a 2% difference. Overall, the observed variation in the independent variable allows us to evaluate the role that the hijab plays in the perceptions of discrimination among Muslim Americans.
Frequency of wearing the hijab in public

To investigate other potential antecedents of perceived discrimination and to effectively isolate the relationship between wearing the hijab and reporting discrimination, all of the fully specified multivariate regression models include variables identified in the previous section as important for perceiving discrimination: identity, mosque attendance, nativity, english language proficiency, and racial and ethnic background. We also control for a number of theoretically relevant demographic and socioeconomic variables such as education, income, and political awareness.Footnote 15
The identity question asks: “Do you think of yourself first as an American or first as a Muslim?” This variable ranges from zero to two with the highest value representing Muslim “first” and the lowest value indicating American identity—respondents who selected “equally both” were assigned value one. In the 2007 dataset, nearly half of the respondents identified first as Muslim, with about a quarter stating both equally and a little over a quarter stating American first. The 2011 statistics are very similar with a slightly higher percentage of respondents selecting Muslim first. As outlined above, identity is potentially an important predictor of perceiving discrimination. But, identity is also an important control if the objective is to rigorously assess the independent relationship between wearing the hijab and discrimination. This is because women who wear the headscarf may not only perceive more discrimination than their counterparts—as a function of being a highly visible “out-group” to non-Muslims—but also more likely to identify first as a Muslim than an American or “equally both.” A simple bivariate relationship between identity and wearing the hijab in the 2007 data reveals important differences. Roughly 74% of women who wear the hijab all the time indicated that they identify first as a Muslim, while only 33% of women who do not wear the hijab at all gave the same answer.Footnote 16
Another important explanatory variable is mosque attendance. This indicator was measured with the following question: “On average, how often do you attend the mosque or Islamic center for salah and Jum'ah prayer?” Mosque attendance ranges from zero to five, with the highest value indicating “more than once a week” and the lowest value indicating no attendance whatsoever (2007 μ = 2.51; 2011 μ = 2.95). Again, we would expect hijabi women to not only report more discrimination but to also attend the mosque more regularly than their counterparts because such women may, on average, be more religiously devout. While we cannot be certain, we believe this is a plausible assertion. Almost half of the women (48%) who wear the hijab all the time indicated attending mosque at least once a week (2007 data). In comparison, only 14% of non-hijabi women reported the same level of mosque attendance.Footnote 17 Certainly, some women may attend the mosque for social rather than religious purposes such as the desire to take part in the community activities. Some women may also choose to wear the hijab as an act of defiance or a form of solidarity in an increasingly intolerant sociopolitical environment. However, on average, we suggest that the act of wearing the hijab is strongly related to religiosity. Therefore, controlling for mosque attendance is paramount.
Dummy variables were constructed for the respondents’ racial and ethnic backgrounds (reference = Arab), gender (female = 1), English language proficiency, citizenship status (citizen = 1), and nativity (U.S.-born = 1). English language proficiency was operationalized by assigning the value one to the respondents who chose to take the survey in English, where zero indicates those who chose Arabic, Urdu, or Farsi. While this measure is imperfect, it captures some level of mastery with English as those who are presumably comfortable with English would opt to take the survey in its original language. In addition, we include control variables for household income and education categories (reference = low income/education), and the respondents’ region of residence (reference = south) to examine whether regional variations predict the perceptions of discrimination.Footnote 18 For instance, it is possible that Muslims who live in the Northeast or in the West may report less discrimination than those who live in less diverse regions with a more pronounced history of de jure and de facto discrimination against cultural, religious, and racial out-groups (but see, Hopkins et al. Reference Hopkins, Mummolo, Esses, Kaiser, Marrow and McDermott2016).
Finally, we include a measure of political awareness in all of the regression models because individuals who pay more attention to the news may be more cognizant of issues related to the general mistreatment of Muslims, particularly by the transportation security administration (TSA), and thus, may perceive even random security checks as “being singled-out by airport security.” It is important to note the political awareness is the only variable in our models not identical across the two datasets. In 2007, respondents were asked whether they subscribe to a daily newspaper, with a binary response option of “Yes” or “No.” In the 2011 survey, however, respondents were instead asked how closely they “follow what is going on in government and public affairs,” with a five-point response option that ranged from “hardly at all” to “most of the time.” While this question is both qualitatively different from the first one and more detailed as it pertains to attention to politics, we did not find that the difference in question-wording across the datasets impacted the relationship of the other independent variables with any of the outcome variables. As such, we deem a comparison of results between the 2007 and 2011 models appropriate.Footnote 19
ANALYSIS AND RESULTS
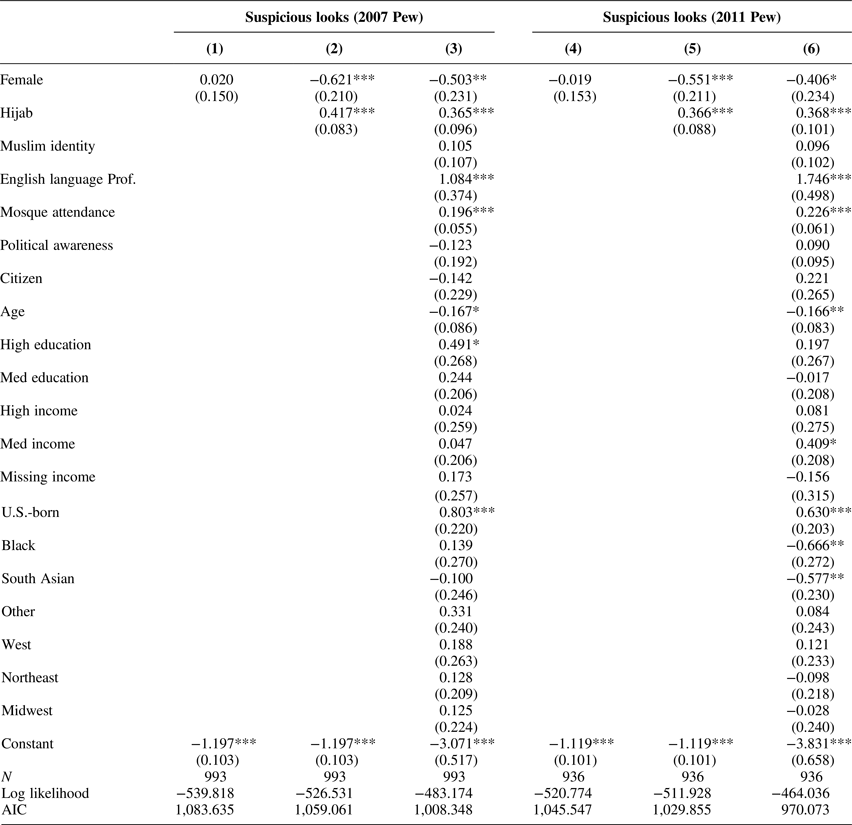
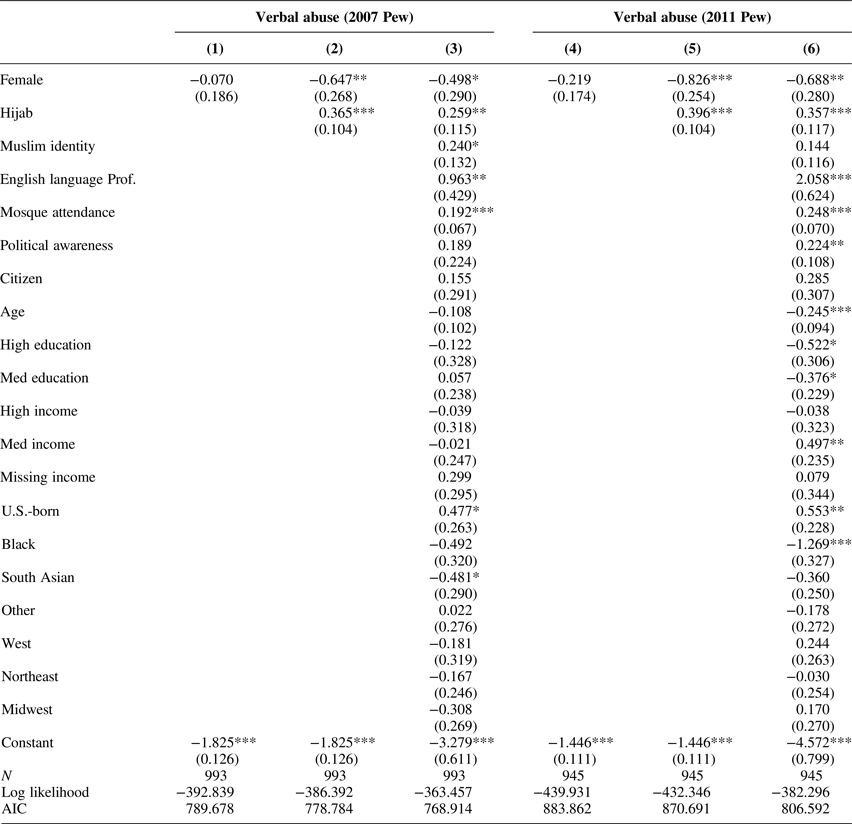
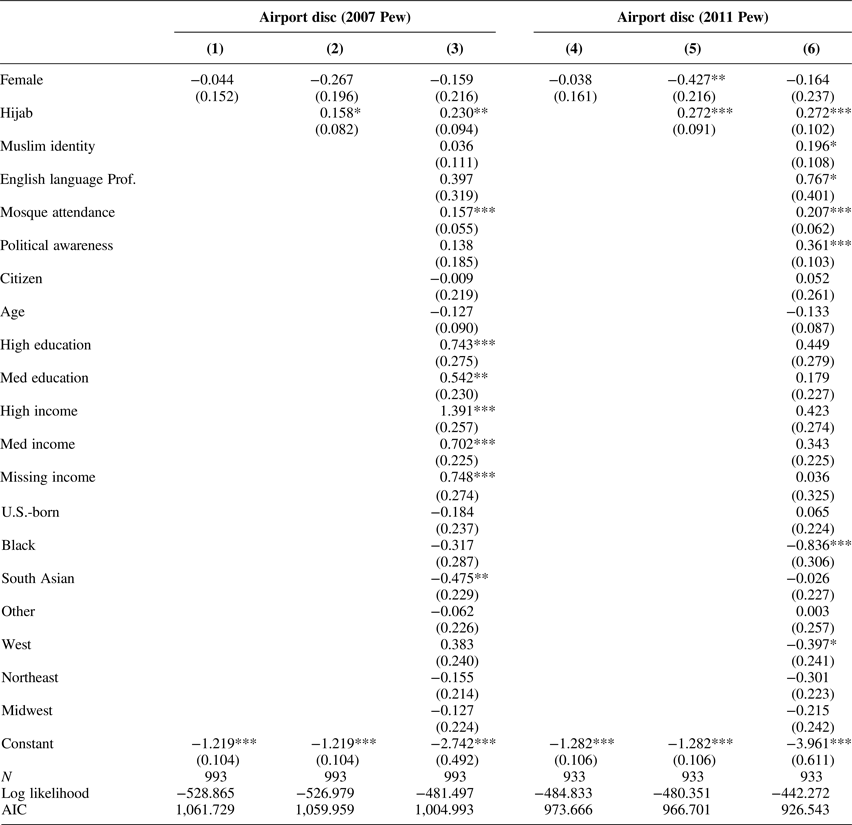
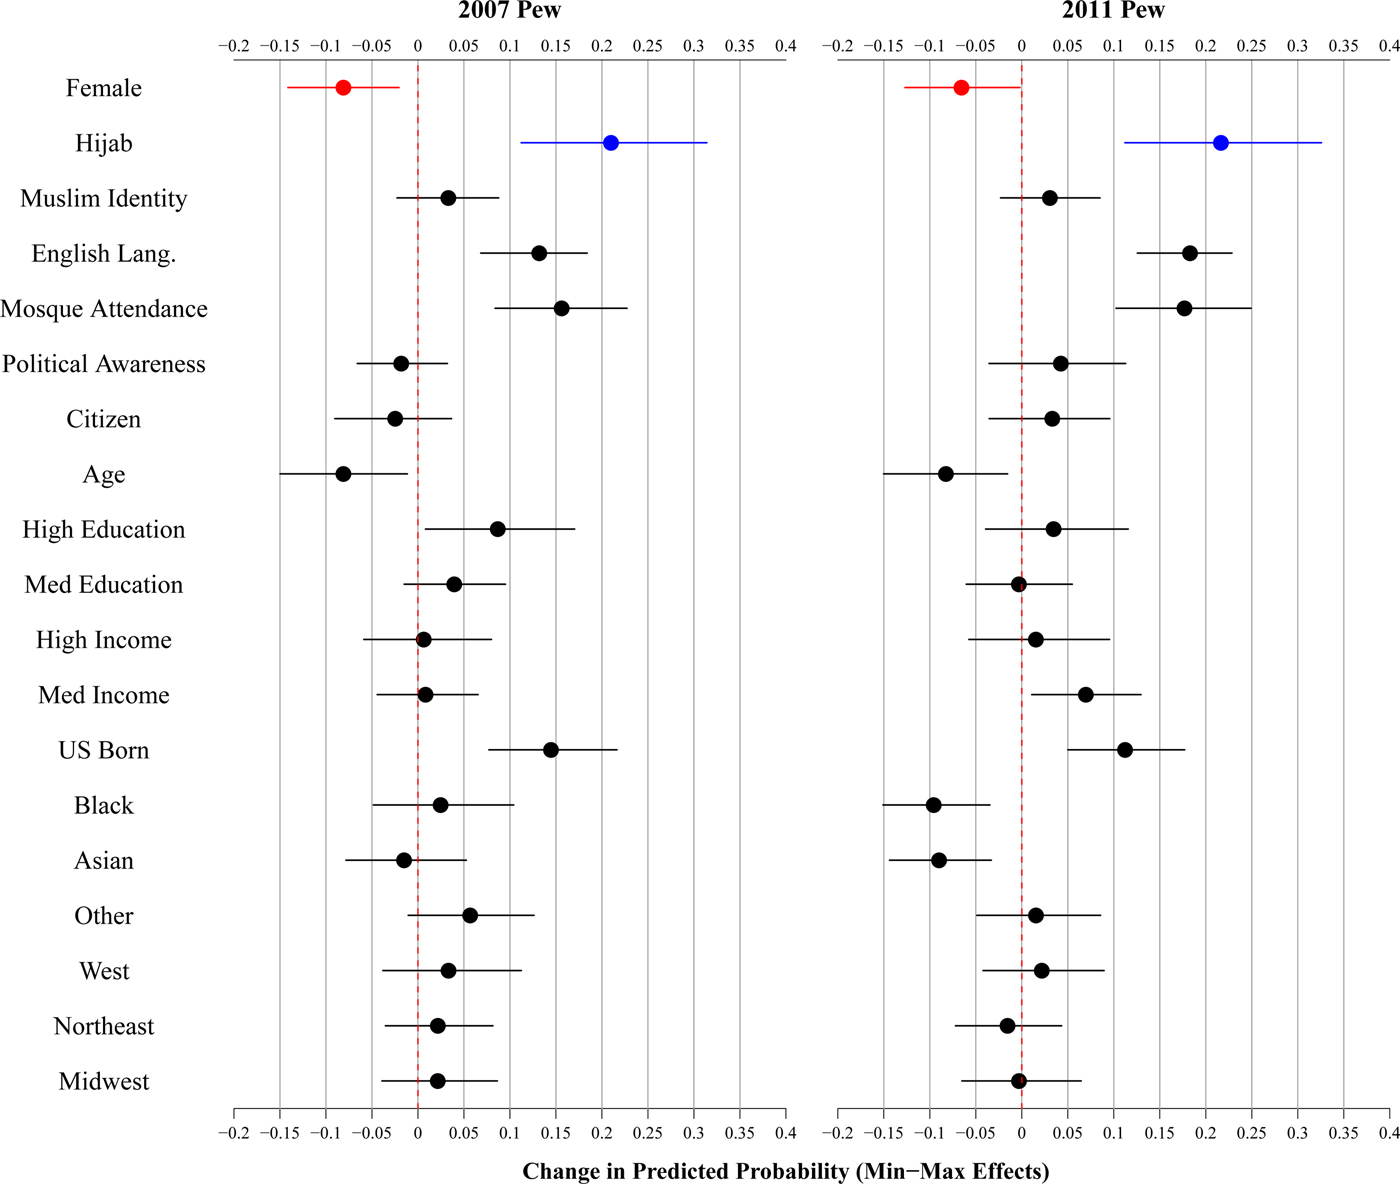
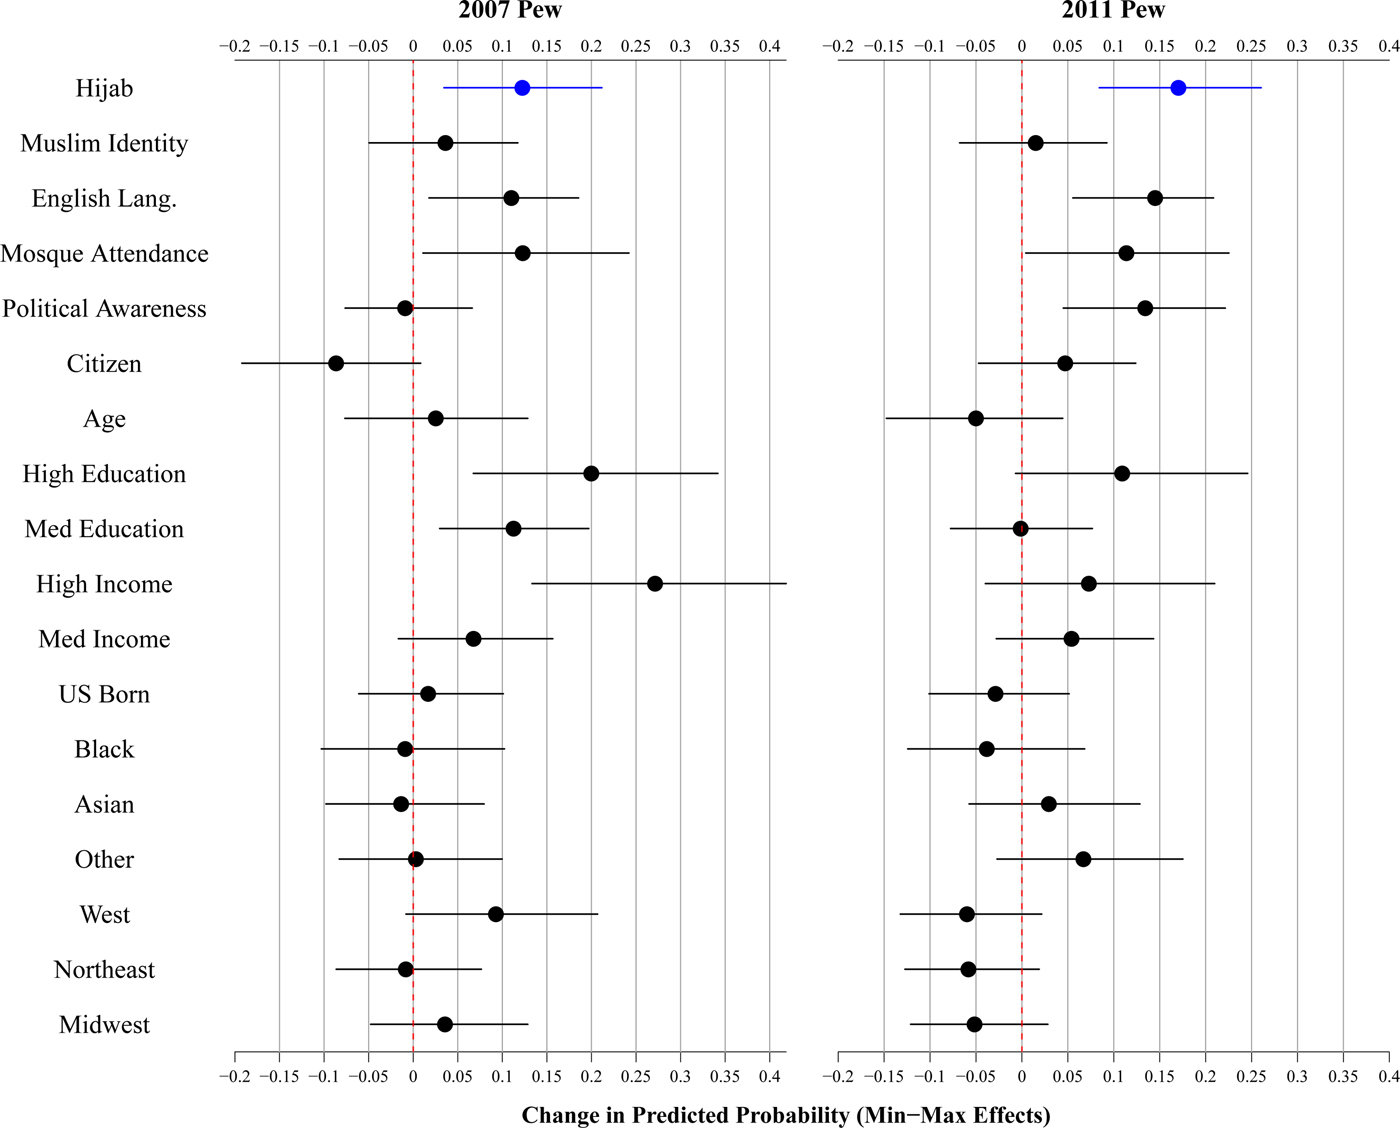
To examine the antecedents of discrimination, notably the impact of hijab and gender, we first estimated three logistic regression models per outcome variable and dataset (see Tables 1–3). We regressed each discrimination measure on gender among the entire sample, then added hijab to the models before including all the other explanatory and control variables. To aid in the interpretation of the results, we calculated and plotted changes in the predicted probability of perceiving discrimination by domain for all the covariates in the models. The predicted probability plots visually depict the direction, statistical significance, and substantive impact of each independent variable on the dependent variables of interest.Footnote 20
Predictors of reporting suspicious looks

AIC, Akaike Information Criterion
*p < 0.1; **p < 0.05; ***p < .01.
Predictors of reporting verbal abuse

AIC, Akaike Information Criterion
*p < 0.1; **p < 0.05; ***p < 0.01.
Predictors of reporting airport discrimination

AIC, Akaike Information Criterion
*p < 0.1; **p < 0.05; ***p < 0.01.
We first start by exploring the bivariate relationship between gender and discrimination. Across all of the bivariate models, we find that gender is not associated with perceived discrimination. That is, women are no more likely than men to report suspicious looks, verbal abuse or airport discrimination—a finding that is robust across the two datasets. However, once we account for wearing the hijab, we find disparities along gender in the models measuring discrimination in societal contexts. First, we find that hijab increases the probability of perceiving suspicious looks and reporting verbal abuse. Second, we find that men display a greater likelihood of perceiving discrimination than women once we introduce the hijab variable. This relationship holds even after accounting for all the other variables that could potentially impact the direct relationship between hijab, gender, and discrimination.
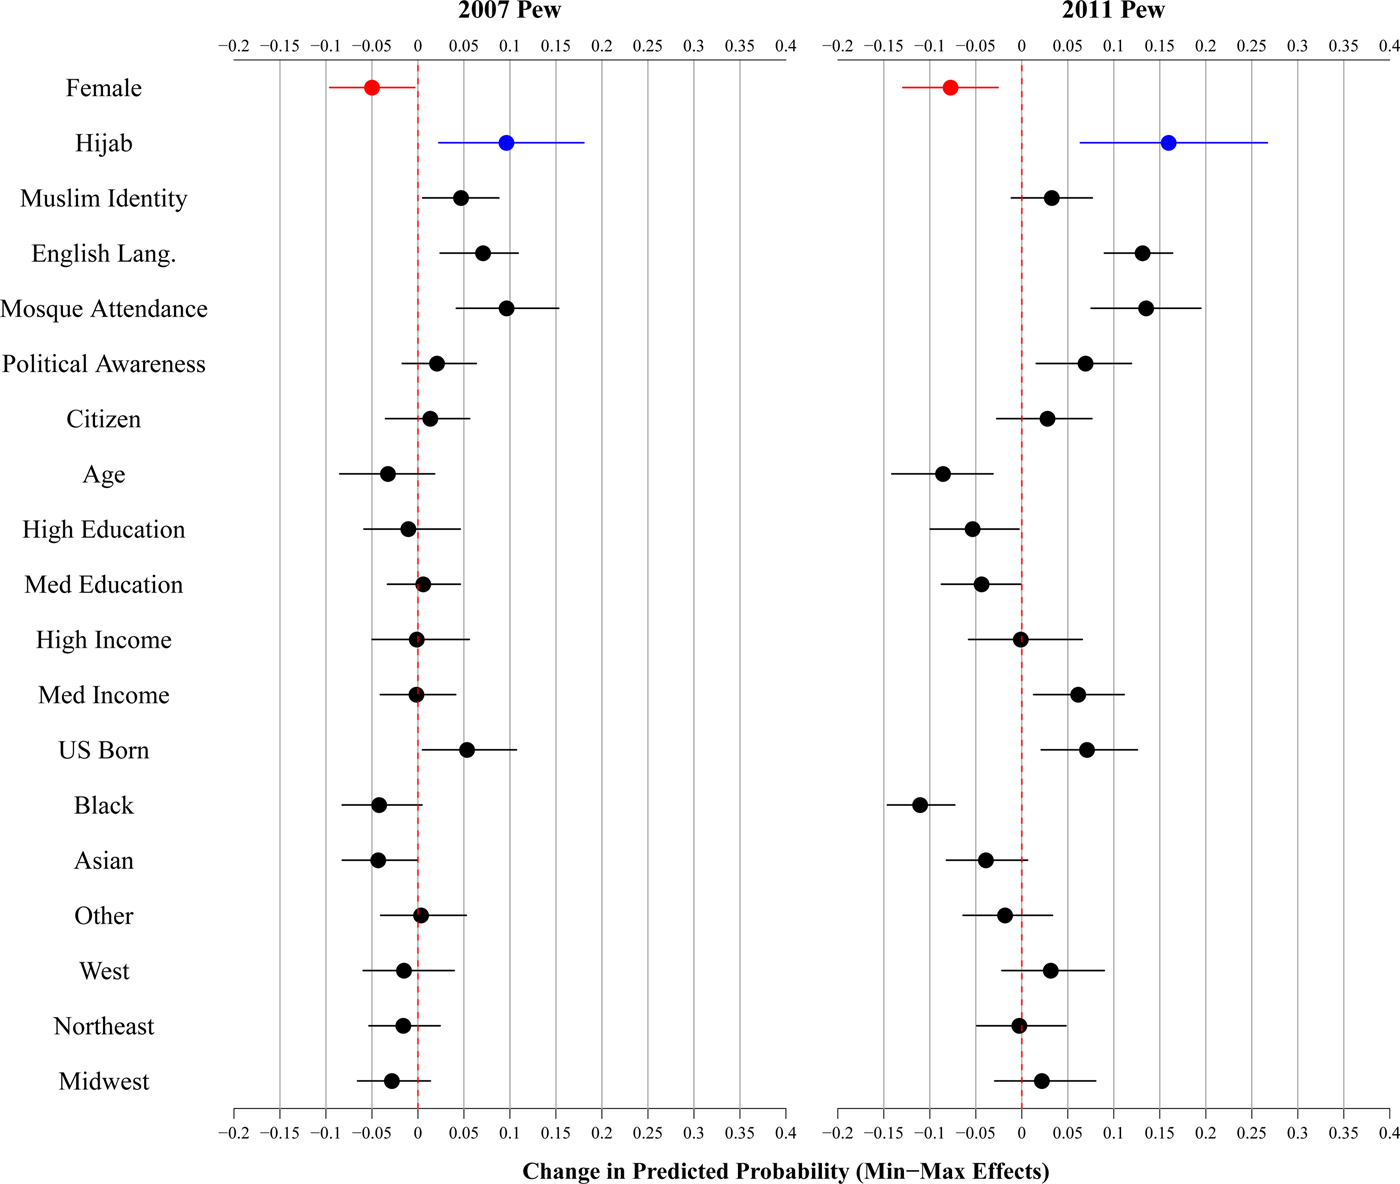
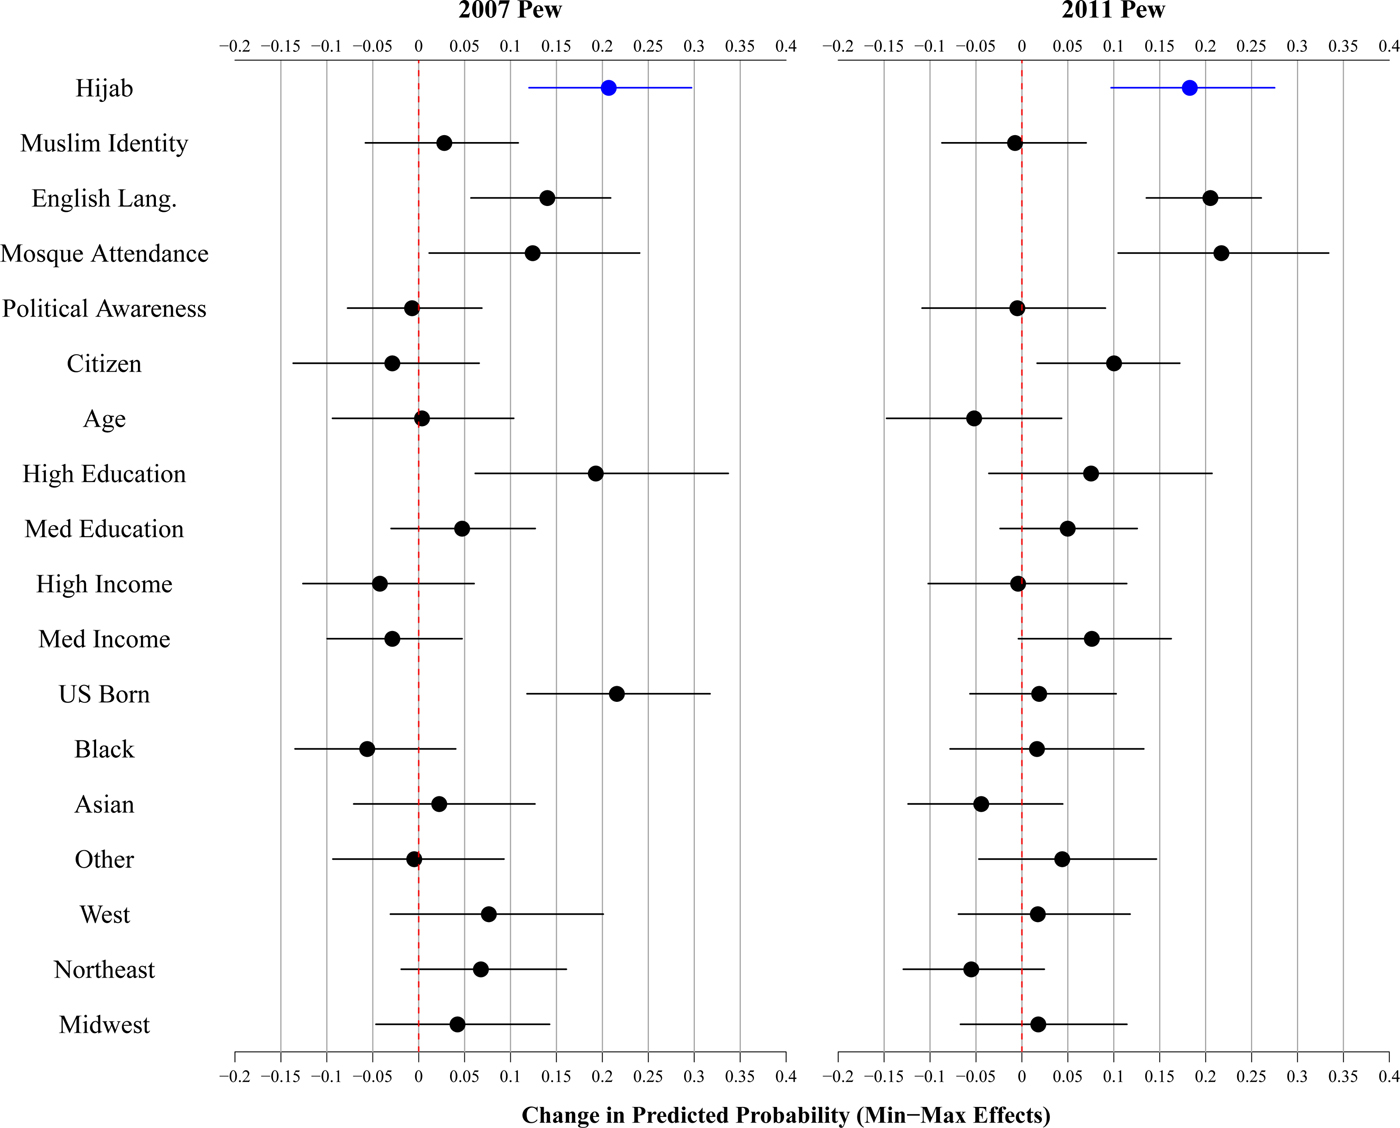
Figure 3 further unpacks this relationship. As the changes in the predicted probability of reporting suspicious looks demonstrate, women are about eight percentage points less likely than men to report discrimination in the 2007 sample, and about seven percentage points less likely in the 2011 survey. However, hijab not only has an independent impact, but one that is substantively larger. In both the 2007 and 2011 samples, wearing the hijab increases the probability of reporting suspicious looks by about 21 percentage points. Comparing this effect size to the other model covariates, it appears that wearing the hijab has the strongest impact on the dependent variable. English language proficiency, mosque attendance, and nativity are also important and fairly strong predictors of reporting suspicious looks, but their effect sizes are not as large. We also find that age plays a role, with older individuals being less likely than younger ones to perceive suspicious looks. With the exception of these aforementioned variables, no other variable is statistically significant across both datasets. For instance, Black and South Asian respondents reported less discrimination than their Arab counterparts in 2011, but not in 2007. Perhaps most notably, although the impact of identity is in the positive direction, the relationship does not achieve statistical significance.
Predictors of suspicious looks (full sample)

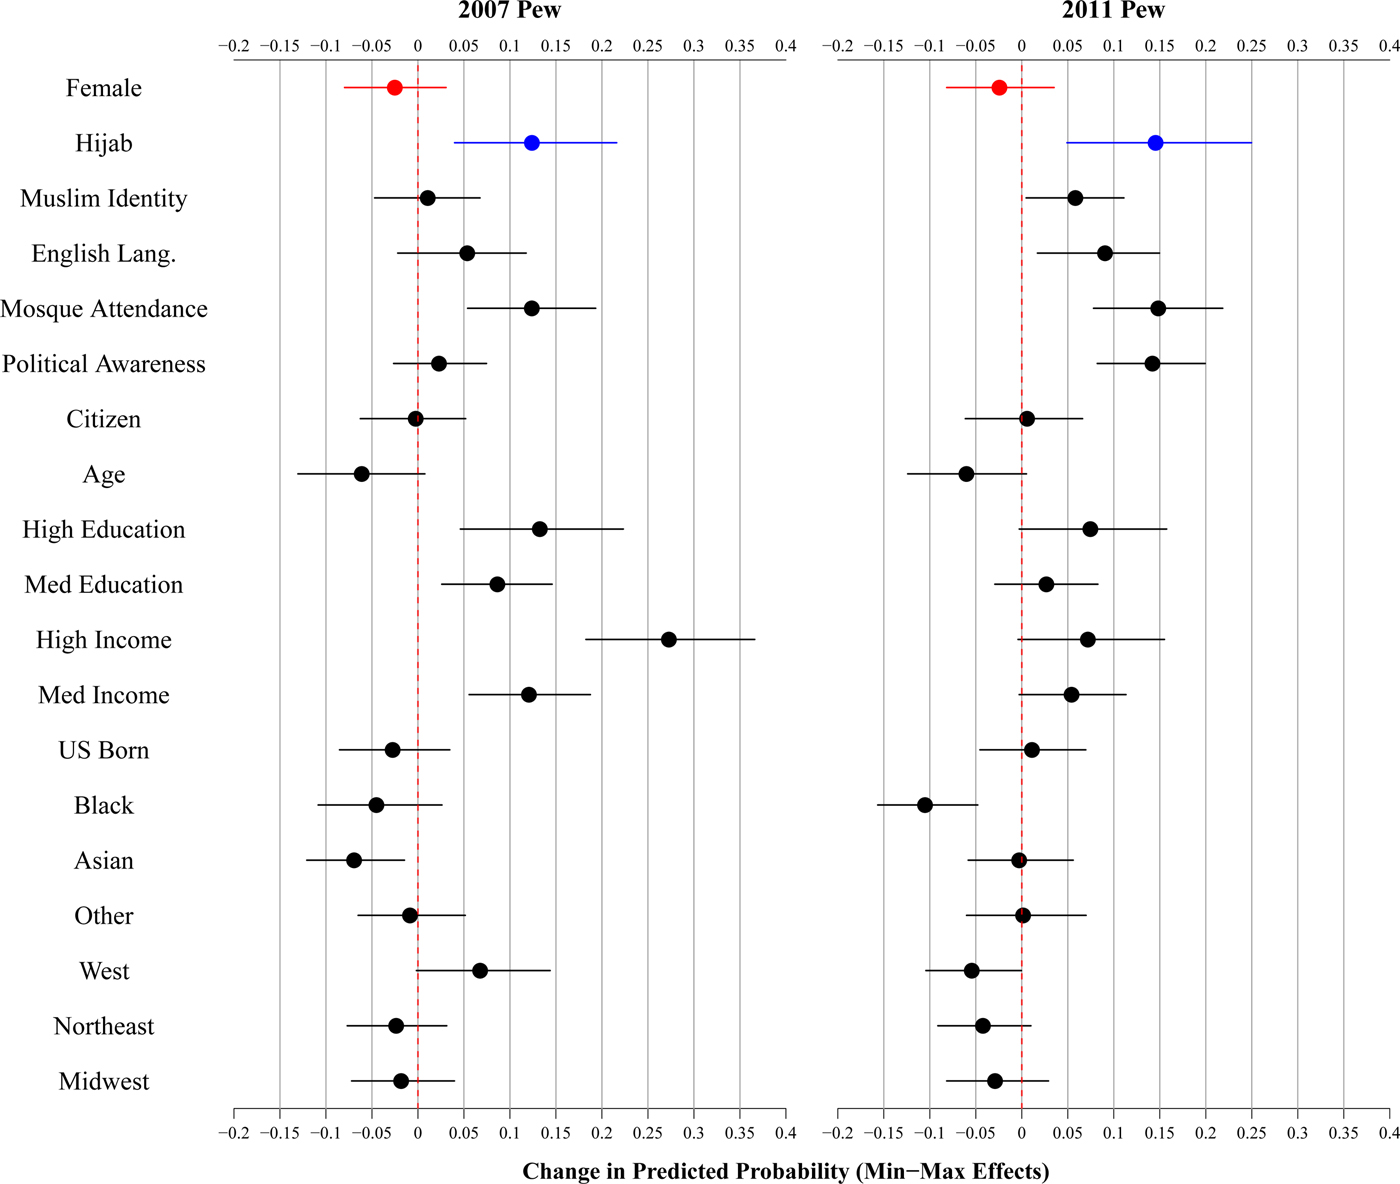
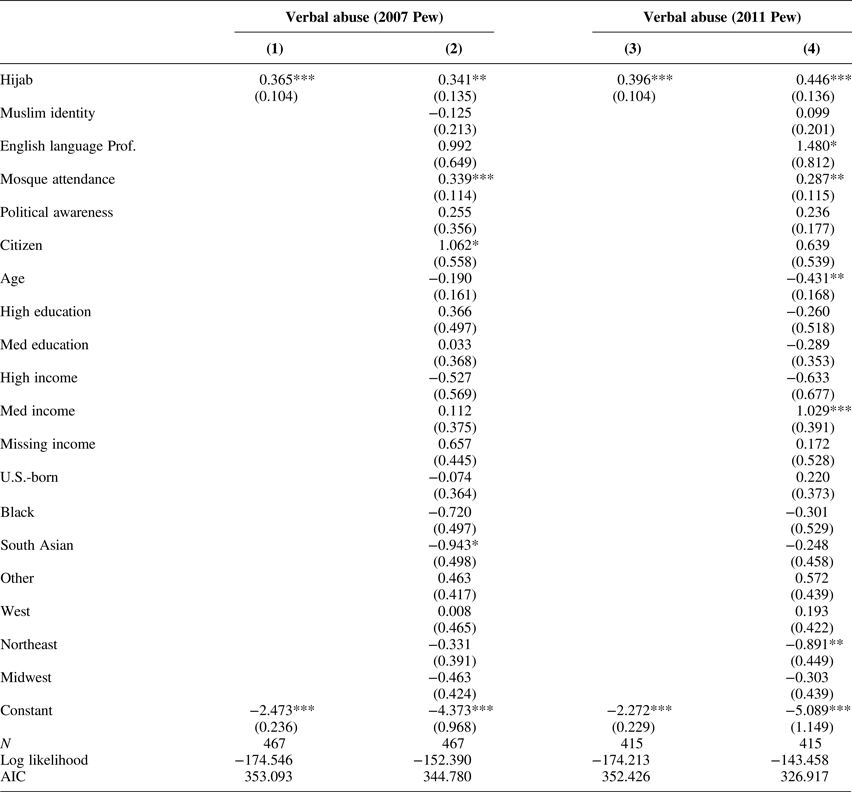
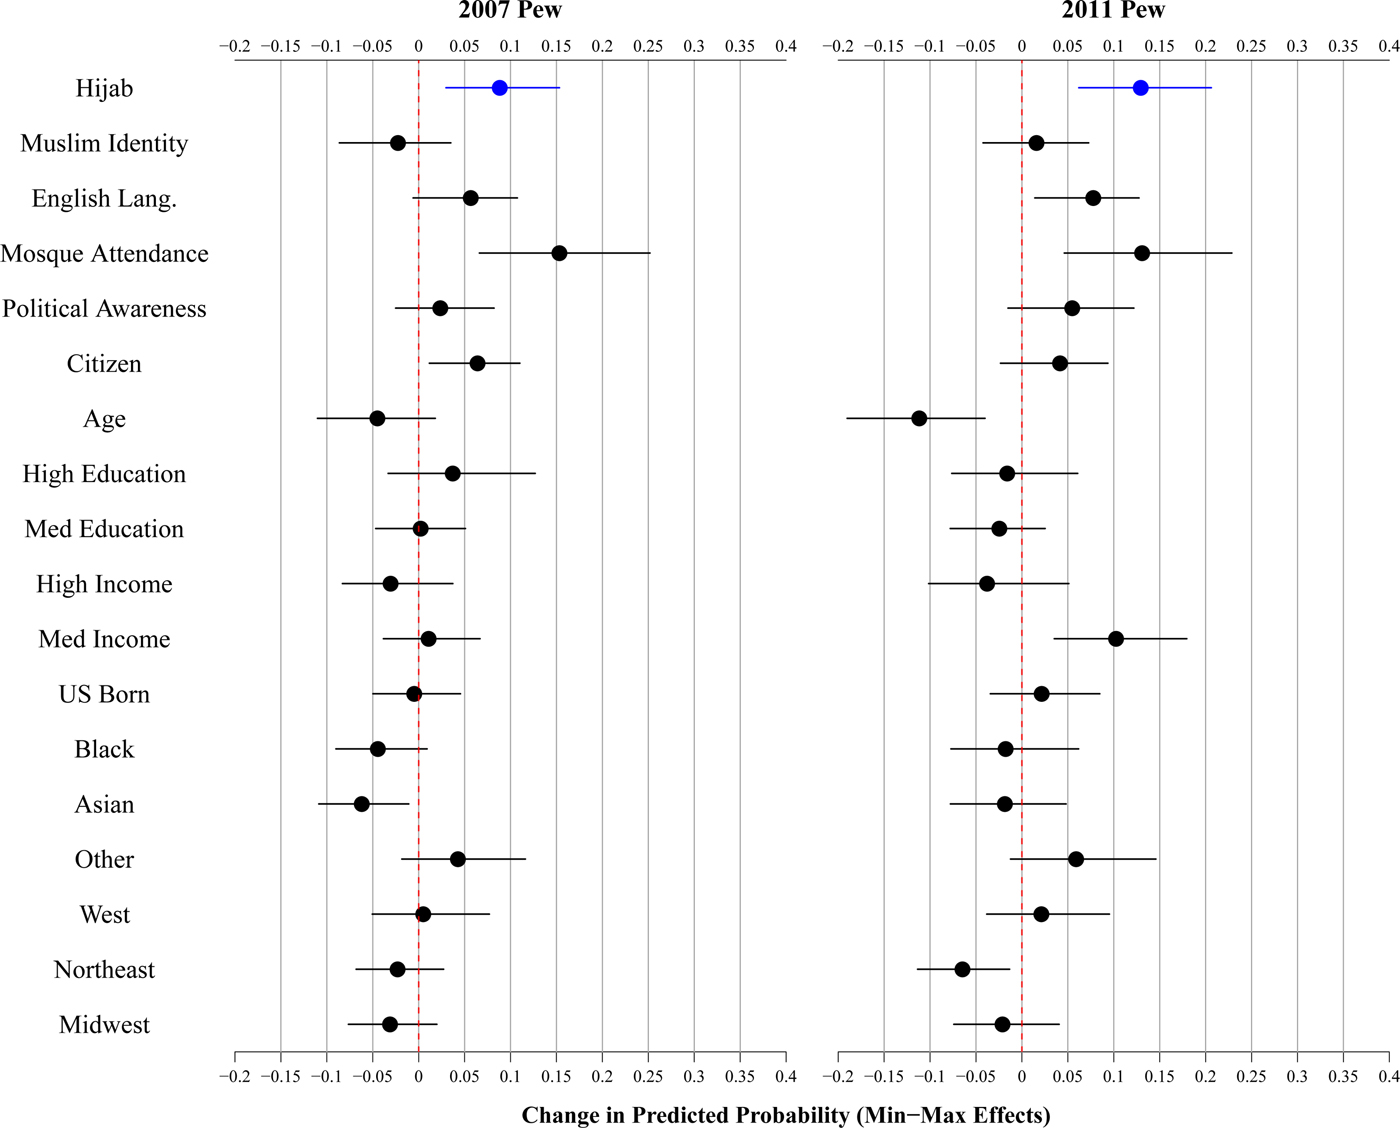
We find nearly identical patterns among the models of our second indicator of societal discrimination, reports of verbal abuse. As Figure 4 illustrates, wearing the hijab emerges as the strongest predictor of perceived discrimination. While verbal abuse is less commonly reported than suspicious looks, the results show that hijabi women are about 10 percentage points more likely than their non-hijabi female counterparts to report discrimination in the 2007 survey, and 15 percentage points more likely in the 2011 sample. This finding holds even with the inclusion of gender in the model. In fact, gender only becomes statistically associated with the dependent variable once hijab is held constant. This means that by excluding hijab from the analysis, researchers would incorrectly conclude that gender is not a relevant predictor of perceived discrimination among Muslim Americans.
Predictors of verbal abuse (full sample)

As expected, other key factors such as mosque attendance, nativity, and language proficiency are also associated with the dependent variable. The impact of identity, however, is mixed. In the 2007 model, a primarily Muslim identity increases the probability of reporting verbal abuse by five percentage points. However, in the 2011 model, identity is not statistically predictive of self-reported verbal abuse, and the impact size is relatively small: three percentage points. We also find fairly mixed results with respect to the other variables that prior work indicated as potentially important predictors of perceived discrimination. The effects of age are marginal, where older respondents are less likely to report verbal harassment than younger individuals, but this effect is only statistically significant in 2011. Political awareness is not linked to perceiving verbal abuse in 2007, but it is in 2011.Footnote 21 The results by race and ethnicity are also inconsistent. While Black respondents are substantially less likely than Arab respondents to report discrimination in 2011, the same pattern is not clearly found in 2007—this variable is not statistically significant at p < 0.10, although it is in the negative direction. Finally, consistent with the research by Hopkins et al. (Reference Hopkins, Mummolo, Esses, Kaiser, Marrow and McDermott2016), we also did not find any geographical patterns in self-reported discrimination. However, we note that the measures of region—South, Northeast, Midwest, and West—in both datasets are fairly broad as states are much larger and heterogenous than smaller geographic units.
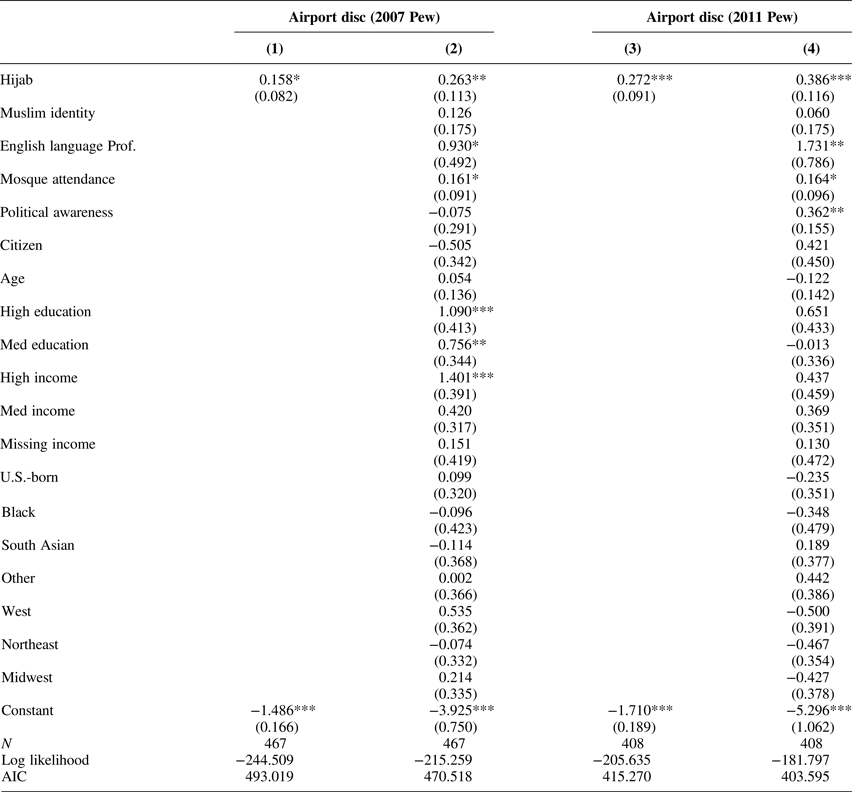
So far the results suggest that gender, hijab, mosque attendance, nativity, and English language proficiency are all independently associated with reporting societal discrimination across both datasets, with the substantive effect size of hijab being particularly noticeable. The last set of models for the entire sample assesses the probability of perceiving discrimination in an institutional setting, at the hands of the TSA. Recall that we presented a set of competing explanations regarding the effect of gender and hijab as it pertains to issues related to national security. We argued that hijabi women could be targeted for extra security checks due to the fact that they are easily identifiable as Muslim. However, we also noted that in places like airports, TSA agents may particularly pay attention to Muslim men rather than women, even hijabi women, because concerns over terrorism may be particularly aimed at the former subgroup. It is also possible that TSA security practices are gender neutral and more focused on other characteristics such as race, ethnicity, national origin, and presumed religious identity. Regardless of how the TSA actually targets various individuals for extra screening, the fact remains that some subgroups of Muslims may be more prone to identify even truly random checks as discriminatory.
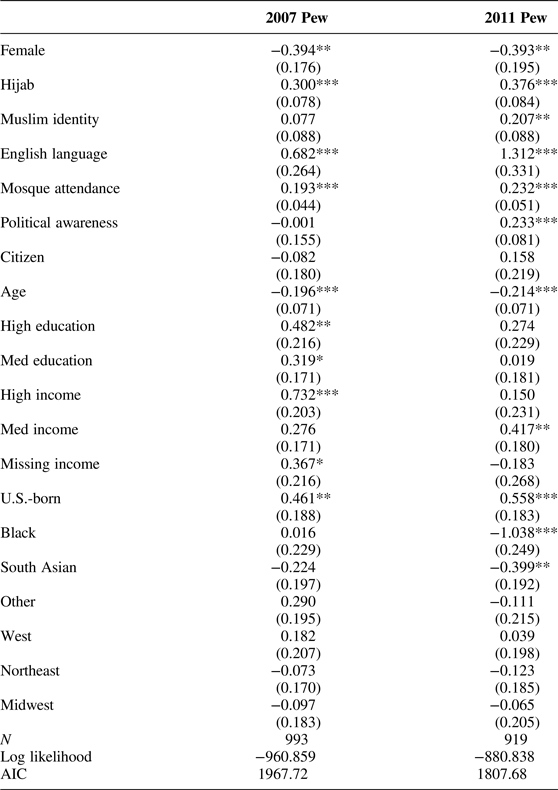
Unlike the observed gender effects in the models of every-day, societal discrimination, we find no discernible relationship between gender and discrimination at the airport. Figure 5 demonstrates that men are no more likely than women to report discrimination in an institutional setting. However, once again, hijab plays an important role. In the 2007 model, veiled Muslims are 12 percentage points more likely than their counterparts to think that they have been singled out by airport security. A nearly identical relationship is visible in 2011: hijab increases the probability of perceiving airport discrimination by nearly 15 percentage points. The only other variable that stands out across both datasets is mosque attendance, which has an impact similar to wearing the hijab. Older participants appear to be less likely to perceive discrimination across both datasets, but the relationship is slightly outside traditional bounds of statistical significance. Muslim identity, English language proficiency, and political awareness are all associated with self-reported discrimination in the 2011 model, but not in 2007. In comparison to the findings around every-day discrimination, nativity plays an insignificant role in both the fully specified airport discrimination models. Higher socioeconomic status is also associated with experiencing discrimination at the airport in 2007, but not distinguishable from value zero in 2011, although the relationships are in the same direction. Once again, the race and ethnicity findings are inconclusive, as are the regional findings. Overall, only two variables stand out across both datasets and different measures of discrimination: wearing the hijab and regularly attending the mosque.
Predictors of airport discrimination (full sample)

As a robustness check, we created a global discrimination index by combining the three aforementioned measures and regressed it on hijab, gender, and other control variables.Footnote 22 This additional analysis (see Table 4) does not change the main findings. The hijab variable is positively associated with perceived discrimination across both datasets. The overarching index, however, does mask the more nuanced findings we found with respect to gender and institutional (airport) discrimination. As such, prior work advices against using global or overarching discrimination measures (Krieger Reference Krieger1999, Reference Krieger, Berkman and Kawachi2000), especially indices that combine different sources of discrimination (Oskooii Reference Oskooii2016; Oskooii Reference Oskooiiforthcoming).
Predictors of reporting discrimination (global index)

AIC, Akaike Information Criterion
*p < 0.1; **p < 0.05; ***p < 0.01; ordered logistic regression.
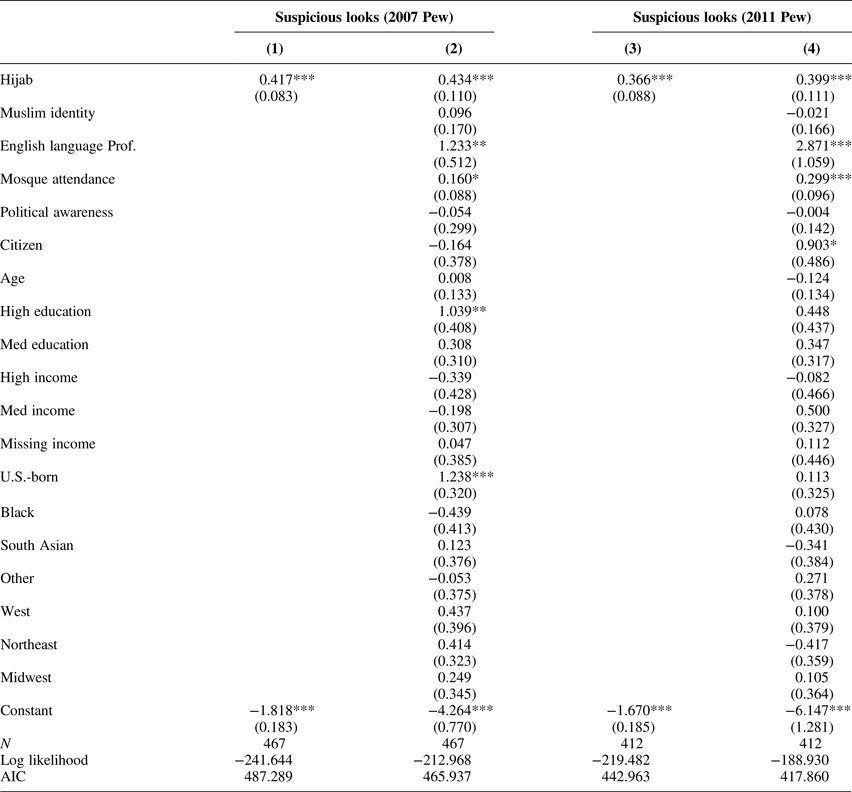
Now that we have identified the factors that are related to perceived discrimination in two different domains among the entire sample of Muslim Americans, we evaluate the impact of wearing the hijab among the subset of the women. One potential critique of the hijab findings presented above is that men do not wear the hijab and, as such, including both men and women in the non-hijab category can bias the results. To address this concern, we replicated the previous models with female participants only. Tables 5–7 first assess the bivariate relationship between the hijab variable and the three discrimination measures before controlling for additional explanatory variables.
Predictors of reporting suspicious looks (women only)

AIC, Akaike Information Criterion
*p < 0.1; **p < 0.05; ***p < 0.01.
Predictors of reporting verbal abuse (women only)

AIC, Akaike Information Criterion
*p < 0.1; **p < 0.05; ***p < 0.01.
Predictors of reporting airport discrimination (women only)

AIC, Akaike Information Criterion
*p < 0.1; **p < 0.05; ***p < 0.01.
Subsetting the data by gender does not change our interpretation of the persistent impact of the hijab on perceiving discrimination. Figures 6–8 demonstrate the direction and strength of this relationship. Holding all covariates at their respective means, veiled women are significantly more likely than women who never wear the hijab to report suspicious looks, verbal abuse, and being targeted by airport security across both datasets. Our findings are also remarkably consistent with respect to effect sizes. Recall that the hijab increased the probability of perceiving suspicious looks by about 20 percentage points in the full sample models. The results are almost identical in the models including only women—20% in 2007 and 18% in 2011. We also find that mosque attendance and English language proficiency, to some degree, are associated with self-reported discrimination. The impact of the other explanatory variables generally corroborate what we observed in the full sample models. We should note, however, that p-values are highly sensitive to sample size differences. Since the women-only models cut the total number of observations nearly in half, some variables will lose statistical significance partly as a function of increased uncertainty around the estimates. Nevertheless, the impact of hijab is robust across all models presented in our analysis.
Predictors of suspicious looks (women only)

Predictors of verbal abuse (women only)

Predictors of airport discrimination (women only)

CONCLUSION AND DISCUSSION
Previous research demonstrates that the Muslim American community is subjected to much scrutiny and discrimination due to the construction of Islam as intolerant, violent, foreign, and at odds with western values. These stereotypical depictions and increasingly sensationalist accounts of what Muslims think and how they behave have further facilitated the process of racialization. Consequently, a community diverse in national origin, immigration histories, cultural orientations, and behaviors is viewed as a “band of others” (Kalkan, Layman and Uslaner Reference Kalkan, Layman and Uslaner2009), with external characteristics such as dress, language, accent, and skin color serving as heuristics for radicalization, leading to their social exclusion. Yet, prior work has largely neglected to systematically investigate which subgroups of Muslim Americans are more likely to perceive discrimination, especially due to ascriptive identifiers.
The present study fills this gap in the literature. Drawing from the research in social psychology, race and ethnic politics, and religion and politics, we argued that the hijab serves as a particularly salient marker of difference that homogenizes an otherwise diverse group. Our analysis provides compelling evidence that the hijab is one of the most important predictors of perceived, individual-level discrimination among Muslim Americans. Importantly, this finding is robust across different measures of discrimination, model specifications, and datasets. This suggests that hijabi women are particularly vulnerable as the climate of Islamophobia worsens in the wake of Donald Trump's ascendance to the presidency and the implementation of targeted policies such as the “Muslim ban.” Partly as a function of this vulnerability, hijabi women may continue to gravitate toward insular networks and feel less inclined to engage in mainstream political activities (Westfall et al. Reference Westfall, Çelik Russell, Welborne and Tobin2017). This should raise normative concerns for political scientists, legal scholars, advocates, and public officials.
Our study further demonstrates that the relationship between gender and self-reported discrimination is more complicated than one might assume. After accounting for the hijab in the full sample models, we discovered that men report more discrimination than their non-hijabi female counterparts. This finding is perhaps intuitive given that Muslim men are viewed as a threatening. A Muslim American male interviewed for the 2017 Pew study of American Muslims articulates this heightened sense of awareness in the current sociopolitical climate: “There is so much attention drawn to people being Muslim and symbols of Islam, hijab being one of them. We have to take extra caution scanning our surroundings—know where we are, who is around and what kind of thoughts they might hold for Islam, about Islam or against Islam. Especially when the Muslim ban was introduced the first time around, I literally felt like the persecution had started” (21, Pew, 2017). We would not have uncovered the finding that Muslim men are particularly aware of discrimination without controlling for the role of hijab. Absent this measure, one would mistakenly conclude that gender has no discernible impact on the perceptions of discrimination.
To our knowledge, this finding is the first of its kind, bringing further attention to the interplay between gender, race, and religion in the everyday experiences of Muslim Americans. Our analysis also demonstrates that Muslim Americans familiar with the American customs and behavioral practices may be more aware of subtle forms of discrimination in different contexts, and may therefore perceive more discrimination. The findings, for instance, highlight the role of nativity (U.S.-born) and English language proficiency in predicting perceptions of mistreatment. The results further show that regular mosque-goers were significantly more likely than their counterparts to report discrimination both in every-day settings and in institutional ones. Indeed, mosque attendance is as robust as a predictor of self-reported discrimination as is our key independent variable of interest, the hijab.
The strong and consistent relationship between mosque attendance and discrimination, in particular, suggests that the process of perceiving discrimination is likely a two-way street. On the one hand, the evidence is undeniable that Muslim Americans are viewed very negatively and have been subjected to much discrimination over the last two decades. A simple glance at hate crime statistics since 9/11, which notoriously under-report such incidents, paints a troubling image for the status of Muslim Americans (UCR Hate Crime Statistics, 2002; 2010; 2015).Footnote 23 Add the anti-Muslim and anti-mosque legislative actions taken at the state and federal level to the mix, and it becomes even more apparent that reported discrimination among Muslim Americans matches political reality.
Yet, as social psychologists have previously noted, identifying discriminatory encounters involves subjective evaluations (Kaiser and Major Reference Kaiser and Major2006). That is, some individuals, such as those with a strong sense of group identity, are more likely than their low identity counterparts to label ambiguous or even non-discriminatory encounters with higher status group members as discriminatory (Major, Quinton and McCoy Reference Major, Quinton and McCoy2002). While we did not find a consistent positive association between our measure of identity and perceived discrimination, mosque attendance, which is strongly linked with seeing oneself as a devout Muslim, does increase perceptions of discrimination. This relationship was even present when modeling airport discrimination, suggesting that TSA officials have the ability to single-out regular mosque-goers in their security checks. We find this latter point hard to believe. A more plausible explanation is that some Muslim Americans, as a function of certain predispositions, may simply be more prone to labeling even potentially non-discriminatory actions as discriminatory. However, recognizing that discrimination is complex and that some perceive it where it may not exist should not deter scholars from investigating factors that lead to the feelings of marginalization, given its demonstrably negative impacts on a variety of democratic, health, and sociological outcomes.
We offer our findings with a number of caveats, and conclude by highlighting the areas for future research. While our results are robust across two national datasets of Muslim Americans, we cannot speak to the current climate of Islamophobia in the United States. However, given the xenophobic political rhetoric throughout much of the 2016 presidential campaign, spikes in hate speech and crimes aimed at Muslim Americans, and executive actions taken by President Trump to bar Muslims from entering the country, we do not think much has changed as it pertains to the discrimination of hijabi women.
Indeed, an analysis of original survey data of 216 American Muslim Americans that we fielded between February and March of 2017 through Survey Sampling International (SSI) suggests that the marginalization of hijabi women is still a persistent problem and a serious concern. To be clear, the results we share are of a convenience sample and, therefore, not representative of the overall population of Muslims in the United States. As such, readers should interpret the findings as preliminary and suggestive. Nevertheless, these new data paint a consistent picture of the marginalization of hijabi women we observed with the 2007 and 2011 Pew datasets.
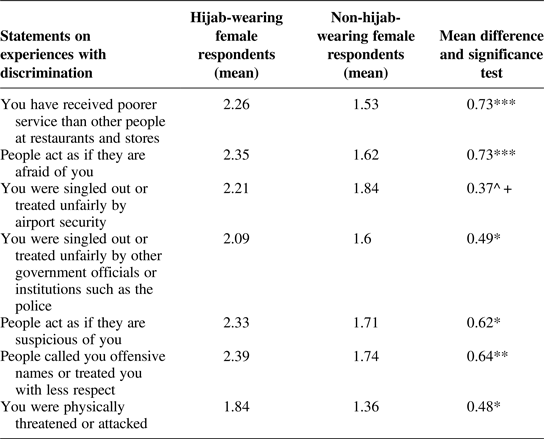
Out of the entire SSI sample, 118 of the respondents were women and were posed with the following question about hijab: “When you are out in public, how often do you wear religious garb or a headcover or hijab (hee-jab)? Do you wear it all the time, most of the time, only some of the time, or never?” Of the women who answered this question, 55 replied “never” or “only some of the time” and 58 replied “most of the time” or “all of the time.” Respondents were also asked to evaluate seven questions about discrimination on a Likert scale ranging from 1 (strongly disagree) to 4 (strongly agree): (1) you have received poorer service than other people at restaurants and stores, (2) people act as if they are afraid of you, (3) you were singled out or treated unfairly by airport security, (4) you were singled out or treated unfairly by other government officials or institutions such as the police, (5) people act as if they are suspicious of you, (6) people called you offensive names or treated you with less respect, and (7) you were physically threatened or attacked. A t-test comparison of means in Table 8 demonstrates that hijabi women perceive high levels of discrimination in 2017.Footnote 24 That is, hijab-wearing women are significantly more likely than their counterparts to report societal discrimination and what Oskooii (Reference Oskooii2016) refers to as “political discrimination.” Again, while not nationally representative, the findings lend support to the multivariate analysis that we were able to conduct with the two Pew datasets.
SSI sample of female Muslim American respondents (February–March 2017)

The last column displays t-test results and difference in means between respondents who reported wearing the hijab regularly as opposed to only sometimes or never.
+p < 0.10, *p < 0.05, **p < 0.01, ***p < 0.001.
While our research paid attention to one of the most salient ascriptive identifiers among Muslim Americans, data limitations also did not permit us to examine the full range of visual heuristics. For instance, we were unable to assess the extent to which Islamic clothing accessories worn by men, such as a Kufi, could expose individuals to increased discrimination. This omission perhaps underlies the finding that men are more likely to experience discrimination than are women who do not wear the headscarf. That is, just as women who do not wear the hijab are less likely to experience discrimination than women who do, it is likely that men who do not fit the visual stereotype of “Muslim” are more or less exempt from heightened scrutiny.
Moreover, we find mixed results in reference to race and religion. It is not unreasonable to expect that in the United States, race bifurcates both inter- and intra-group experiences with discrimination. Future research would benefit from examining the intersection of race and religion, and from paying attention to issues of “in-group” or “internal” discrimination. The study of internal discrimination among Latinos by Lavariega-Monforti and Sanchez (Reference Lavariega Monforti and Sanchez2010) is one prominent example. They illustrate that black Latinos, for instance, are more likely than other subgroups to report mistreatment from non-black Latinos. Since the Muslim American population is equally diverse, in-group discrimination on the basis of race, ethnic background, nativity, and accent could powerfully impact the identity formation, views, behaviors, and the well-being of certain subgroups of Muslims who may not only face out-group discrimination, but also in-group marginalization.
Lastly, our findings are limited to the experience of American Muslims. Certainly, Muslims in other places such as the UK, France, Belgium, and Germany also face discrimination, and those experiences are potentially also gendered (Bayrakli and Hafez Reference Bayrakli and Hafez2017). In a recent statement, the former labour communities minister in the UK, Shahid Malik, expressed specific concern for hijab-wearing women: “We stand in uncharted territory…the statistics paint a profoundly bleak picture of the explosion of anti-Muslim hate both online and on our streets, with visibly Muslim women being disproportionately targeted by cowardly hatemongers” (Jeory Reference Jeory2016). We hope that our study brings further attention to the antecedents of discrimination and encourages scholars to examine the experiences of Muslim minorities in the United States and abroad with specific attention to the role of gender and visual heuristics.
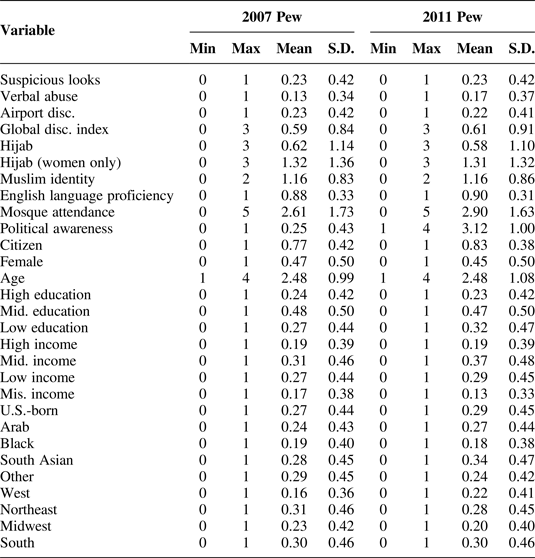
Descriptive statistics

a Summary statistics without survey weights; entire sample.