Introduction
The neurobiological continuum linking the two psychotic illnesses – schizophrenia and bipolar disorder – is elusive despite two decades of rapid advance in neuroscientific methods (Keshavan et al. Reference Keshavan, Morris, Sweeney, Pearlson, Thaker, Seidman, Eack and Tamminga2011; Kaur et al. Reference Kaur, Battisti, Lagopoulos, Ward, Hickie, Franz and Hermens2012). In the past, neuroimaging studies have mostly focused on trying to differentiate between schizophrenia spectrum and bipolar disorder, by aiming to identify disease-specific mechanisms in each of these disorders (Curtis et al. Reference Curtis, Dixon, Morris, Bullmore, Brammer, Williams, Sharma, Murray and McGuire2001; Costafreda et al. Reference Costafreda, Fu, Picchioni, Kane, McDonald, Prata, Kalidindi, Walshe, Curtis, Bramon, Kravariti, Marshall, Toulopoulou, Barker, Davis, Brammer, Murray and McGuire2009; Whalley et al. Reference Whalley, McKirdy, Romaniu, Sussmann, Johnstone, Wan, McIntosh, Lawrie and Hall2009; Hall et al. Reference Hall, Whalley, Marwick, McKirdy, Sussmann, Romaniuk, Johnstone, Wan, McIntosh and Lawrie2010). Current evidence suggests that these two disorders share a significant overlap in genetic susceptibility (Craddock et al. Reference Craddock, O'Donovan and Owen2005; Berrettini, Reference Berrettini2011), pharmacological treatment responses (Murray et al. Reference Murray, Sham, van OS, Zanelli, Cannon and McDonald2004), neuropsychological deficits (Hill et al. Reference Hill, Reilly, Margret, Harris, Rosen, Marvin, DeLeon and Sweeney2009), and epidemiological features and hence possibly a common pathophysiology, thereby challenging the so-called Kraepelinian dichotomy (Kraepelin, Reference Kraepelin1919). In light of this, an emphasis on identifying the similarities and shared neural mechanisms between these two illnesses could aid the understanding of the pathophysiological basis of the clinical continuum of psychosis.
Along with functional imaging and grey-matter alterations, studying changes in the white-matter (WM) microstructure have provided valuable insights into the possible pathophysiology or course of these disorders. WM abnormalities, observed using diffusion tensor imaging (DTI) suggesting altered connectivity has been consistently reported in both bipolar disorder (Chan et al. Reference Chan, Yang, Chia, Woon, Lee, Keefe, Sitoh, Nowinski and Sim2010b; Heng et al. Reference Heng, Song and Sim2010; Benedetti et al. Reference Benedetti, Absinta, Rocca, Radaelli, Poletti, Bernasconi, Dallaspezia, Pagani, Falini, Copetti, Colombo, Comi, Smeraldi and Filippi2011a,Reference Benedetti, Yeh, Bellani, Radaelli, Nicoletti, Poletti, Falini, Dallaspezia, Colombo, Giuseppe, Smeraldi, Soares and Brambillab) and schizophrenia (Chan et al. Reference Chan, Yang, Chia, Lau, Sitoh, Nowinski and Sim2010a; Kunimatsu et al. Reference Kunimatsu, Aoki, Kunimatsu, Abe, Yamada, Masutani, Kasai, Yamasue and Ohtomo2012; Levitt et al. Reference Levitt, Alvarado, Nestor, Rosow, Pelavin, McCarley, Kubicki and Shenton2012; Mandl et al. Reference Mandl, Rais, van Baal, van Haren, Cahn, Kahn and Hulshoff Pol2013). However, the literature on DTI-based direct comparison between schizophrenia and bipolar disorder is scarce. Four studies exist (McIntosh et al. Reference McIntosh, Maniega, Lymer, McKirdy, Hall, Sussmann, Bastin, Clayden, Johnstone and Lawrie2008; Sussmann et al. Reference Sussmann, Lymer, McKirdy, Moorhead, Munoz, Job, Bastin, Johnstone, Lawrie and McIntosh2009; Cui et al. Reference Cui, Chen, Deng, Huang, Li, Ma, Huang, Jiang, Wang, Wang, Collier, Gong and Li2011; Lu et al. Reference Lu, Zhou, Keedy, Reilly and Sweeney2011) but examined samples that differ in important respects. Two studies did not exclude patients without psychosis (McIntosh et al. Reference McIntosh, Maniega, Lymer, McKirdy, Hall, Sussmann, Bastin, Clayden, Johnstone and Lawrie2008; Sussmann et al. Reference Sussmann, Lymer, McKirdy, Moorhead, Munoz, Job, Bastin, Johnstone, Lawrie and McIntosh2009). The other two studies (Cui et al. Reference Cui, Chen, Deng, Huang, Li, Ma, Huang, Jiang, Wang, Wang, Collier, Gong and Li2011; Lu et al. Reference Lu, Zhou, Keedy, Reilly and Sweeney2011) examined patients with first-episode psychosis and hence might be biased against observing a dichotomy as the chronic time-course that was a key feature of Kraepelin's concept of dementia praecox is less clearly discernible during the first episode.
The majority of DTI studies employ the measure of fractional anisotropy (FA) to study WM integrity. Although FA is a sensitive index of WM microstructure, the neuronal interpretation of this measure is limited due to its composite nature. Pathological changes in FA can occur due to either axonal damage or myelin degradation and in order to decipher their relative contributions to FA change, along with calculating FA, it is necessary to also derive measures of axial diffusivity (AD) and radial diffusivity (RD) (Alexander et al. Reference Alexander, Lee, Lazar and Field2007; Seal et al. Reference Seal, Yucel, Fornito, Wood, Harrison, Walterfang, Pell and Pantelis2008). Second, FA alone cannot provide enough information about the microstructural architecture of the WM tracts. A newly developed tensor index called mode of anisotropy (MoA) can detect the predominance of crossing-fibre orientation in WM, thereby allowing for a more meaningful interpretation of FA results (Ennis & Kindmann, Reference Ennis and Kindmann2006; Jolapara et al. Reference Jolapara, Kesavadas, Radhakrishnan, Saini, Patro, Gupta, Kapilamoorthy and Bodhey2009). Although these indices have been employed in a number of recent DTI studies, a comprehensive analysis using multiple indices of WM integrity to identify the neural basis of psychotic continuum has not been reported yet.
Thus, to address these issues, we studied a sample representative of the two ‘poles’ of the ‘Kraepelinian axis’, with a focus on localizing brain regions which share altered WM connectivity across the psychotic disorders. Such abnormalities, if identified, would represent the structural underpinnings of the putative Kraepelinian axis itself, rather than the correlates of one of the two poles of this axis. We aimed to delineate the WM abnormalities that are common to both poles of the axis initially by undertaking an exhaustive search for FA changes in the entire patient group compared to non-psychotic healthy controls, followed by a comprehensive measurement of AD, RD and MoA in the regions showing a shared WM dysconnectivity. A prominent feature of Kraepelin's concept of dementia praecox was poor outcome (Heckers, Reference Heckers2008). Nonetheless, while outcome is generally better in bipolar disorder, the evidence indicates a continuum of symptomatic, cognitive and functional outcome (Johnstone et al. Reference Johnstone, Frith, Crow, Owens, Done, Baldwin and Charlette1992). This suggests that the pathological process common to both disorders might be more strongly expressed in schizophrenia but nonetheless associated with indices of poor outcome across the spectrum psychotic disorders. We therefore predict that the severity of WM dysconnectivity would be related to the functional ability and persistent symptom burden in individuals with psychosis.
Methods
Participants
Patients undergoing treatment for psychotic disorders were referred by the Early Intervention in Psychosis teams and other community-based mental healthcare teams in Nottinghamshire and Leicestershire, England. Upon referral clinical information was collected using retrospective review of case notes, discussion with referring clinicians and a video-recorded clinical interview using standardized symptom assessment procedure [Signs and Symptoms in Psychotic Illness Scale (SSPI); Liddle et al. Reference Liddle, Ngan, Duffield, Kho and Warren2002]. The clinical diagnosis was made in a consensus meeting in accordance with the best estimate procedure described by Leckman et al. (Reference Leckman, Sholomskas, Thompson, Belanger and Weissman1982). Patients aged 18–50 years satisfying the DSM-IV criteria for schizophrenia or schizoaffective disorder (SCZ), or bipolar disorder with psychotic features (BPP) were included in the study, provided they satisfied the following inclusion criteria: (1) IQ of at least 65 assessed using the Quick Test (Ammons & Ammons, Reference Ammons and Ammons1962); (2) no lifetime history of substance dependence or harmful use in the past 6 months; (3) no history of significant head trauma or medical conditions likely to have appreciable neurological or psychiatric effects; (4) no contraindications for MRI safety assessed by a standardized safety screening questionnaire.
All patients were in a stable phase of illness, defined as a change of no more than 10 points in their ‘Global Assessment of Function’ (GAF; APA, 1994) score between assessment 6 weeks prior to and immediately prior to study participation. Fifty-five out of 64 patients were receiving psychotropic medications. The median defined daily dose (DDD; WHO-CCDSM, 2003) was calculated separately for antipsychotics, mood stabilizers including lithium and antidepressants and no patient had a change in any of these medications 6 weeks prior to participating in this study.
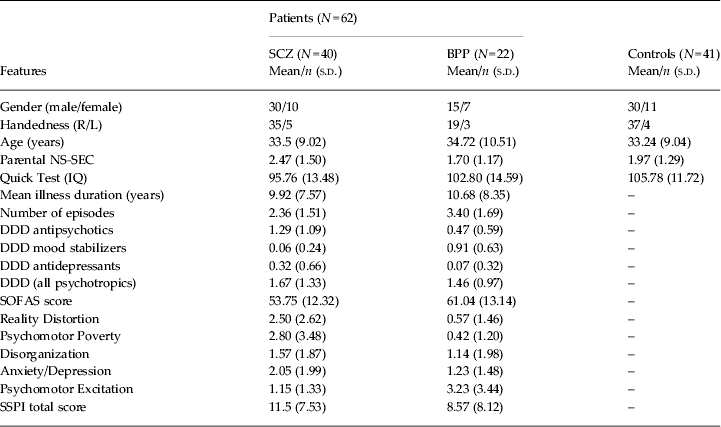
Healthy controls were recruited from the local community via advertisements and participants were recruited and group-matched to the patient group for age and parental socioeconomic status (Rose & Pevalin, Reference Rose and Pevalin2003). Controls satisfied the same inclusion and exclusion criteria as the patients, as specified above, and in addition did not have a personal or family history of psychotic disorders. A clinical interview by a research psychiatrist was employed to ensure that the controls were free from current Axis I disorder and a history of either psychotic illness or neurological disorder. Handedness was assessed for both patients and healthy controls using the 12-item Annett scale (Annett, Reference Annett1970). Social and occupational functioning in patients was evaluated using the Social and Occupational Functioning Assessment Scale (SOFAS; APA, 1994). The clinical and demographic features of the sample are presented in Table 1.
Clinical and demographic features

SCZ, Schizophrenia or schizoaffective disorder; BPP, bipolar disorder with psychotic features; NS-SEC, National Statistics Socio-Economic Classification; DDD, defined daily dose; SOFAS, Social and Occupational Functioning Assessment Scale; SSPI, Signs and Symptoms of Psychotic Illness.
The issue of appropriate matching to minimize risk of group differences in brain development unrelated to the pathophysiology of schizophrenia remains a subject of debate. There is consistent evidence that moderate lowering of IQ is related to the pathophysiology of schizophrenia and in particular, current IQ is influenced by factors such as age at onset of the disease, illness duration, severity of symptoms (Aylward et al. Reference Aylward, Walker and Bettes1984; Woodberry et al. Reference Woodberry, Giuliano and Seidman2008). Therefore we did not match for IQ. Nonetheless, to avoid inclusion of cases with IQ deficits greater than those typically observed in schizophrenia, we excluded individuals with a proxy estimate of current IQ lower than 65, as measured by the Quick Test.
We used parental socioeconomic status as a matching variable in this study. Parental occupational status might be expected to predict brain development (Noble et al. Reference Noble, Norman and Farah2005; Farah et al. Reference Farah, Shera, Savage, Betancourt, Giannetta, Brodsky, Malmud and Hurt2006). Although there is evidence that parental occupational status is at last weakly predictive of risk of schizophrenia or of severity of illness, the evidence is ambiguous (Parrott & Lewine, Reference Parrott and Lewine2005). We therefore consider that matching groups for parental occupational status is the most appropriate way to minimize risk of group differences in brain development that are not directly related to the pathophysiology of schizophrenia.
The original sample consisted of 37 patients with schizophrenia, six with schizoaffective disorder, 22 patients with bipolar disorder and 41 controls, but two subjects with schizophrenia were excluded due to movement artefacts in the DTI scans, while one subject with schizophrenia did not complete the DTI acquisition protocol as planned, providing a final sample of 103 subjects (34 with schizophrenia, six with schizoaffective disorder, 22 with bipolar disorder, and 41 controls). Functional connectivity findings from this sample have already been reported (Palaniyappan & Liddle, Reference Palaniyappan and Liddle2014).
Due to the small number of subjects with schizoaffective disorder, this group was included with the schizophrenia group for further analysis; when undertaking direct comparison between BPP and SCZ, we conducted sensitivity analysis by excluding the schizoaffective patients from the SCZ group. The study was approved by the National Research Ethics Committee, Derbyshire, UK. Written informed consent was obtained from all study participants in accord with the procedure approved by the Ethics Committee.
Image acquisition
All scans were conducted at Sir Peter Mansfield Magnetic Resonance Centre, University of Nottingham using 3-T Philips Achieva MR Scanner (Philips Medical Systems, The Netherlands). Diffusion-weighted images were acquired using a single-shot, spin-echo, echo planar imaging (EPI) sequence in alignment with the anterior commissure–posterior commissure (AC–PC) plane. The acquisition parameters were as follows: repetition time (TR) = 8.63 s, echo time (TE) = 56.9 ms, voxel size = 2 mm isotropic, 112 × 112 matrix, field of view (FoV) = 224 × 224 × 104, flip angle = 90°, 52 slices, 32 directions with a b-factor of 1000 s/mm2, EPI factor = 59, total scan time = 6.29 min. Scans were inspected immediately after each acquisition, and if motion was detected, scans were repeated.
Data pre-processing
Diffusion-weighted data were converted from DICOM in order to analyse images. FSL (FMRIB) was used for all data pre-processing and analysis (www.fmrib.ox.ac.uk/fsl). FSL's Diffusion Toolbox (FDT) was used in order to correct for head motion and eddy current distortions (Behrens et al. Reference Behrens, Woolrich, Jenkinson, Johansen-Berg, Nunes, Clare, Matthews, Brady and Smith2003). In order to remove non-brain voxels, the brain extraction tool (BET) was used to create a binary mask from the non-diffusion weighted data (Smith, Reference Smith2002). Diffusion tensor and associated parameters such as FA, AD, RD and MoA were then calculated by applying a single tensor model using the DTIFIT tool in FSL. In preparation for tractography, the data was also run through the program BEDPOSTX to build probability distributions on diffusion parameters and model for crossing fibres at each voxel (Behrens et al. Reference Behrens, Berg, Jbabdi, Rushworth and Woolrich2007).
FA ranges from 0 to 1, where 0 indicates regions with isotropic diffusion and 1 indicates perfect linear diffusion that is expected along the WM fibres. RD is considered to represent the integrity of myelin while AD is considered to represent axonal integrity. MoA varies from −1 to +1, with values closer to −1 indicate regions where high number of crossing fibres can be expected and values closer to +1 indicate regions where one fibre orientation predominates (Douaud et al. Reference Douaud, Jbabdi, Behrens, Menke, Gass, Monsch, Rao, Whitcher, Kindlmann, Matthews and Smith2011). Lower MoA values observed within a specific WM region in group comparisons may indicate that the underlying architecture of the WM fibres in this region may be ‘disorganized’ in one group compared to the other.
Tract-based spatial statistics (TBSS)
TBSS (Smith et al. Reference Smith, Jenkinson, Johansen-Berg, Rueckert, Nichols, Mackay, Watkins, Ciccarelli, Cader, Matthews and Behrens2006) was used in order to analyse the DTI data. First, the FA data were pre-processed in order to remove likely outliers from the diffusion tensor fitting. Nonlinear transformation and affine registration was then performed in order to align all FA images to a standard space (Andersson et al. Reference Andersson, Jenkinson and Smith2007a, Reference Andersson, Jenkinson and Smithb). Following registration, the mean FA image and skeleton which represents the centres of all tracts common to the group were created. The mean FA skeleton was then thresholded at 0.2, after which each subject's aligned FA data was projected onto this skeleton, allowing for further voxelwise statistical analysis. A similar approach for transformation and registration followed by projection on to the TBSS skeleton was applied for the AD, RD and MoA images.
Statistical analysis
Voxelwise statistical analysis were conducted using TBSS, in order to compare whole brain group level differences in FA between the two groups – all patients with psychosis (PSY) and healthy controls (HC). A t test was used for the comparison with age and gender as covariates. A threshold-free cluster enhancement (TFCE) approach was adopted with 10 000 permutations to correct for multiple comparisons without having to specify an initial cluster-forming threshold, with equal weighting for the peak height and extent of clusters (Smith et al. Reference Smith, Jenkinson, Johansen-Berg, Rueckert, Nichols, Mackay, Watkins, Ciccarelli, Cader, Matthews and Behrens2006). We also used this statistical design to directly compare the two diagnostic groups: SCZ and BPP. We repeated this comparison initially by excluding the six subjects with schizoaffective disorder from the SCZ group, and then by including these six subjects in the BPP group.
Clusters surviving TFCE corrected p = 0.05 from PSY v. HC comparison were used to obtain individual binary masks to extract cluster specific mean FA, RD, AD and MoA values for each subject. FA, RD, AD and MoA from the clusters were compared using separate ANOVAs with diagnosis (HC, SCZ, BPP) as the independent variable and age and gender as covariates. Holm–Sidak corrected follow-up t tests were applied to detect differences among the three diagnostic groups (Sidak, Reference Sidak1967). Multiple regression analyses used to predict symptom scores, number of episodes and functional outcome measured using SOFAS is described in the Results section below.
We used probabilistic tractography to visualize the connectivity of clusters showing significant group differences. The maxima of clusters surviving TFCE correction for the PSY v. HC comparison in the TBSS analysis of FA were used to generate 3-mm radius spherical seed regions of interest (ROI). Probabilistic tractography (seed to rest of the brain) was carried out for each ROI using FSL's PROBTRACKX2 tool (5000 samples from each seed voxel, step length = 0.5 mm, curvature threshold = 0.2). The resulting connectivity maps were thresholded at 10% of the total generated tracts to remove voxels that showed extremely low connectivity, and to retain the major WM pathway passing through the seed regions. Each subject's FA map was transformed to standard space using the FMRIB nonlinear image registration tool (FNIRT).
Results
TBSS voxelwise statistical analysis – group differences
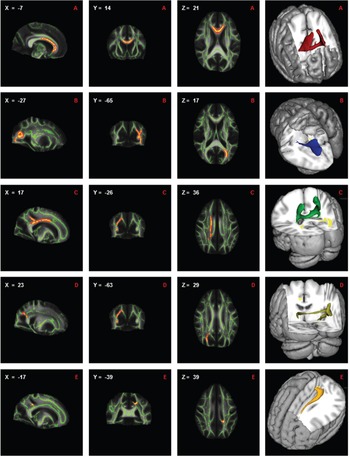
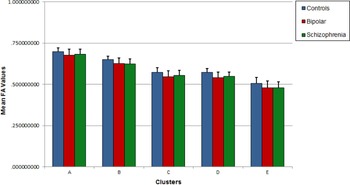
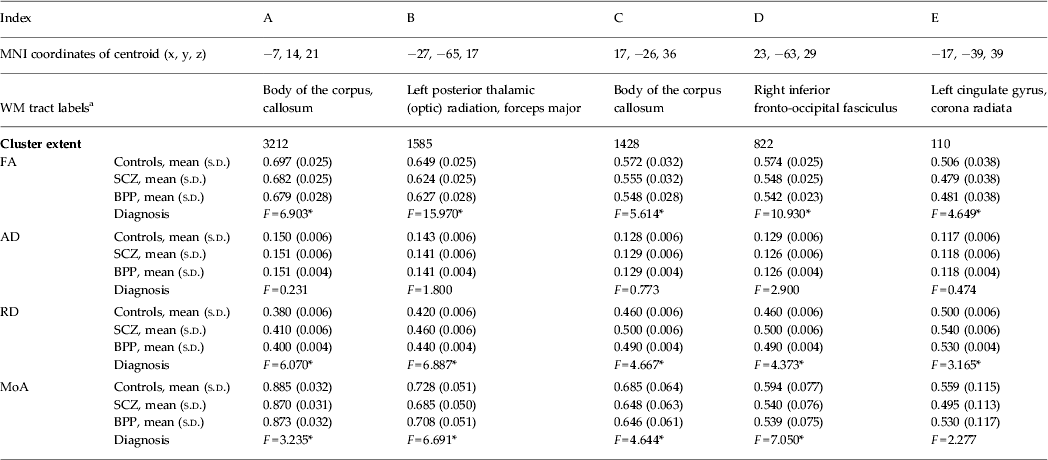
Patients with psychosis had five significant clusters with reduced FA compared to controls. Clusters were located at diverse locations embracing longitudinal and inter-hemispheric tracts. These results are presented in Table 2 and Fig. 1. In all of these regions both SCZ and BPP groups had reduced FA compared to controls, with BPP v. HC comparisons reaching statistical significance at clusters A, B and D (corrected p < 0.05), and showing a trend towards significance in clusters C and E (corrected p = 0.06). FA reduction was accompanied by an increase in RD and a reduction in MoA in both patient groups, but reaching statistical significance only in patients with schizophrenia. However, inspection of the values for FA in each diagnostic group at the local maxima within each of the five clusters reveals no consistent trend for the abnormalities to be greater in SCZ, indicating that the greater statistical significance in the contrast of SCZ with HC compared to the contrast of BPP with HC is due to the greater statistical power in the larger sample of SCZ. The spread of FA values in the three groups is shown in Fig. 2.
Clusters from the voxelwise analysis showing significant reduction in fractional anisotropy (FA) in psychotic patients (n = 62) compared to healthy controls (n = 41). Results are shown overlaid on the mean FA image with the mean FA skeleton in green, using the centroid coordinates, threshold-free cluster enhancement-corrected p < 0.05 and have been thickened using the tbss_fill script in FSL. Left–right orientation is in accordance with radiological convention. Figures in right column shows 3D visualization of tracts generated from probabilistic tractography overlaid on a standard Montreal Neurological Institute brain. For visualization purposes, tracts displayed are those present in at least half of the subjects.

Mean FA values for the five clusters obtained from the tract-based spatial statistics analysis for each of the three groups – healthy controls (HC), schizophrenia and schizoaffective disorder (SCZ) and bipolar disorder with psychoses (BPP). Error bars represent standard deviation (s.d.) values.

Regions showing FA reduction in patients with psychosis

MNI, Montreal Neurological Institute; FA, Fractional anisotropy; RD, radial diffusivity; AD, axial diffusivity; MoA, mode of anisotropy; SCZ, schizophrenia or schizoaffective disorder; BPP, bipolar disorder with psychotic features.
All clusters survived FEW-corrected p value <0.05.
a White-matter labels are provided in accordance with JHU White Matter Tractography Atlas and the ICBM DTI-81 White Matter Labels Atlas (Mori et al. Reference Mori, Wakana, Nagae-Petscher and van Zijl2005). Only tracts with >5% probability are included in the labels.
* Denotes p < 0.05 for F tests.
We did not find any brain regions showing statistically significant differences in FA when directly comparing SCZ and BPP groups. Even when the significance threshold was lowered to p = 0.15, we did not observe differences between the two groups. The inclusion of schizoaffective patients in either SCZ or BPP groups did not alter this null observation.
WM integrity factor
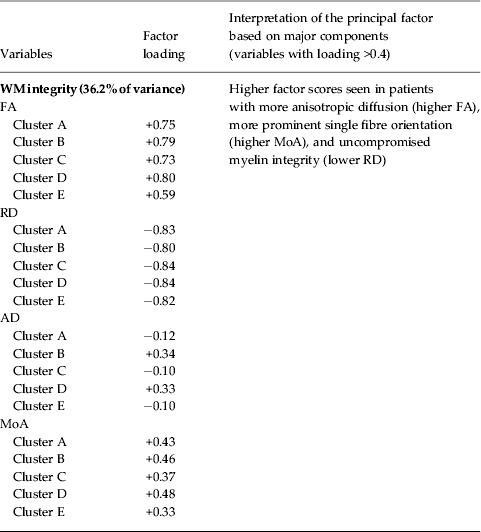
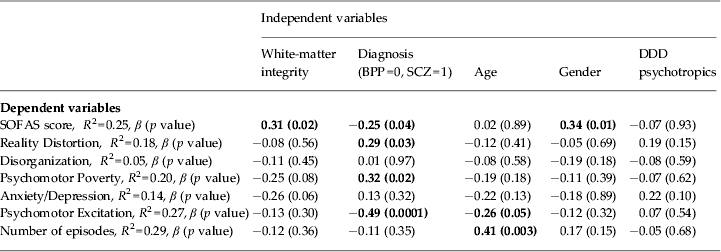
In the PSY group, FA, AD, RD and MoA values for the clusters were all correlated with each other (mean absolute Pearson's correlation value |r| = 0.33); this allowed us to extract a general principal component that explained 36.2% of the variance in the WM integrity measures across the clusters using unrotated principal component analysis (Table 3). This component loaded positively on all the FA values of all clusters, and negatively on the RD values; thus the factor scores of this component represented the shared WM integrity across all patients. Patients with higher scores on this factor had intact WM structural integrity characterized by higher FA, MoA, AD and lower RD. This distribution of this factor was not different between SCZ and BPP groups (t = 0.13, p = 0.9). Six separate multiple regression analyses were conducted to predict the SSPI scores of Reality Distortion, Disorganization, Psychomotor Poverty, Anxiety/Depression, Psychomotor Excitation and the SOFAS scores and number of episodes in the PSY group, using the shared WM integrity factor and diagnostic status (SCZ and BPP) as predictors and age, gender and the combined daily dose of psychotropics (antipsychotics/mood stabilizers or antidepressants) as covariates. All variables (predictors and covariates) were entered in a single step in the regression analyses after ruling out multicollinearity among predictors using SPSS software v. 21 (SPSS Inc., USA). The results of this analysis are presented in Table 4. WM integrity predicted SOFAS but not the number of episodes or symptom scores. Reality Distortion, Psychomotor Poverty and Excitation were predicted by diagnostic classification (for both symptoms, SCZ>BPP), but not by WM integrity.
Factor loading on the principal component (first unrotated factor) relating to white-matter (WM) integrity in patients with psychosis (PSY)

FA, Fractional anisotropy; RD, radial diffusivity; AD, axial diffusivity; MoA, mode of anisotropy.
Multivariate analysis predicting functional status (SOFAS), SSPI syndrome scores and number of episodes in patients with psychosis

SOFAS, Social and Occupational Functioning Assessment Scale; SSPI, Signs and Symptoms in Psychotic Illness Scale; BPP, bipolar disorder with psychotic features; SCZ, schizophrenia or schizoaffective disorder.
No correlation was noted between the WM integrity factor and DDD of antipsychotics, mood stabilizers and antidepressants (p values ranging from 0.2–0.8).
Discussion
Using microstructural indices derived from DTI, we have shown that reduced integrity in callosal, fronto-occipital and paralimbic WM, as indexed by FA, is a feature of psychosis, irrespective of the categorical diagnostic boundaries. This abnormality is specifically associated with an increase in RD and reduction in the MoA, suggesting defects in myelination along with a degree of ‘disorganization’ in the underlying fibre structure in patients with psychosis.
The distribution of the WM factor scores that explain higher FA (and less RD) predicted the inter-individual differences in the functional measure SOFAS after taking into account the variance explained by categorical diagnosis, age, gender and medication use. In other words, the degree of aberration in a neurobiological measure associated with the presence of psychosis relates to the degree of functional impairment that results from the illness.
We did not find any relationship between the WM factor and symptom clusters of Reality Distortion, Psychomotor Poverty, Disorganization, Anxiety/Depression or Excitation. This observation is consistent with the similar severity of the WM abnormality in the two patient groups that differ in symptoms. On the other hand, the WM abnormality was correlated with severity of occupational and social dysfunction demonstrating a relationship with clinical features present in both disorders. Nevertheless, it is important to note that our sample consisted of clinically stable patients in a medicated state. As a result, the degree of inter-individual variation in the severity of symptoms assessed on the day of the scan was modest.
No differences were observed in FA between SCZ and BPP groups, even at a lenient threshold. This observation is in agreement with previous reports of lack of differences in FA in both TBSS and tractographic studies (McIntosh et al. Reference McIntosh, Maniega, Lymer, McKirdy, Hall, Sussmann, Bastin, Clayden, Johnstone and Lawrie2008; Sussmann et al. Reference Sussmann, Lymer, McKirdy, Moorhead, Munoz, Job, Bastin, Johnstone, Lawrie and McIntosh2009). By contrast, Lu et al. detected differences in FA between the two diagnostic groups in a first-episode sample (Lu et al. Reference Lu, Zhou, Keedy, Reilly and Sweeney2011). In contrast to the TBSS approach used in our study, Lu et al. employed a voxel-based analysis which is more sensitive for changes in peripheral WM, but is associated with reduced spatial (tract-to-tract) correspondence (Zalesky, Reference Zalesky2011).
These results are also consistent with findings reported in some fMRI studies (Argyelan et al. Reference Argyelan, Ikuta, DeRosse, Braga, Burdick, John, Kingsley, Malhotra and Szeszko2014; Brandt et al. Reference Brandt, Eichele, Melle, Sundet, Server, Agartz, Hugdahl, Jensen and Andreassen2014; Palaniyappan & Liddle, Reference Palaniyappan and Liddle2014), which show that neural deficits in schizophrenia and bipolar disorder lie on a continuum, although in general abnormalities are more marked or more widespread in schizophrenia. However, other studies report more distinct, abnormalities in schizophrenia compared to bipolar disorder (Curtis et al. Reference Curtis, Dixon, Morris, Bullmore, Brammer, Williams, Sharma, Murray and McGuire2001; Costafreda et al. Reference Costafreda, Fu, Picchioni, Kane, McDonald, Prata, Kalidindi, Walshe, Curtis, Bramon, Kravariti, Marshall, Toulopoulou, Barker, Davis, Brammer, Murray and McGuire2009; Whalley et al. Reference Whalley, McKirdy, Romaniu, Sussmann, Johnstone, Wan, McIntosh, Lawrie and Hall2009; Hall et al. Reference Hall, Whalley, Marwick, McKirdy, Sussmann, Romaniuk, Johnstone, Wan, McIntosh and Lawrie2010). It is likely that there are some brain features that do differ between the two disorders, though it should be noted that the finding of excessive activation of frontal cortex during task performance in bipolar disorder (e.g. Curtis et al. Reference Curtis, Dixon, Morris, Bullmore, Brammer, Williams, Sharma, Murray and McGuire2001; Costafreda et al. Reference Costafreda, Fu, Picchioni, Kane, McDonald, Prata, Kalidindi, Walshe, Curtis, Bramon, Kravariti, Marshall, Toulopoulou, Barker, Davis, Brammer, Murray and McGuire2009) in contrast to underactivity often reported in schizophrenia does not exclude a continuum. Much evidence indicates that mild or moderate cortical inefficiency is associated with increased activation whereas severe disorder is associated with underactivity (Liddle et al. Reference Liddle, Bates, Das, White, Groom, Jansen, Jackson, Hollis and Liddle2012).
A specific strength of this study is the use of MoA, which allowed us to meaningfully interpret FA changes in regions with predominant crossing fibres. Furthermore, the use of a TBSS approach has certain advantages. TBSS allows for microstructural evaluation of WM tracts, while effectively dealing with alignment inaccuracies and spatial smoothing, which are issues common with VBM-based methods.
Several limitations must be considered while interpreting these findings. This study has a relatively small sample size, particularly for the bipolar group, and it is possible that significant differences between the two diagnostic groups might be detected with larger samples. Nonetheless, such results would not exclude a continuum in which the disorder might be more severe in schizophrenia. Most patients were medicated, with the majority of SCZ patients taking antipsychotics and many BPP patients taking mood stabilizers. A number of studies have shown an effect of prescribed psychotropics on WM in the brain (Brambilla et al. Reference Brambilla, Bellani, Yeh and Soares2009). For instance, some studies have shown a normalizing effect of lithium on FA values, with higher FA values observed in bipolar patients taking lithium as opposed to those on other medication (Hafeman et al. Reference Hafeman, Chang, Garrett, Sanders and Phillips2012). However, in our sample, we did not find any significant correlations between antipsychotic DDD or mood stabilizer DDD and WM indices. Despite this, we cannot completely exclude the effect of prescribed medications on the current observations. Fewer females were included in the study compared to males, and hence all statistical procedures were undertaken by using gender as a covariate. Nevertheless, caution must be exercised when generalizing these results to mixed samples.
Additionally, we acknowledge the possibility that the shared reduced WM integrity found in patients with schizophrenia and bipolar disorder in our sample is a feature of psychiatric illness in general and not psychosis in particular as we did not include non-psychotic bipolar patients in our study. Furthermore, another study has shown no relationship between FA and values and lifetime history of psychotic symptoms in bipolar patients (McIntosh et al. Reference McIntosh, Maniega, Lymer, McKirdy, Hall, Sussmann, Bastin, Clayden, Johnstone and Lawrie2008) and similar results have been found in a largely overlapping sample (Sussmann et al. Reference Sussmann, Lymer, McKirdy, Moorhead, Munoz, Job, Bastin, Johnstone, Lawrie and McIntosh2009).
To conclude, similar WM connectivity abnormalities in callosal, paralimbic and fronto-occipital regions are observed across the spectrum of psychotic illnesses. This shared dysconnectivity predicts functional outcome in psychosis, better than the clinical diagnostic boundary. Poor outcome is seen as the central feature of Kraepelin's conception of dementia praecox (Heckers, Reference Heckers2008). While conventional diagnostic descriptions have failed to capture Kraepelin's concept in a convincing fashion, augmenting this clinical information with neurobiological observations such as the one reported here brings new hopes for making progress in understanding psychosis.
Acknowledgements
This work was funded by Medical Research Council Grant G0601442. L. Palaniyappan is supported by the Wellcome Trust (Research Training Fellowship WT096002/Z/11/Z). These funding organizations had no further role in study design, in the collection, analysis and interpretation of data, in the writing of the report, and in the decision to submit the paper for publication. We thank Drs Bert Park, Debasis Das and Raj Dangi for assistance with clinical recruitment and diagnostic consensus.
Declaration of Interest
L. Palaniyappan received a travel fellowship sponsored by Eli Lilly in 2011. In the past 5 years, P. F. Liddle has received honoraria for academic presentations from Janssen-Cilag and Bristol–Myers Squibb; and has taken part in advisory panels for Bristol–Myers Squibb.