Introduction
Kenaf (Hibiscus cannabinus L.) is a fibre plant native to east-central Africa where it has been grown for several thousand years (LeMahieu et al., Reference LeMahieu, Oplinger and Putnam1991). According to Dempsey (Reference Dempsey1975), kenaf is a short-day, annual herbaceous plant cultivated for the soft bast fibre in its stem. Kenaf grows in tropical and temperate climates and thrives with abundant solar radiation and high rainfall. Under good conditions, kenaf can grow to a height of 5–6 m in 6–8 months and produce up to 30 t/ha of dry stem material (Wood, Reference Wood1998). The crop is poised to be introduced as a new, annually renewable source of industrial fibre in developed economies (Taylor, Reference Taylor1998).
The identification of kenaf varieties based on morphological and agronomic characters is problematic due to limited variation. Most kenaf accessions have red or green stems, yellow flowers, entire or palmate shape leaves and they are late maturing (Siepe et al., Reference Siepe, Ventrella and Lapenta1997; Cheng et al., Reference Cheng, Lu, Sameshima, Fu and Chen2004). In addition, the understanding of relationships between kenaf germplasm is still very limited. These factors have significantly hindered the effective utilization and conservation of genetic resources (Cheng et al., Reference Cheng, Lu, Sameshima, Fu and Chen2004). Cheng et al. (Reference Cheng, Lu, Baldwin, Sameshima and Chen2002) indicated that RAPD (random amplified polymorphic DNA) analysis was able to identify kenaf varieties and determine their genetic relationships to a certain extent, but the genetic basis of the accessions used was narrow, and the number of DNA polymorphisms low. In order to accumulate more informative molecular data and to determine diversity and genetic relationships of kenaf germplasm worldwide, Cheng et al. (Reference Cheng, Lu, Sameshima, Fu and Chen2004) applied AFLP fingerprinting, and showed that it was more effective than RAPD analysis in distinguishing kenaf varieties. The aim of the present research was to fingerprint 19 kenaf accessions using AFLP analysis and to determine genetic relationships between them.
Materials and methods
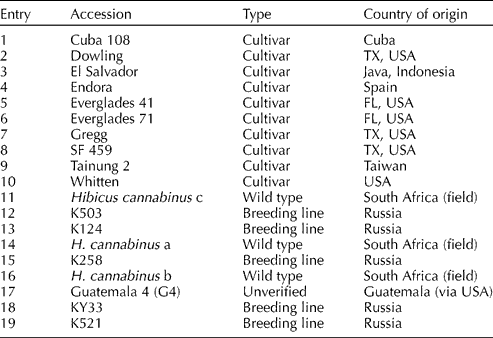
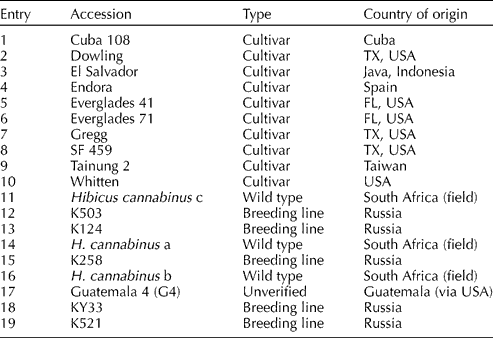
In total, 19 accessions (Table 1) were studied. Two plants per accession were grown in 8 l pots, containing red soil (Bainsvlei soil type), under standard glasshouse conditions at the University of the Free State, during January through May, which is close to the normal growing season for kenaf in South Africa. The days are long in January, and become shorter towards harvesting. The temperature was set at 20°C night and 26°C day.
Nineteen kenaf accessions used for genetic analysis
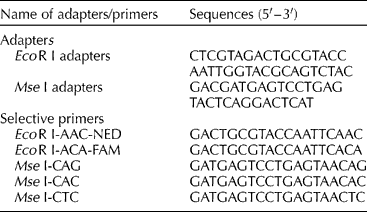
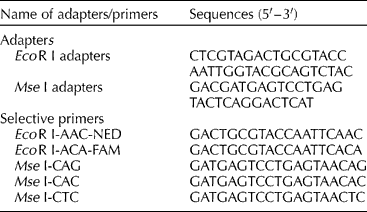
DNA was extracted from fresh young leaves using a modified monocot extraction protocol (Edwards et al., Reference Edwards, Johnstone and Thompson1991). A representative sample of each accession was obtained by isolating DNA from leaves of two plants. DNA quality and quantity were determined by measuring absorbance at 260 and 280 nm. AFLP analysis, based on six primer combinations, was performed as described by Vos et al. (Reference Vos, Hogers, Bleeker, Reijans, Van de Lee, Hornes, Frijters, Pot, Peleman, Kuiper and Zabeau1995), using the Life Technologies Inc. (GIBCO BRL, Gaithersburg, MD, USA) manufacturer's protocol. Adapter and primer sequences used are given in Table 2. AFLP fragments were analysed using GeneScan® software (Perkin Elmer Biosystems, Foster City, CA, USA).
Adapters and primers used for AFLP analysis of 19 kenaf accessions
AFLP data were scored as present (1) or absent (0). All reproducible fragments, above a threshold fluorescence intensity of 35, were scored using a minimum peak height of 100. Genotypic data were used to calculate pairwise genetic distances, which were expressed as the complement of Dice's (Reference Dice1945) coefficient. Estimates of similarity between accessions were based on the probability that an amplified fragment from one accession will also be present in another. Associations among the 19 accessions were determined from cluster analysis based on the genetic estimates. The UPGMA (unweighted pairgroup method using arithmic averages) clustering method was used for hierarchical clustering (NTSYS-pc v2.02i, Exeter software, Sekauket, New York, USA). Dendrograms were created using the SAHN program and goodness of fit of clustering to data matrices were calculated using COPH and Mixcomp programs.
Results
The AFLP analysis generated 406 fragments of which 229 (56.4%) were polymorphic. A minimum number of 32 (primer combination EcoR I-AAC/Mse I-CAG) and a maximum of 49 (EcoR I-ACA/Mse I-CAG) polymorphic fragments per primer combination were observed. All 19 kenaf accessions were distinguishable from one another on the basis of their AFLP profile generated by any one of the primer combinations.
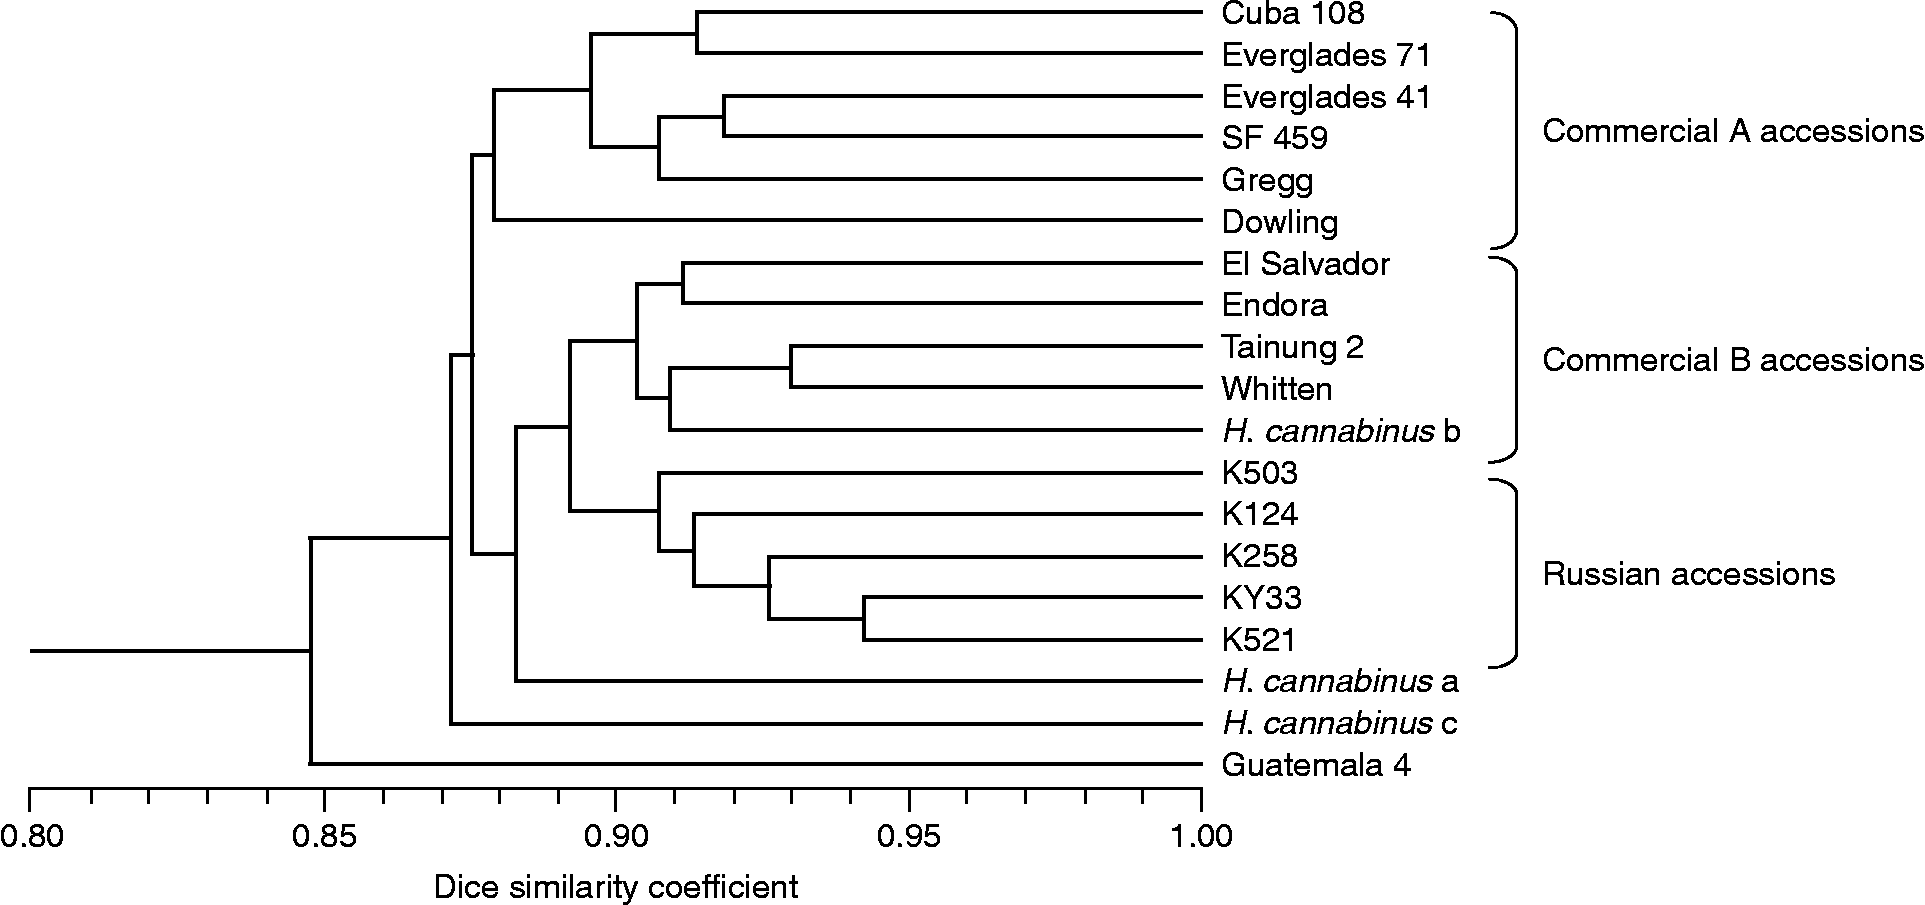
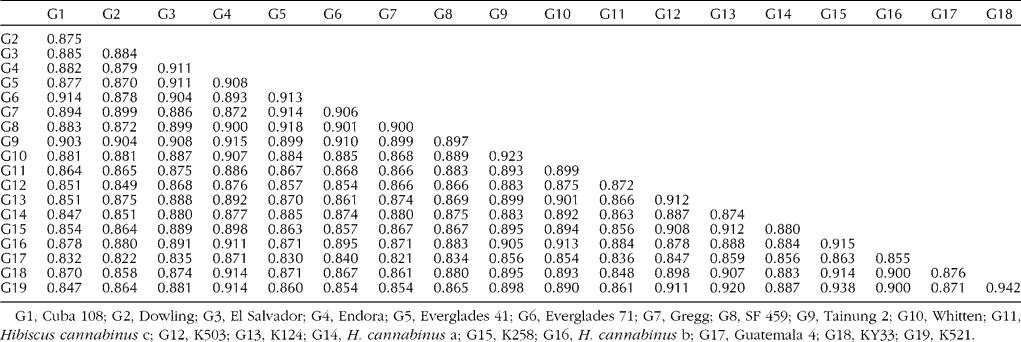
A dendrogram constructed using Dice's coefficient of similarity and the UPGMA clustering method is given in Fig. 1. Guatemala 4, H. cannabinus c and the wild H. cannabinus a grouped separately from the rest of the accessions. The other 16 accessions clustered into two main groups. The first consisted of six commercial accessions (commercial group A, Fig. 1). Everglades 41 and Everglades 71 were 91% similar and SF 459 and Gregg 90% similar (Table 3). Similarity coefficients ranged from 88 to 92% for this group (Table 3). The second group was split into two subgroups, one containing four commercial accessions and one wild type (commercial group B, Fig. 1), and the other containing five Russian accessions (Fig. 1). Tainung 2 was 93% similar to Whitten, with genetic distances ranging from 91 to 94% (Table 3). Guatemala 4 was genetically the most distinct accession with a genetic similarity of 85% to the other accessions. The genetic similarity across all the varieties ranged from 84 to 94%. The closest related varieties using Dice's coefficient were KY33 and K521 with a genetic similarity of 94% (Table 3).
Dendrogram based on AFLP data constructed for 19 kenaf accessions, using Dice's coefficient of similarity and UPGMA clustering.

Genetic distances between the 19 kenaf accessions obtained using Dice similarity coefficient
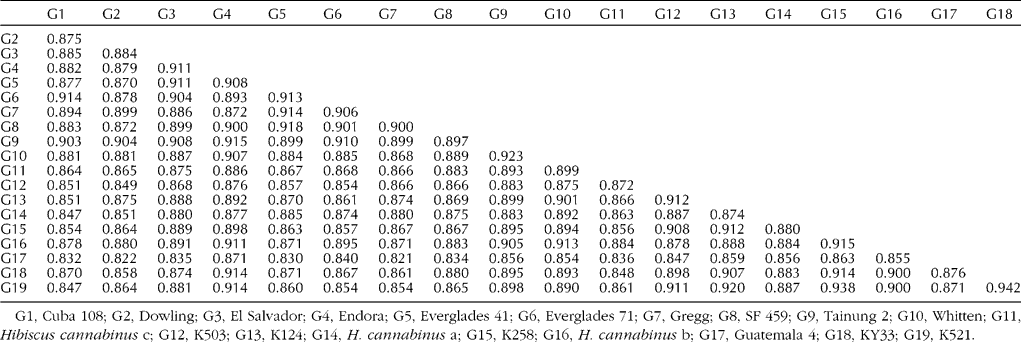
G1, Cuba 108; G2, Dowling; G3, El Salvador; G4, Endora; G5, Everglades 41; G6, Everglades 71; G7, Gregg; G8, SF 459; G9, Tainung 2; G10, Whitten; G11, Hibiscus cannabinus c; G12, K503; G13, K124; G14, H. cannabinus a; G15, K258; G16, H. cannabinus b; G17, Guatemala 4; G18, KY33; G19, K521.
Discussion
According to Dempsey (Reference Dempsey1975), Cuba 108 was a less spiny selection of Cubano (a spiny selection from accession El Salvador). Everglades 41 and Everglades 71 were very similar, as both accessions were developed in Florida (USA) and are selections from the accession El Salvador (USDA, 2004). SF 459 and Gregg were also 90% similar as both accessions have their origin in Texas (USA). SF 459 was developed during mass selection from the strain 45-9 (Cook and Scott, Reference Cook and Scott1995). Gregg was developed from a cross between SF 459 and germplasm line 15 (Cook and Scott, Reference Cook and Scott2000b). Dowling was 90% similar to Gregg and has its origin in Texas. Dowling was developed through a cross between Everglades 41 and an unnamed germplasm line (Cook and Scott, Reference Cook and Scott2000a).
El Salvador is probably the oldest commercial accession and was developed in Java (Indonesia) in 1942 (Crane and Acuna, Reference Crane and Acuna1945). It is a heterogeneous mixture of at least two varieties, about 75% ‘vulgaris’ (palmate leaf) and 25% ‘virdis’ (cordate leaf). El Salvador is the parent to most Cuban and Taiwanese types (Dempsey, Reference Dempsey1975). Tainung 2 was developed in Taiwan and is a strain selected from Tainung 1 (selected from cultivar El Salvador; USDA, 2004). Tainung 2 was 93% (Table 3) similar to Whitten, a selection from the segregating array of a cross of Everglades 41 and a selection of Guatemala 45 (Baldwin et al., Reference Baldwin, Hollowell, Mosley and Cossar2006). The Russian accessions in the second subgroup are of unknown pedigree. Guatemala 4 was genetically the most distinct accession and was developed in Guatemala from relatively simple crosses. One parent was the somewhat photo-insensitive, entire leaf, red stem ‘Tingo Maria’ (var. ‘simplex’) and the other parent was El Salvador (Dempsey, Reference Dempsey1975).
The accessions clustered more or less according to known pedigree and/or origin data. Two of the three wild types (H. cannabinus c and H. cannabinus a) clustered separately from the commercial and Russian accessions. One of the wild types, H. cannabinus b clustered with some of the commercial cultivars. This may be because kenaf is a relatively new breeding crop and some of the cultivars could recently have been developed from the wild types. The ploidy number of the cultivated and wild types is the same, enabling cross-pollination between cultivated and wild types. The commercial A accessions in the first subgroup all originated from central and North America, and surrounding islands (Texas, Cuba and El Salvador). The Russian accessions all grouped together. The commercial B accessions' subgroup was the only group that contained accessions from different geographical origins.
Morphological characters have provided very limited information for varietal identification of kenaf germplasm (Deng et al., Reference Deng, Li and Li1994; Siepe et al., Reference Siepe, Ventrella and Lapenta1997; Cheng et al., Reference Cheng, Lu, Baldwin, Sameshima and Chen2002). On the contrary, AFLP analysis has provided a reliable molecular tool for the identification of kenaf accessions, although relatively low genetic diversity was found. Results from this study confirmed results obtained by Cheng et al. (Reference Cheng, Lu, Sameshima, Fu and Chen2004), which also detected low levels of genetic diversity. Kenaf occurs naturally in Africa, and wild types have been found to have the same ploidy level as commercial kenaf. These sources should be introduced to increase genetic diversity in this crop.
To conclude, AFLP analysis was successful in detecting genetic diversity and determining genetic relationships among 19 kenaf accessions. All the accessions could be uniquely distinguished from one another. A low level of genetic diversity was detected, even though three wild-type accessions were included. The most distinct accession, Guatemala 4, was still 85% similar to all other accessions.