1 Introduction
Understanding the outcome of self-interested adaptive play is a fundamental question of game theory. At the same time understanding systems that arise from coupling numerous intelligent agents together is central to numerous other disciplines such as distributed optimization, artificial intelligence and robotics.
To take the example of a multi-agent system, the problem of routing a large number of agents with repeated interactions offers agents the opportunity to learn from these interactions. In particular, we investigate how much can be gained from the process of learning, synthesized in a ratio which we call the value of learning (VoL). The reverse is also considered: what agents risk by following no-regret learning procedures, the price of learning (PoL).
The rich literature of multi-agent studies and algorithmic game theory typically focus on equilibria and their properties. Since games may have multiple Nash equilibria (NE), two approaches have been developed: one focusing on worst case guarantees, known as price of anarchy (Koutsoupias & Papadimitriou, Reference Koutsoupias and Papadimitriou1999), and one focusing on best-case equilibria known as price of stability (Anshelevich et al., Reference Anshelevich, Dasgupta, Kleinberg, Tardos, Wexler and Roughgarden2004). Defined as the ratio between the social cost at the worst NE and the optimum, price of anarchy captures the worst possible loss in efficiency due to individual and self-interested decision-making. On the other hand, price of stability compares the social cost of the optimal Nash against the optimum.
Both approaches depend on the assumption that the agents converge to an equilibrium in the first case. Indeed, classical learning dynamics such as the replicator dynamics do not necessarily converge to a NE (Sandholm, Reference Sandholm2010). That assumption is then weakened to merely asking that the agents’ adaptive behavior meets some performance benchmark, such as low regret (Young, Reference Young2004). An online optimization algorithm is said to exhibit vanishing regret when its time average performance is roughly at least as large as the best fixed action with hindsight.
Contrasting best case equilibria versus best case learning seems to be completely unexplored despite being a rather natural way to quantify the benefits of improving the design of our current learning mechanisms. On the other hand, worst case bounds such as the price of anarchy are known for several classes of games to extend automatically to the class of no-regret learning behavior (Roughgarden, Reference Roughgarden2009). This implies that those worst case games are equally bad both for worst case NE as well as for worst case learning behavior. Nevertheless, this does not mean that for individual games there cannot be significant gaps between the worst case performance of no-regret dynamics and NE. The existence and size of such gaps for typical games are not well understood.
1.1 Our results
We study the limits and limitations of no-regret learning dynamics in games. We start by designing a protocol such that in isolation each such algorithm exhibits vanishing regret against any opponent while at the same time converging to NE in self-play in any normal form game. This result establishes that no-regret guarantees do not pose in principle a fundamental obstacle to system equilibration.
We establish a strong equivalence between the time average behavior of no-regret dynamics in games and coarse correlated equilibria (CCE) which is a relaxation to the notion of correlated equilibria (CE). Specifically, given any infinite history of play in a game and any time T, we can sample uniformly at random any of the first T outcomes, forming the empirical distribution of play. It is textbook knowledge that for all normal form games and no-regret dynamics the distance of this time average distribution from the set of CCE converges to 0 as T grows (Young, Reference Young2004). We complement this result by establishing an inclusion in the reverse direction as well. Given any CCE we can construct a tuple of no-regret dynamics whose time average distribution converges pointwise to it as T grows. Hence in any normal form game, understanding best/worst case no-regret dynamics reduces to understanding best/worst case CCE.
In the second part of the paper we exploit this reduction to argue properties about best/worst case no-regret learning dynamics in different classes of games. For non-atomic congestion games, Blum et al. (Reference Blum, Hajiaghayi, Ligett and Roth2010), shows that regret-minimizing algorithms lead to histories of play where on most days the realized flow is an approximate Nash.
We provide a shorter, more intuitive argument that extends to the case of many but small agents by exploiting the connection to CCE. Specifically, we show that for all atomic congestion games as we increase the number of agents/decrease the amount of flow they control, any CCE concentrates most of its probability mass on states where all but a tiny fraction of agents have a small incentive to deviate to another strategy. The uniqueness of the cost of equilibrium flow at the limit implies that for these games the set of NE coincides with the set of CCE.
The picture gets completely reversed when we focus on games with few agents. We define PoL as the ratio between the worst case no-regret learning behavior and the worst case Nash, whereas the VoL compares best case learning behavior to best case Nash. For the class of 2×2 (cost minimization) games PoL is at most two and this bound is tight, whereas VoL is at least 3/2 and we conjecture that this bound is tight as well. Both PoL and VoL become unbounded for slightly larger games (e.g. 2×3).
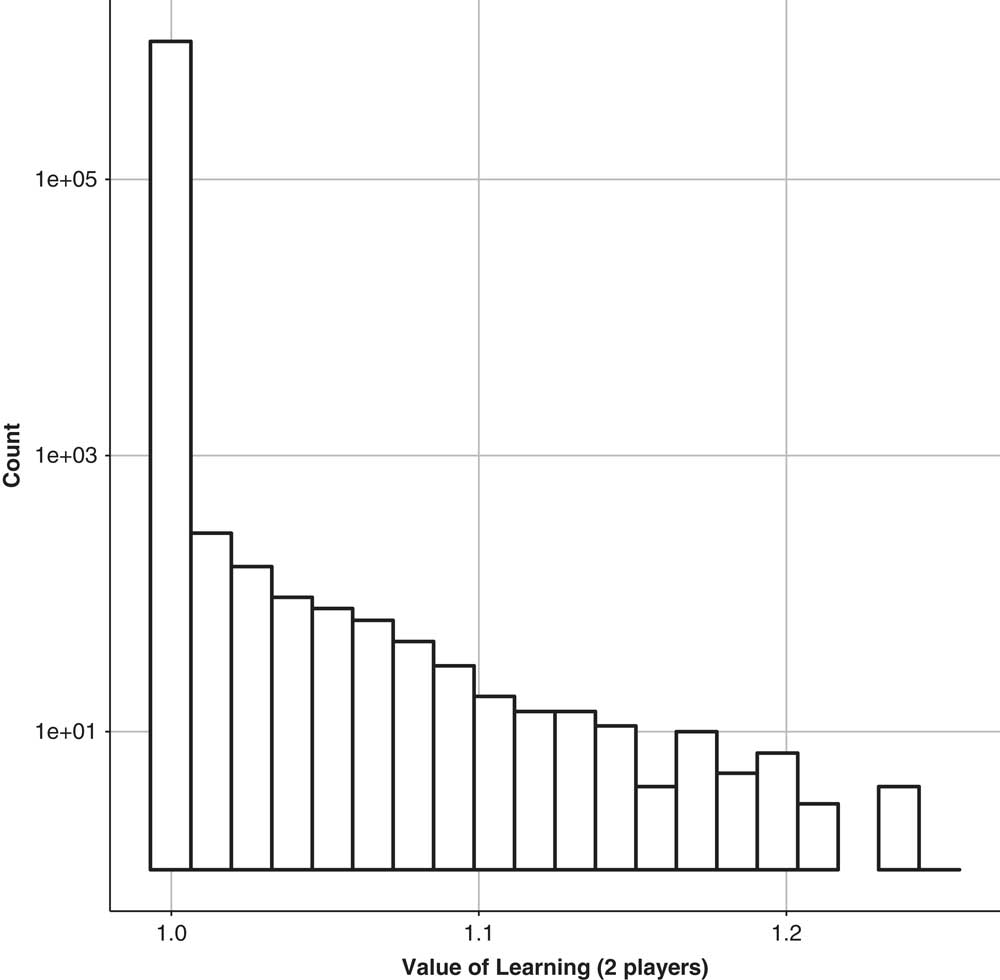
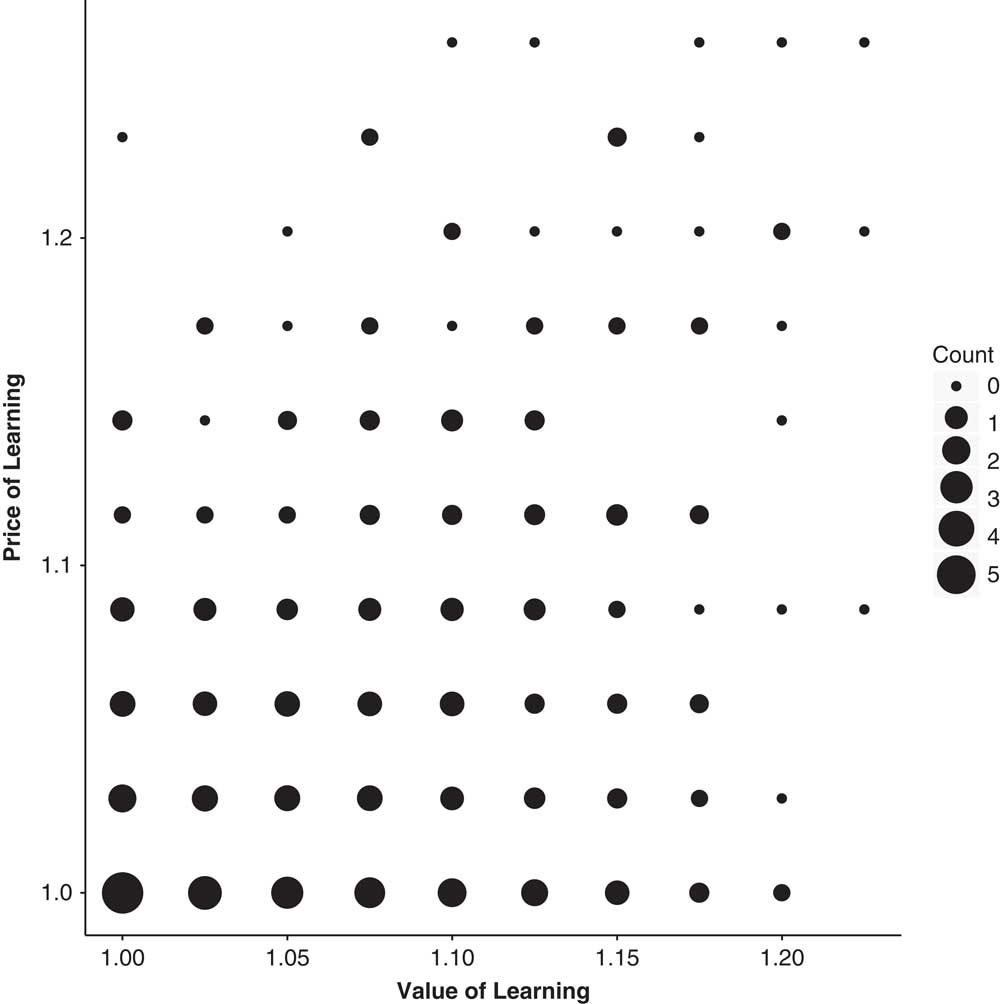
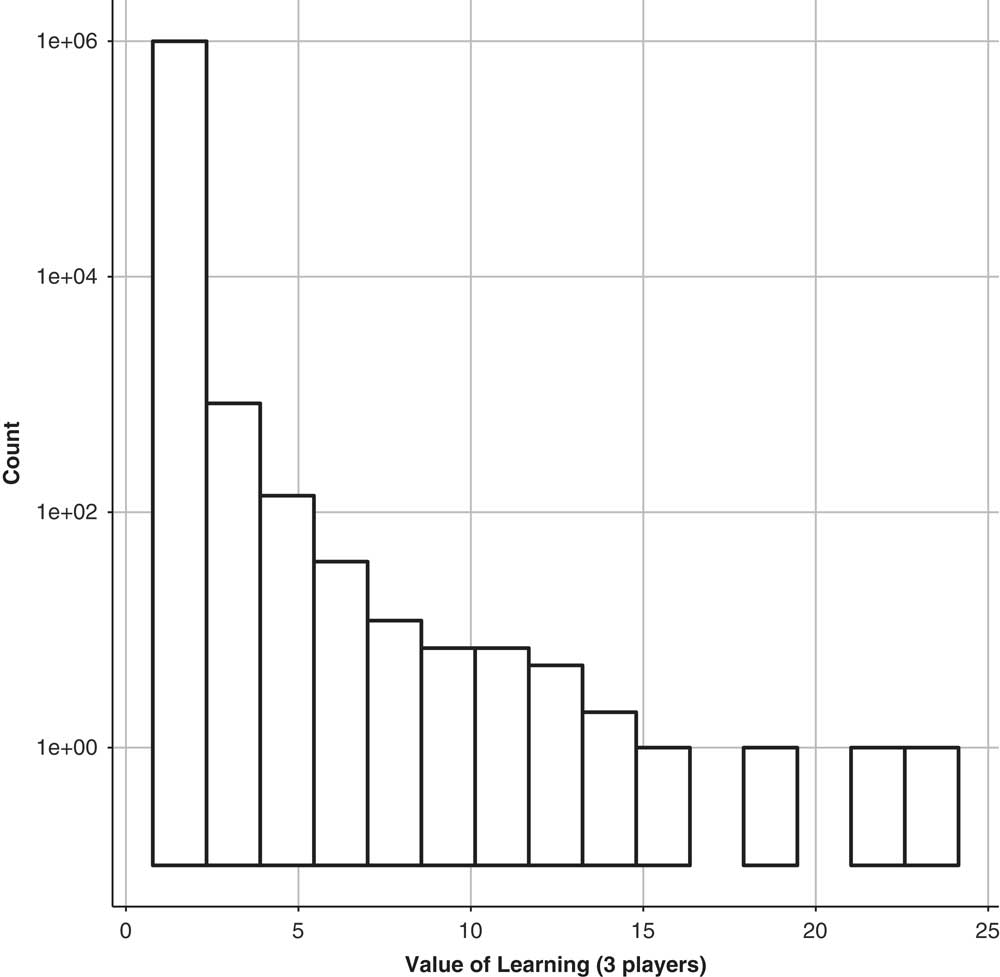
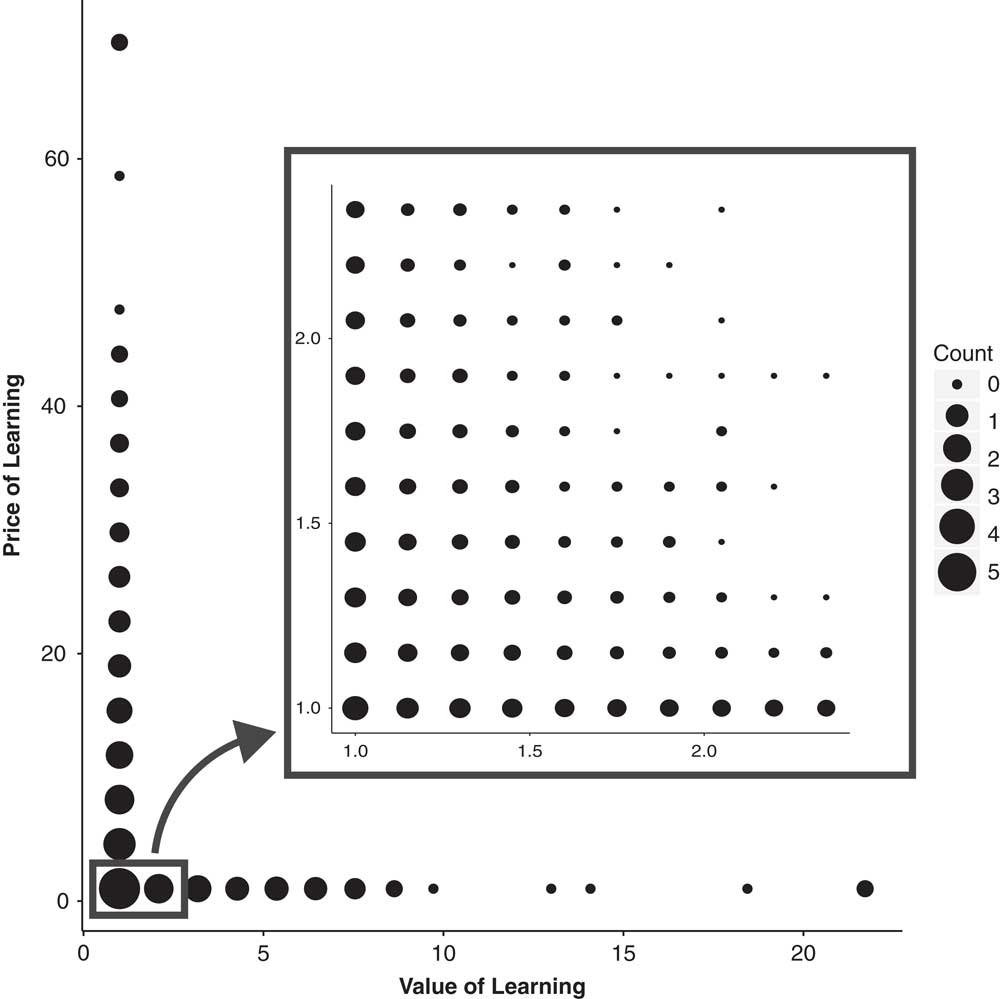
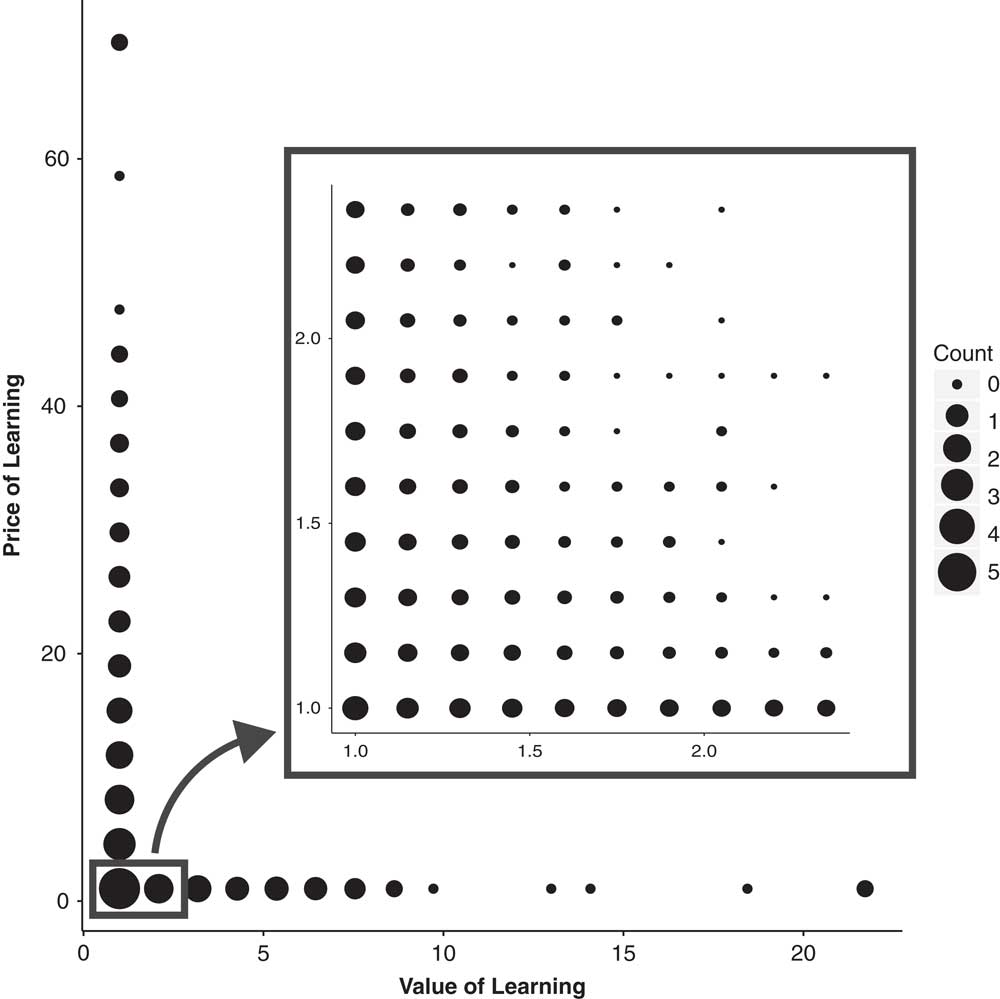
We conclude the paper with experimentation where we compute the PoL and VoL for randomly generated games. We find a high number of games possess a PoL or VoL equal to 1, indicating no improvement or degradation when moving from NE to CCE. The frequency of higher ratios decreases sharply with their value, akin to a power-law distribution. Higher values are obtained for 3×3 games due to the unboundedness results proved in Section 7. When plotted against each other, PoL and VoL reveal a strong anti-correlation effect. High PoL is suggestive of low VoL and vice versa. Understanding the topology of the Pareto curve on the space of (PoL, VoL) could quantify the tradeoffs between the risk and benefits of learning.
2 Related work
2.1 Convergence to Nash equilibria and no-regret dynamics
No-regret dynamics in games are central to the field of game theory and multi-agent learning (Shoham et al., Reference Shoham, Powers and Grenager2007). Our protocols improve upon prior work that established convergence only in 2×2 games (Bowling, Reference Bowling2005). These dynamics do not converge in polynomial time, for good reason. Complexity results strongly indicate that no such fast dynamics exist for general games (Hart & Mansour, Reference Hart and Mansour2007; Daskalakis et al., Reference Daskalakis, Goldberg and Papadimitriou2009). Instead, this is a characterization result studying the tension between achieving no-regret guarantees and equilibration.
Brafman and Tennenholtz (Reference Brafman and Tennenholtz2004) introduce a normative approach to learning in games where the learning algorithms themselves are required to be in equilibrium . That is, a deviation from the learning algorithm by a single agent (while the others stick to their algorithms) will eventually (after polynomial number of steps) become irrational. On the other hand, if all agents stick to their prescribed learning algorithms then the expected payoff obtained by each agent will after polynomial number of steps be (close to) the value it could have obtained in a NE, had the agents known the game from the outset.
The AWESOME learning procedure (Conitzer & Sandholm, Reference Conitzer and Sandholm2007) also leads to convergence to NE of the one-shot game. It presents the same concept of increasing periods of time after which the algorithm ‘forgets’ and restarts. A probabilistic bound akin to Hoeffding—Chebyshev—is used to tune the length of these periods. Our algorithm differs in that the learning happens over the first three stages, while the last one is simply an implementation of the NE.
Repeated games often employ tit-for-tat strategies to enforce higher payoffs (Littman & Stone, Reference Littman and Stone2005), a concept that appears in the algorithm of Section 4. But where we focus on achieving a NE of the one-shot game, repeated games exhibit a larger set of enforceable NE following the so-called Folk theorem (Friedman, Reference Friedman1971).
The ‘weak’ convergence of time average no-regret dynamics to the set of CCE (Young, Reference Young2004) has been useful in terms of extending price of anarchy (Roughgarden, Reference Roughgarden2009) guarantees from NE to no-regret learning, which is usually referred to as the price of total anarchy (Blum et al., Reference Blum, Even-Dar and Ligett2008). Our equivalence result reduces the search for both best/worst case no-regret dynamics to a search over CCE which define a convex polytope in the space of distributions over strategy outcomes. Similar results can be proven for calibrated forecasting rules in almost every game (Foster & Vohra, Reference Foster and Vohra1997). Our conclusions extend easily to no-internal-regret algorithms and CE, using Φ-regret (Greenwald & Jafari, Reference Greenwald and Jafari2003), which encompasses both no-internal and no-external regret.
2.2 No-regret in congestion games
In non-atomic congestion games regret-minimizing algorithms lead to histories of play where on most days the realized flow is an approximate equilibrium (Blum et al., Reference Blum, Hajiaghayi, Ligett and Roth2010). In atomic congestion games general no-regret dynamics do not converge to NE. If we focus on specific no-regret dynamics such as multiplicative weight updates, equilibration can be guaranteed (Kleinberg et al., Reference Kleinberg, Piliouras and Tardos2009, Reference Kleinberg, Piliouras and Tardos2011; Palaiopanos et al., Reference Palaiopanos, Panageas and Piliouras2017). Our findings establish a hybrid. In atomic congestion games as the size of individual agents decreases, the set of CCE focuses most of its probability mass on states where all but a tiny fraction of agents have a small incentive to deviate to another strategy. When the size of each agent becomes infinitesimally small, CCE become arbitrarily focused on the unique non-atomic Nash flow.
2.3 Equilibrium hierarchy and inefficiency ratios
In the case of utility games, two different social welfare ratios were introduced: the value of mediation defined as the ratio between the best CE and the best NE and the value of enforcement, which compares the worst CE to the worst NE (Ashlagi et al., Reference Ashlagi, Monderer and Tennenholtz2008). The value of mediation is shown to be a small constant for 2×2 games while the value of enforcement is unbounded, and they both are unbounded for larger games. Parallel results were obtained for cost games (negative utility) (Bradonjic et al., Reference Bradonjic, Ercal-Ozkaya, Meyerson and Roytman2009), the setting we adopt in this study. It is NP-hard to compute a CCE with welfare strictly better than the lowest-welfare CCE (Barman & Ligett, Reference Barman and Ligett2015). As a result our experimentation focuses on small instances but nevertheless reveals a tension between the risks and benefits of learning.
3 Preliminaries
Let I be the finite set of players of the game Γ. Each player i∈I has a finite strategy set S i and a cost function c i : S i ×S −i → [0, 1], where S −i =Π j≠i S j . A player i∈I may choose his strategy from his set of mixed strategies Δ(S i ), that is the set of probability distributions on S i . We extend the cost function’s domain to the mixed strategies naturally, following the linearity of expectation.
Definition 3.1.
A NE is a vector of distributions
 $$\left( {p_{i}^{{\asterisk}} } \right)_{{i \in I}} \in \prod \nolimits_{i \in I} \Delta \left( {S_{i} } \right)$$
such that ∀i∈I,∀p
i
∈Δ(S
i
):
 $$c_{i} \left( {p_{i}^{{\asterisk}} ,\,p_{{{\minus}i}}^{{\asterisk}} } \right)\, \les \,c_{i} \left( {p_{i} ,\,p_{{{\minus}i}}^{{\asterisk}} } \right)$$
An ϵ-NE for ϵ>0 is one such that
 $$c_{i} (p_{i}^{{\asterisk}} ,p_{{{\minus}i}}^{{\asterisk}} )\, \les \,c_{i} (p_{i} ,p_{{{\minus}i}}^{{\asterisk}} ){\plus}{\epsilon}$$
This notion of equilibrium comes with a few caveats. First, a game may possess several distinct NE. Second, computing a NE is hard (Daskalakis et al., Reference Daskalakis, Goldberg and Papadimitriou2009). Third, in general, it is also not the case that learning procedures in a game always converge to a NE (Sandholm, Reference Sandholm2010). Thus, subsequent efforts at finding the solution of a game yielded two new concepts: the CE and the CCE, fixing caveats two and three. Caveat one is obviously still an issue since the set of NE is a subset of the set of CE, itself a subset of the set of CCE. We defer further comparisons between the different equilibrium concepts until Section 7.
We first give the definition of a CE (Aumann, Reference Aumann1974).
Definition 3.2.
A CE is a distribution π over the set of action profiles S=
 $$\prod_i $$
S
i
such that given any player i and pair of distinct strategies s
i
, s'
i
∈S
i
, s
i
≠s′
i
,
 $$\mathop{\sum}\limits_{s_{{{\minus}i}} \in S_{{{\minus}i}} } c_{i} (s_{i} ,s_{{{\minus}i}} )\pi (s_{i} ,s_{{{\minus}i}} )\, \les \, \mathop{\sum}\limits_{s_{{{\minus}i}} \in S_{{{\minus}i}} } c_{i} (s\prime\!\!_{i} ,s_{{{\minus}i}} )\pi (s_{i} ,s_{{{\minus}i}} )$$
Given now is the definition of CCE (Young, Reference Young2004).
Definition 3.3.
A CCE is a distribution π over the set of action profiles S=
 $$\prod_i $$
S
i
such that given any player i and any strategy s
i
∈S
i
,
 $$\mathop{\sum}\limits_{s \in S} c_{i} (s)\pi (s)\, \les \! \mathop{\sum}\limits_{s_{{{\minus}i}} \in S_{{{\minus}i}} } c_{i} (s_{i} ,s_{{{\minus}i}} )\pi _{i} (s_{{{\minus}i}} )$$
where
 $$\pi _{i} (s_{{{\minus}i}} )\, {\equals}\, \mathop{\sum}\nolimits_{s_{i} \in S_{i} } \pi (s_{i} ,s_{{{\minus}i}} )$$
is the marginal distribution of π with respect to i.
The next definitions outline a framework to what ‘learning’ means for agents involved in a game. They stem from the literature of online algorithms, where an agent with a restricted set of actions repeatedly makes choices that yield a certain payoff.
An online learning algorithm is an online algorithm for choosing a sequence of elements of some fixed set of actions, in response to an observed sequence of cost functions mapping actions to real numbers. The tth action chosen by the algorithm may depend on the first t−1 observations but not on any later observations; thus the algorithm must choose an action at time t without knowing the payoffs of any actions at that time. More formally,
Definition 3.4. An online sequential problem consists of a feasible set F∈R m , and an infinite sequence of cost functions {c 1, c 2 ... ,}, where c t :R m → R.
At each time step t, an online algorithm selects a vector x t ∈R m . After the vector is selected, the algorithm receives f t , and collects a payoff of f t (x t ). All decisions must be made online, in the sense that an algorithm does not know f t before selecting x t , that is, at each time t, a (possibly randomized) algorithm can be thought of as a mapping from a history of functions up to time t, f 1, … , f t−1, to the set F.
Given an algorithm A and an online sequential problem (F,{c
1, c
2, … }), if {x
1, x
2, … } are the vectors selected by A, then the cost of A until time T is
 $$\mathop{\sum}\nolimits_{t\, {\equals}\, 1}^T c^{t} (x^{t} )$$
. Regret compares the performance of an algorithm with the best static action in hindsight.
Definition 3.5. The regret of algorithm A at time T is defined as
 $$R(T)\, {\equals}\, \mathop{\sum}\limits_{t\, {\equals}\, 1}^T c^{t} (x^{t} ){\minus}\mathop {\min }\limits_{x \in F} \mathop{\sum}\limits_{t\, {\equals}\, 1}^T c^{t} (x)$$
An algorithm is said to have no-regret or that it is Hannan consistent (Young, Reference Young2004), if for every online sequential problem, its regret at time T is o(T). For the context of game theory, which is our focus here, the following definition of no-regret learning dynamics suffices.
Definition 3.6. The regret of agent i at time T is defined as
 $$R(T)\, {\equals}\, \mathop{\sum}\limits_{t\, {\equals}\, 1}^T c_{i} (s^{t} ){\minus}\mathop {\min }\limits_{s'_{i} \in S_{i} } \mathop{\sum}\limits_{t\, {\equals}\, 1}^T c_{i} (s'_{i} ,s_{{{\minus}i}}^{t} )$$
We will also make use of Hoeffding’s (Reference Hoeffding1963) inequality.
Theorem 3.1
Suppose
 $$(X_{k} )_{{k\, {\equals}\, 1}}^{n} $$
are independent random variables taking values in the interval [0, 1]. Let Y denote the empirical mean
 $$Y\, {\equals}\, {1 \over n}\mathop{\sum}\limits_{k\, {\equals}\, 1}^n X_{k} $$
. Then for t>0
 $${\Bbb P}\left( {\left| {Y{\minus}{\Bbb E}[Y]} \right|\, \ges \, t} \right)\, \les \, 2\,\exp \,({\minus}2nt^{2} )$$
4 No-regret dynamics converging to Nash equilibrium in self-play
A key question of interest when analyzing extremal behavior of no-regret dynamics in general games is whether there exists a hidden implicit tension between achieving no-regret guarantees against malicious agent behavior while at the same time converging to NE in self-play. The following theorem establishes that this is not the case:
Theorem 4.1. In a finite game with N players, for any ϵ>0, there exist learning dynamics that satisfy simultaneously the following two properties:
-
∙ Against arbitrary opponents their average regret is at most ϵ.
-
∙ In self-play they converge pointwise to a ϵ-NE with probability 1.
Proof . We divide the play in four stages. In the first stage, players explore their strategy space sequentially and learn the costs obtained from every action profile. In the second stage, they communicate their costs, using a procedure akin to cheap talk (Aumann & Hart, Reference Aumann and Hart2003). For example, they can use their actions as encoders for the payoffs previously revealed during the exploration stage, and transmit the knowledge they gained then to the other players. In the third stage, they compute the desired ϵ-NE that is to be reached, for ϵ>0. In the fourth stage, players are expected to use their equilibrium strategies and they monitor other players in case these deviate from equilibrium play. Below the proof, we give a pseudocode version of the algorithm implemented by the players, to summarize the four stages (in Algorithm 4).
The players are expected to follow a communication procedure and implement a no-regret strategy in the case of another player’s deviation. Since the first three stages have finite length (though very long: exponential in the size of the cost matrix (Hart & Mansour, Reference Hart and Mansour2007)), the no-regret property follows. The restriction on convergence to an ϵ-NE, instead of a mixed NE (so ϵ=0) arises from the fact that even games with rational costs can possess equilibria that are irrational (Nash, Reference Nash1951).
Settlement on a particular NE can be decided by a fixed rule before play, such as lexicographically in the players’ actions or the NE that has the lowest social cost.
In the fourth stage, players have settled on an equilibrium and will implement it. To fulfill the requirement of pointwise convergence, it is not enough for the players to stick to a deterministic sequence of plays. We want them to pick randomly a move from their equilibrium distribution of actions. During this process, the generated sequence of play of an opponent may not closely match his equilibrium distribution. In that case, the players need to decide whether the opponent has been truthful but ‘unlucky’ or deliberately malicious.
We achieve this by dividing the fourth stage in blocks of increasing length. Let
 $$n \in {\Bbb N}$$
denote the block number, we set block n to have a length of l(n)=n
2 turns. On these blocks, the players will make use of tests to verify that all other opponents are truthful, in the sense that they follow the prescribed mixed NE. We want to find a test such that a truthful but possibly unlucky player will fail almost surely a finite number of these tests, while a malicious player will almost surely fail an infinite number of these.
We first look at the case where we have N players with only two strategies, 0 and 1. We can then identify the equilibrium distribution of a player i, to the probability
 $$p_{i}^{{\asterisk}} $$
that he chooses action 1.
Suppose the play is at the nth block and player i chooses to implement the mixed strategy p
i
. Let
 $$\left( {X_{k}^{i} } \right)_{{k\, {\equals}\, 1,...,l(n)}} $$
denote the sequence of strategies chosen by player i, such that
 $$X_{k}^{i} \,\sim\,{\cal B}(p_{i} )$$
and all are independent. Let
 $$Y_{n}^{i} $$
be the empirical frequency of strategy 1 during block n:
 $$Y_{n}^{i} \, {\equals}\, {1 \over {l(n)}}\mathop{\sum}\limits_{j\, {\equals}\, 1}^{l(n)} X_{j}^{i} $$
If the player is truthful and implements the prescribed NE, then we have
 $$p_{i} \, {\equals}\, p_{i}^{{\asterisk}} $$
and we expect the empirical frequency of strategy 1
 $$Y_{n}^{i} $$
to be close to
 $$p_{i}^{{\asterisk}} $$
. Otherwise, a malicious player will choose
 $$p_{i} \,\ne\,p_{i}^{{\asterisk}} $$
.
Let
 $$A_{n}^{i} $$
denote the event
 $$A_{n}^{i} \, {\equals}\, \left\{ {\left| {Y_{n}^{i} {\minus}p_{i}^{{\asterisk}} } \right|\, \ges \, t_{n} } \right\}$$
. In other words, we are trying to determine how far the empirical frequency of strategy 1 is from the expected equilibrium distribution. If the event
 $$A_{n}^{i} $$
is realized, then the test is failed: the empirical distribution of play is too far from the expected NE distribution. The idea is to make block after block the statistical test more discriminating, that is get a decreasing sequence (t
n
)
n
such that a truthful player will only see a finite number of events
 $$A_{n}^{i} $$
happen, while a malicious one will face an infinite number of failures.
We claim that picking t n =n −α with 0<α<1 is enough. Indeed by Hoeffding’s inequality we have that
 $${\Bbb P}\left( {A_{n}^{i} } \right)\, \les \, 2\,\exp \,\left( {{\minus}2n^{2} t_{n}^{2} } \right)$$
if the player is truthful (remember that block n has length l(n)=n 2).
Extending the proof to the case where a player i has finite strategy set S
i
is not hard. Let
 $$(p_{s}^{i} )_{{s \in S}} $$
be the distribution that the ith player decides to implement, while
 $$\left( {p_{s}^{{i,{\asterisk}}} } \right)_{{s \in S}} $$
is the NE distribution for player i. Let
 $$X_{k}^{{i,s}} $$
follow a multinomial distribution of parameters
 $$(p_{s}^{i} )_{{s \in S}} $$
. Then
 $$Y_{n}^{{i,s}} $$
is the empirical frequency of strategy s during block n for player i. We define events
 $$A_{n}^{{i,s}} \, {\equals}\, \left\{ {\left| {Y_{n}^{{i,s}} {\minus}p_{s}^{{i,{\asterisk}}} } \right|\, \ges \, t_{n} } \right\}$$
Then we define our test
 $$A_{n}^{i} $$
to be
 $${\cup}_{{s \in S_{i} }} A_{n}^{{i,s}} $$
. Using Hoeffding’s inequality again we obtain:
 $$\eqalignno{ {\Bbb P}\left( {A_{n}^{i} } \right)\, {\equals}\, & {\Bbb P}\left( {{\cup}_{{s \in S_{i} }} A_{n}^{{i,s}} } \right) \cr \, \les \, & \mathop{\sum}\limits_{s \in S_{i} } {\Bbb P}\left( {A_{n}^{{i,s}} } \right)\, \les \, \left| {S_{i} } \right|{\times}2\,\exp \,\left( {{\minus}2n^{2} t_{n}^{2} } \right) $$
Thus
 $$\mathop{\sum} {\Bbb P}\left( {A_{n}^{i} } \right)\,\lt\,{\plus} \infty$$
for 0<α<1, so by Borel–Cantelli we know that the
 $$A_{n}^{i} $$
will only ever happen a finite number of times if the player is truthful, that is if
 $${\Bbb E}\left[ {Y_{n}^{{i,s}} } \right]\, {\equals}\, p_{s}^{{i,{\asterisk}}} $$
.
To satisfy the no-regret property, we do the following: if one of the opponents failed the statistical test described earlier, then all players will implement a no-regret strategy for a time n 2+δ to compensate for that. We call this block of size n 2+δ a compensating block.
If a finite number of tests fails, then the whole sequence satisfies the ϵ-regret property, since players are arbitrarily close to the ϵ-NE. When one of the tests fails, say, at block n, the maximum regret accumulated is of size n 2. The following compensating block guarantees that overall regret has grown by a value bounded by n 1−δ , so sublinearly.
We also guarantee that the expected turn number that ends the last of the truthful player’s potential failed block is not infinity. Indeed let B
n
be the event that the last failed block is the nth one. Then, if
 $$A_{n} \, {\equals}\, {\cup}_{{i\, {\equals}\, 1}}^{N} A_{n}^{i} $$
,
 $$\eqalignno{ {\Bbb P}(B_{n} )\, {\equals}\, & {\Bbb P}(A_{n} ){\times}{\Bbb P}\left( {A_{{n{\plus}1}}^{c} } \right)\,\ldots\, \cr \, \les \, & 2\,\exp \left( {{\minus}2n^{2} t^{2} } \right){\times}1\,\ldots\, \cr \, \les \, & 2\,\exp \left( {{\minus}2n^{2} t^{2} } \right) $$
We use A c to denote the complement of event A. The first equality holds by independence of the blocks, the second inequality is true from Hoeffding’s and the fact that a probability is less or equal to 1. We then define L to be the index of the turn that ends the last compensating block of a truthful player. L is a random variable on the integers. We have
 $${\Bbb E}[L]\, \les \, \mathop{\sum}\limits_n \left( {\mathop{\sum}\limits_{k\, {\equals}\, 1}^n \left( {k^{2} {\plus}k^{{2{\plus}\delta }} } \right)} \right){\times}2\,\exp \left( {{\minus}2n^{2} t^{2} } \right)\,\lt\,{\plus}\!\infty$$
We bound
 $${\Bbb E}[L]$$
by assuming a truthful player got every test wrong up to the latest failed one. Then the last turn L occurs at index ∑
n
(n
2+n
2+δ
). We multiply this by the bound on
 $${\Bbb P}(B_{n} )$$
and use the property of the exponential to conclude that
 $${\Bbb E}[L]$$
is bounded.□
5 Equivalence between coarse correlated equilibria and no-regret dynamics
The long-run average outcome of no-regret learning converges to the set of CCE (Young, Reference Young2004). Here, we argue the reverse direction.
Theorem 5.1. Given any CCE C of a normal form game with a finite number of players N and finite number of strategies, there exist a set of N no-regret processes such that their interplay converges to the CCE C.
Proof. Suppose that we are given a CCE C of a N-player gameFootnote 1 . There exists a natural number K, such that all probabilities are multiples of 1/K. We can create a sequence of outcomes V of length K, such that the probability distribution that chooses each such outcome with probability 1/K is identical to the given CCE C. The high level idea is to have the agents play this sequence in a sequential, cyclical manner and punish any observed deviation from it by employing any chosen no-regret algorithm (e.g. Regret Matching).
Let us denote the jth element of this sequence as
 $$\,\lt\,x_{1}^{j} ,x_{2}^{j} ,...,x_{N}^{j} \,\gt\,$$
, where 0⩽j⩽K−1. Each element of this sequence will act as a recommendation vector for the no-regret algorithm. Given the sequence above we are ready to define for each of the N players a no-regret algorithm, such that their interplay converges to the given CCE C.

Algorithm 1: Proof of Theorem 4.1. Players converge to an ϵ-NE in self-play while maintaining no-regret.
The algorithm for the ith player is as follows: at time zero she plays the ith coordinate of the first element in V. As long as the other players’ responses up to any point in time t are in unison with V, that is for every t′<t and j≠i the strategy implemented by player j at time t′ was
 $$x_{j}^{{t'\,\bmod \,K}} $$
then the ith player will follow the recommendation of the sequence V sequence playing
 $$x_{i}^{{t\,\bmod \,K}} $$
. However, as soon as the player recognizes any sort of deviation from V by another player then the player will just disregard any following recommendations coming from V and will merely follow from that point on a no-regret algorithm of her liking.
It is straightforward to check that in self-play this protocol converges to the given CCE C. We need to also prove that all of these algorithms are no-regret algorithms. When analyzing the accumulated regret of any of the algorithms above we split their behavior into two distinct segments. The first segment corresponds to the time periods before any deviation is recorded from the recommendation provided by C. For this segment, the definition of CCE implies that each agent experiences bounded total regret (only corresponding to the last partial sequence of length at most K). Once a first deviation is witnessed by the player in question, she turns to her no-regret algorithm of choice and the no-regret property then follows from this algorithm. As a result, each algorithm exhibits vanishing (average) regret in the long run.□
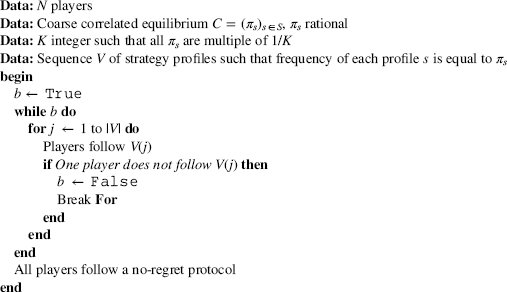
Algorithm 2: Proof of Theorem 5.1.
6 Collapsing equilibrium classes
6.1 Congestion games with small agents
We have a finite ground set of edges E. There exist a constant number k of types of agents and each agent of type i has an associated set of allowable strategies/paths S
i
. S is the set of possible strategy outcomes. Let N
i
be the set of agents of type i. We assume that each agent of type i controls a flow of size 1/|N
i
|, which he assigns to one of his available paths S
i
. This can also be interpreted as a probability distribution over the set of strategies S
i
. Each edge e has a non-decreasing cost function of bounded slope
 $$c_{e} \,\colon\,{\Bbb R}\to{\Bbb R}$$
which dictates its latency given its load. The load of an edge e is
 $$\ell _{e} (s)\, {\equals}\, \mathop{\sum}\nolimits_i {{k_{i} } \over {\left| {N_{i} } \right|}}$$
, where k
i
denotes the number of agents of type i which have edge e in their path in the current strategy outcome. The cost of any agent of type i for choosing strategy s
i
∈S
i
is
 $$c_{{s_{i} }} (s)\, {\equals}\, \mathop{\sum}\nolimits_{e \in s_{i} } c_{e} \left( {\ell _{e} (s)} \right)$$
. In many cases, we abuse notation and write
 $$\ell _{e} ,c_{{s_{i} }} $$
instead of
 $$\ell _{e} (s),c_{{s_{i} }} (s)$$
when the strategy outcome is implied. The social cost, that is, the sum of agents’ costs, is equal to
 $$C(s)\, {\equals}\, \mathop{\sum}\nolimits_e c_{e} (\ell _{e} )\ell _{e} $$
. Finally, it is useful to keep track of the flows going through a path s
i
or an edge e when focusing on agents of a single type i. We denote these quantities as
 $$\ell _{{s_{i} }}^{i} (s)$$
and
 $$\ell _{e}^{i} (s)\, {\equals}\, \mathop{\sum}\nolimits_{s_{i} { \ni}e} \ell _{{s_{i} }}^{i} (s)$$
. For any strategy outcome s and any type i,
 $$\mathop{\sum}\nolimits_{s_{i} \in S_{i} } \ell _{{s_{i} }}^{i} (s)\, {\equals}\, 1$$
defining a distribution over S
i
.
We normalize the cost functions uniformly so that the cost of any path as well as the increase to the cost of any path due to the deviation by a single agent are both upper and lower bounded by absolute positive constants. To simplify the number of relevant parameters we treat the number of resources, paths as a constant.
Theorem 6.1. In congestion games with cost functions of bounded slope, as long as the flow that each agent controls is at most ϵ, any CCE applies 1−O(ϵ 1/4) probability to set of outcomes where (at most) O(ϵ 1/8) fraction of agents have Ω(ϵ 1/8) incentive to deviate.
Proof. Let π be a CCE of the game and let π(s) the probability that it assigns to strategy outcome s. By definition of CCE, the expected cost of any agent cannot decrease if he deviates to another strategy. We consider two possible deviations for each agent of type i. Deviation A has the agent deviating to a strategy that has minimal expected cost according to π (among his available strategies). Deviation B has the agent deviating to the mixed strategy that corresponds to expected flow of all the agents of type i in π. If each agent controlled infinitesimal flow then his cost would be equal to
 $$\mathop {{\rm min}}\limits_{s_{i} \in S_{i} } \,{\bf{E}} _{{{\bf{s}} \,\sim\,\pi }} \left[ {\mathop{\sum}\limits_{e \in S_{i} } c_{e} \left( {\ell _{e} (s)} \right)} \right]$$
and
 $$\mathop{\sum}\limits_{s_{i} \in S_{i} } {\bf{E}} _{{{\bf{s}} \,\sim\,\pi }} \left[ {\ell _{{s_{i} }}^{i} (s)} \right]{\bf{E}} _{{{\bf{s}} \,\sim\,\pi }} \left[ {\mathop{\sum}\limits_{e \in S_{i} } c_{e} \left( {\ell _{e} (s)} \right)} \right]$$
when deviating to A and B, respectively.
Furthermore, his expected cost at π would be less or equal to his cost when deviating to A, which would again be less or equal to his cost when deviating to B. Due to the normalization of the cost functions and the small flow ⩽ϵ that each agent controls this ordering is preserved modulo O(ϵ) terms. This ordering and size of error terms is preserved when computing the (expected) social costs according to π, the sum of the deviation costs when each agent deviates according to A and the sum of all deviation costs when they deviate according to B. Thus,
 $$\eqalignno{ & {\bf{E}} _{{{\bf{s}} \,\sim\,\pi }} [C(s)]\, \les \, \mathop{\sum}\limits_i \mathop {\min }\limits_{s_{i} \in S_{i} } {\bf{E}} _{{{\bf{s}} \,\sim\,\pi }} \left[ {\mathop{\sum}\limits_{e \in S_{i} } c_{e} \left( {\ell _{e} (s)} \right)} \right]{\plus}O({\epsilon}) \cr & \quad \, \les \, \mathop{\sum}\limits_i \mathop{\sum}\limits_{s_{i} \in S_{i} } {\bf{E}} _{{{\bf{s}} \,\sim\,\pi }} \left[ {\ell _{{s_{i} }}^{i} (s)} \right]{\bf{E}} _{{{\bf{s}} \,\sim\,\pi }} \left[ {\mathop{\sum}\limits_{e \in S_{i} } c_{e} \left( {\ell _{e} (s)} \right)} \right]{\plus}O({\epsilon}) $$
By applying Chebyshev’s sum inequality we can derive that for each edge e
 $${\bf{E}} _{{{\bf{s}} \,\sim\,\pi }} \left[ {\ell _{e} (s)} \right]{\bf{E}} _{{{\bf{s}} \,\sim\,\pi }} \left[ {c_{e} \left( {\ell _{e} (s)} \right)} \right]\, \les \, {\bf{E}} _{{{\bf{s}} \,\sim\,\pi }} \left[ {\ell _{e} (s)c_{e} \left( {\ell _{e} (s)} \right)} \right]$$
Taking summation over all edges, we produce the inverse of our first inequality, since
 $$\ell _{e} (s)\, {\equals}\, \mathop{\sum}\nolimits_i \mathop{\sum}\nolimits_{s_{i} {\ni}e} \ell _{{s_{i} }}^{i} (s)$$
, implying that all related terms are equal to each other up to errors of O(ϵ).
By linearity of expectation we have that
 $${\bf{E}} _{{{\bf{s}} \,\sim\,\pi }} \left[ {\left( {\ell _{e} (s){\minus}{\bf{E}} _{{{\bf{s}} \,\sim\,\pi }} \left[ {\ell _{e} (s)} \right]} \right)c_{e} \left( {{\bf{E}} _{{{\bf{s}} \,\sim\,\pi }} \left[ {\ell _{e} (s)} \right]} \right)} \right]\, {\equals}\, 0$$
Combining everything together we derive that
 $${\bf{E}} _{{{\bf{s}} \,\sim\,\pi }} \left[ {\mathop{\sum}\limits_e \left( {\ell _{e} (s){\minus}{\bf{E}} _{{{\bf{s}} \,\sim\,\pi }} \left[ {\ell _{e} (s)} \right]} \right) \cdot \left( {c_{e} (\ell _{e} (s)} \right){\minus}c_{e} \left( {{\bf{E}} _{{{\bf{s}} \,\sim\,\pi }} \left[ {\ell _{e} (s)} \right]} \right)} \right]\, {\equals}\, O({\epsilon})$$
Since costs c e (x) are non-decreasing, the function whose expectation we are computing is always non-negative. In fact, since we have assumed that the slope of the cost functions is upper, lower bounded by some fixed constants we have that
 $${\bf{E}} _{{{\bf{s}} \,\sim\,\pi }} \mathop{\sum}\limits_e \left( {\ell _{e} (s){\minus}{\bf{E}} _{{{\bf{s}} \,\sim\,\pi }} \left[ {\ell _{e} (s)} \right]} \right)^{2} \, {\equals}\, O({\epsilon})$$
By applying Cauchy–Schwarz inequality, we derive that
 $${\bf{E}} _{{{\bf{s}} \,\sim\,\pi }} \mathop{\sum}\limits_e \!\mid\!\ell _{e} (s){\minus}{\bf{E}} _{{{\bf{s}} \,\sim\,\pi }} [\ell _{e} (s)]\!\mid\!\, {\equals}\, O(\sqrt {\epsilon} )$$
The CCE π is closely concentrated around its ‘expected’ flow
 $$E_{{s\,\sim\,\pi }} \left( {\ell _{e} (s)} \right)$$
. For simplicity we denote this continuous flow y. The set of strategy outcomes S′⊂S with
 $$\mathop{\sum}\nolimits_e \left| {\ell _{e} (s'){\minus}\ell _{e} (y)} \right|\,\gt\,{\epsilon}^{{1\,/\,4}} $$
must receive (in π) cumulative probability mass less than O(ϵ
1/4). If we consider the rest strategy outcomes, which we denote as ‘good’, then we have that in each ‘good’ outcome both the social cost (i.e. the sum of the costs of all agents) as well as the cost of the optimal path are always within O(ϵ
1/4) of the respective social cost and cost of the optimal path under flow y. Finally, by combining our main inequality with the fact that
 $${\bf{E}} _{{{\bf{s}} \,\sim\,\pi }} \mathop{\sum}\nolimits_e \left| {\ell _{e} (s){\minus}{\bf{E}} _{{{\bf{s}} \,\sim\,\pi }} \left[ {\ell _{e} (s)} \right]} \right|\, {\equals}\, O(\sqrt {\epsilon} )$$
we have that the social cost under flow y are within
 $$ O(\sqrt {\epsilon} )$$
of the cost of the optimal path under y.
Indeed, since we have
 $${\bf{E}} _{{{\bf{s}} \,\sim\,\pi }} \mathop{\sum}\limits_e \left| {\ell _{e} (s){\minus}{\bf{E}} _{{{\bf{s}} \,\sim\,\pi }} [\ell _{e} (s)]} \right|\, {\equals}\, O\left( {\sqrt {\epsilon} } \right)$$
the terms
 $$\mathop{\sum}\limits_i \mathop {\min }\limits_{s_{i} \in S_{i} } {\bf{E}} _{{{\bf{s}} \,\sim\,\pi }} \left[ {\mathop{\sum}\limits_{e \in S_{i} } c_{e} \left( {\ell _{e} (s)} \right)} \right]$$
and
 $$\mathop{\sum}\limits_i \mathop {\min }\limits_{s_{i} \in S_{i} } \mathop{\sum}\limits_{e \in S_{i} } c_{e} \left( {{\bf{E}} _{{{\bf{s}} \,\sim\,\pi }} \left[ {\ell _{e} (s)} \right]} \right)$$
as well as the pair of
 $$\mathop{\sum}\limits_i \mathop{\sum}\limits_{s_{i} \in S_{i} } {\bf{E}} _{{{\bf{s}} \,\sim\,\pi }} [\ell _{{s_{i} }}^{i} (s)]{\bf{E}} _{{{\bf{s}} \,\sim\,\pi }} \left[ {\mathop{\sum}\limits_{e \in S_{i} } c_{e} (\ell _{e} (s))} \right]$$
with the term
 $$\mathop{\sum}\limits_i \mathop{\sum}\limits_{s_{i} \in S_{i} } {\bf{E}} _{{{\bf{s}} \,\sim\,\pi }} \left[ {\ell _{{s_{i} }}^{i} (s)} \right]\mathop{\sum}\limits_{e \in S_{i} } c_{e} \left( {{\bf{E}} _{{{\bf{s}} \,\sim\,\pi }} \left[ {\ell _{e} (s)} \right]} \right)$$
are within
 $$ O(\sqrt {\epsilon} )$$
of each other, but the first and last term are within O(ϵ) of each other, implying that all terms are within
 $$ O(\sqrt {\epsilon} )$$
.
Hence, all of the ‘good’ outcomes have social cost within O(ϵ 1/4) of the cost of their own optimal path. So, at most O(ϵ 1/8) agents in each ‘good’ outcome can decrease their cost by Ω(ϵ 1/8) by deviating to another path.□
6.2 Correlated equilibria=coarse correlated equilibria for N agents two strategy games
We present another result allowing us to collapse two equilibrium classes in a specific case: any number N of players having two strategies each.
Proposition 6.1. For games where all players have only two strategies, the set of CCE is the same as the set of CE.
Proof. Let i be one of the players, suppose his two strategies are A and D, where we pick D to be the deviating one. Then the requirement for CE states that
 $$\mathop{\sum}\limits_{s_{{{\minus}i}} \in S_{{{\minus}i}} } u_{i} (s_{{{\minus}i}} ,D)\pi (s_{{{\minus}i}} ,A)\, \ges \, \mathop{\sum}\limits_{s_{{{\minus}i}} \in S_{{{\minus}i}} } u_{i} (s_{{{\minus}i}} ,A)\pi (s_{{{\minus}i}} ,A)$$
while the corresponding one for CCE is
 $$\eqalignno{ & \mathop{\sum}\nolimits_{{{s_{{{\minus}i}} \in S_{{{\minus}i}} }}} _ u_{i} (s_{{{\minus}i}} ,D)(\pi (s_{{{\minus}i}} ,A){\plus}\pi (s_{{{\minus}i}} ,D))\, \ges \, \cr & \mathop{\sum}\nolimits_{{{s_{{{\minus}i}} \in S_{{{\minus}i}} }}} _ (u_{i} (s_{{{\minus}i}} ,D)\pi (s_{{{\minus}i}} ,D){\plus}u_{i} (s_{{{\minus}i}} ,A)\pi (s_{{{\minus}i}} ,A)) $$
which is equivalent after removing the
 $$\mathop{\sum}\limits_{s_{{{\minus}i}} \in S_{{{\minus}i}} } u_{i} (s_{{{\minus}i}} ,D)\pi (s_{{{\minus}i}} ,D)$$
term on both sides.□
7 Social welfare gaps for different equilibrium concepts
We define a measure to compare equilibria obtained under no-regret algorithms to NE: the VoL. This measure quantifies by how much the players are able to decrease their costs when relaxing the equilibrium requirements from Nash to CCE.
Definition 7.1. Define the VoL in cost games VoL as the ratio of the social cost of the best NE to that of the best CCE.
 $${\rm VoL}\left( \Gamma \right)\, {\equals}\, {{{\rm best}\,{\rm NE}} \over {{\rm best}\,{\rm CCE}}}$$
Since the set of NE is included in the set of CCE, then the best NE in terms of social cost will always be greater than the best CCE. Thus, we take the ratio so that the VoL is always ⩾1, a convention also found in other papers related to the price of anarchy (Ashlagi et al., Reference Ashlagi, Monderer and Tennenholtz2008; Bradonjic et al., Reference Bradonjic, Ercal-Ozkaya, Meyerson and Roytman2009).
Conversely, we define the PoL as the ratio of the worst CCE to the worst NE.
Definition 7.2. Define the PoL in a cost game Γ as the ratio of the social cost of the worst CCE to that of the worst NE.
 $${\rm PoL}\left( \Gamma \right)\, {\equals}\, {{{\rm worst}\,{\rm CCE}} \over {{\rm worst}\,{\rm NE}}}$$
The ratio of the worst CE to the worst NE was previously defined as the price of mediation (PoM) (Bradonjic et al., Reference Bradonjic, Ercal-Ozkaya, Meyerson and Roytman2009). With the help of Proposition 6.1, we can extend this result to learning algorithms that possess the no-regret property.
7.1 2×2 games
Denote by Γ2×2 the class of 2×2 games. We are interested in the best-case scenario: how high the ratio of the VoL can get for all 2×2 games.
Definition 7.3.
Denote by
 $${ VoL}\left( {\Gamma _{{2{\times}2}} } \right)\, {\equals}\, {\sup }_{\Gamma \in \Gamma _{{2{\times}2}} } { VoL}(\Gamma )$$
the VoL for the class of 2×2 games.
Proposition 7.1.
 $$VoL\left( {\Gamma _{{2{\times}2}} } \right)\, \ges \, {3 \over 2}$$
Proof. Consider the following cost game for x>1
 $$\matrix{ {} & L & R \cr {\matrix{ T \cr B \cr } } & {\left( {\matrix{ {0,\,x{\minus}1} \cr {1,\,1} \cr } } \right.} & {\left. {\matrix{ {x,\,x} \cr {x{\minus}1,\,0} \cr } } \right)} \cr } $$
The game admits three NE: (T, L), (B, R) and ((0.5, 0.5), (0.5, 0.5)). The first two have social cost equal to x−1 while the mixed equilibrium’s is x. The minimum social cost is thus obtained for the pure equilibria, at x−1.
The CE that minimizes social cost assigns probability 1/3 to every action profile except for (T, R). Its social cost is 2x/3. Hence, in this game,
 $${\rm VoL}\, {\equals}\, {{3(x{\minus}1)} \over {2x}}$$
. Taking x → +∞, we derive
 $${\rm VoL}\left( {\Gamma _{{2{\times}2}} } \right)\, \ges \, {3 \over 2}$$
.□
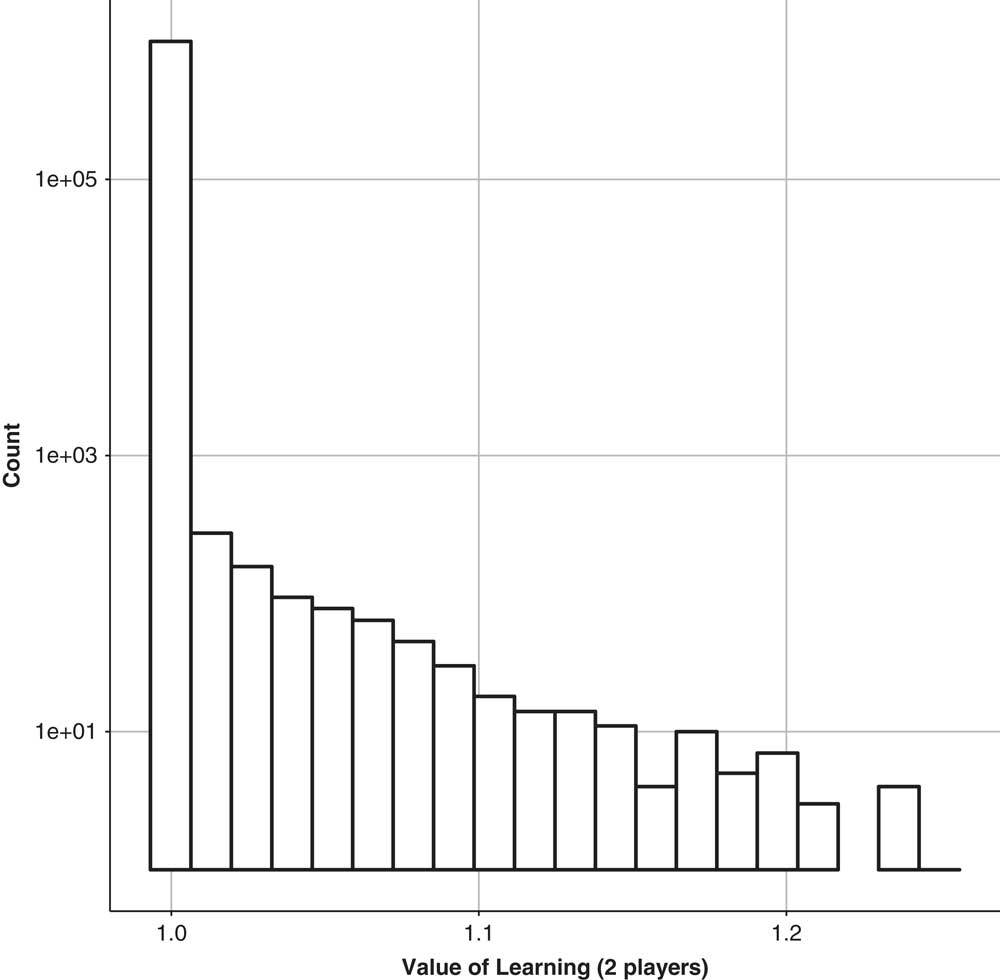
We conjecture that this (3)/(2) bound is tight, that is, there is no 2×2 game Γ such that VoL(Γ)>3/2. To support this claim, we run numerical simulations on games generated from a random uniform distribution. A notable result is the predominance of games for which the ratios are 1, that is mediation does not better the social welfare/cost. We then observe higher ratios at a lower rate, hence our histograms look like those of a power law (Figure 1). The obtained ratios come close to the 3/2 threshold, without going further (only a few ratios approaching 1.4 were observed over 107 simulations).
Proposition 7.2. PoL(Γ2×2)=2
Proof. By Proposition 6.1, the social cost of the worst CE is equal to the social cost of the worst CCE, since the set of CE is the same as the set of CCE. Then by Bradonjic et al. (Reference Bradonjic, Ercal-Ozkaya, Meyerson and Roytman2009), we have that PoL(Γ2×2)=2.□
Histogram of values of learning obtained over 107 simulations for 2×2 games. A log10 scale is used for the y-axis
In Figure 2 we present a two-dimensional (2D) histogram of the joint distribution of the VoL and PoL. 106 games were generated and for each we compute both values. The size of the dot is representative of how many games possess particular values for the VoL and the PoL.
Two-dimensional histogram of value of learning and price of learning over 106 simulations for 2×2 games. The count legend is to be interpreted as a power of 10 (where a count of 5 is 105 observations)
7.2 Larger games
Next, we examine larger games, that is, games with more than two players and/or more than two strategies per player. Let
 $$\Gamma _{{m_{1} ,m_{2} }} $$
denote a two player game with, respectively m
1 and m
2 strategies for each player.
Proposition 7.3.
For sets of games
 $$\Gamma _{{m_{1} ,m_{2} }} $$
,
 $$\max (m_{1} ,m_{2} )\,\gt\,2$$
, we have
 $${\rm VoL}(\Gamma _{{m_{1} ,m_{2} }} )\, {\equals}\, {\plus}\!\infty.$$
Proof.
Consider for ϵ<
 $${1 \over 2}$$
the game
 $$\matrix{ {} & L & C & R \cr {\matrix{ T \cr B \cr } } & {\left( {\matrix{ {1{\minus}{\epsilon},\,1{\minus}{\epsilon}} \cr {{1 \over 2},\,2{\epsilon}} \cr } } \right.} & {\matrix{ {2{\epsilon}\,,{{3{\epsilon}} \over 2}} \cr {{\epsilon},\,1{\minus}{\epsilon}} \cr } } & {\left. {\matrix{ {2{\epsilon},\,{1 \over 2}} \cr {1,\,2{\epsilon}} \cr } } \right)} \cr } $$
The game admits three NE: (L, B), ((0, 1), (2/3, 0, 1/3)) and (2/3, 1/3), (0, 1−ϵ, ϵ). Of the three, the latter has the lowest social cost, equal to 1/3+o(ϵ), where o(ϵ) → ϵ→0 0.
We can define the following CE π:
 $$\matrix{ {} & L & {\hskip -25pt C} & {\hskip -49pt R} \cr {\matrix{ T \cr B \cr } } & {\left( {\matrix{ 0 \cr {\epsilon} \cr } } \right.} & {\matrix{ {1{\minus}{{5{\epsilon}} \over 2}} \cr 0 \cr } & {\left {\matrix{ {\epsilon} \cr {\epsilon}/2 }} \right)\cr } $$
The best social cost in a CE will be lower than that of π, which is o(ϵ). We also have that the best social cost in a CCE will be lower than that of a CE. Thus taking ϵ → 0, we obtain an unbounded VoL.□
The set of CE being included in the set of CCE, we can again extend some results from previous papers to CCE.
Proposition 7.4.
For games
 $$\Gamma _{{m_{1} ,m_{2} }} $$
,
 $$\max (m_{1} ,m_{2} )\,\gt\,2$$
, we have
 $$PoL\left( {\Gamma _{{m_{1} ,m_{2} }} } \right)\, {\equals}\, {\plus}\!\infty.$$
Proof. Since CE⊆CCE, the social cost of the worst CCE is higher than that of the worst CE. By Bradonjic et al. (Reference Bradonjic, Ercal-Ozkaya, Meyerson and Roytman2009) we have that PoM=+∞, hence PoL=+∞.□
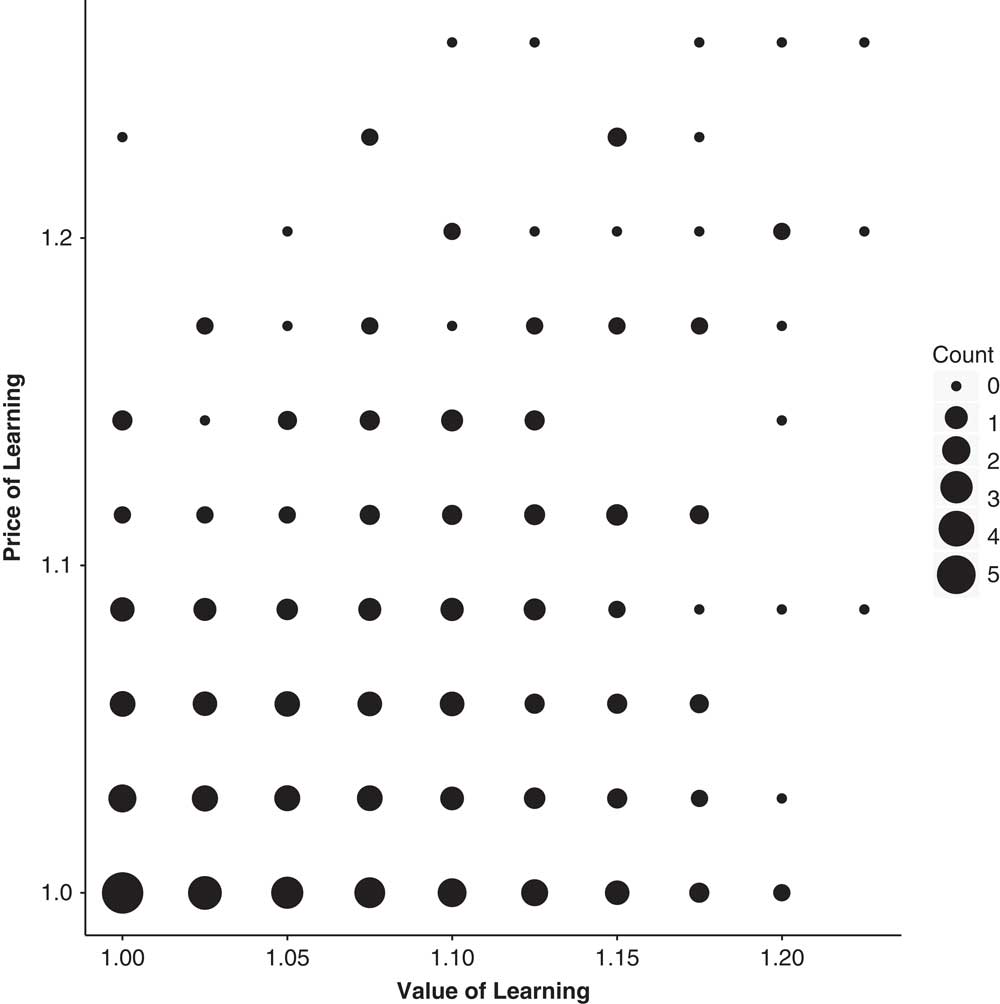
We run a number of simulations to see how VoL is distributed for random games (Figure 3). We have also included a 2D histogram (Figure 4) showing (VoL, PoL) for a number of generated games. Some sampled games have high VoL and some high PoL but not both, indicating a competitive relationship between the two quantities.
Histogram of ratios best Nash equilibrium/best coarse correlated equilibria (value of learning) obtained over 106 simulations for 3×3 games
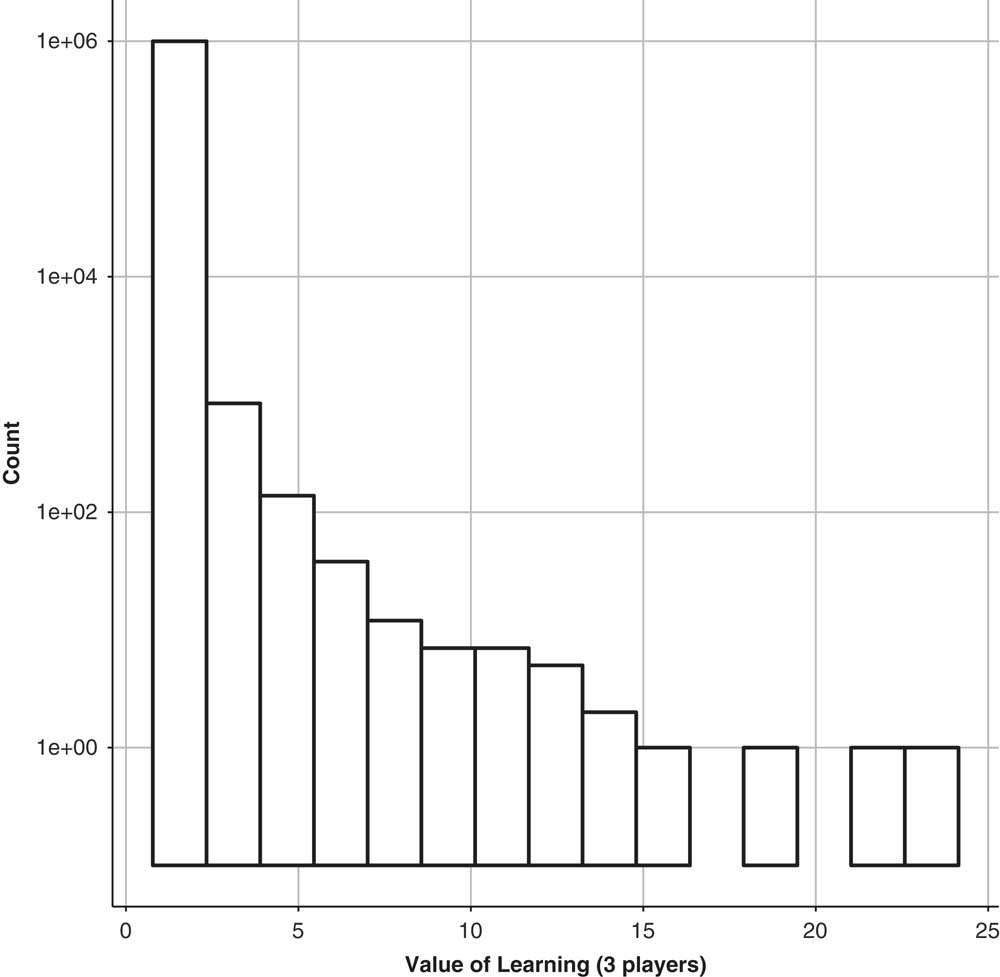
Two-dimensional histogram of value of learning and price of learning over 106 simulations for 3×3 games. The count legend is to be interpreted as a power of 10 (where a count of 5 is 105 observations). We zoomed in the portion [1, 2.5]2 to show finer results
8 Conclusion
No-regret is shared by many natural learning procedures implemented in multi-agent settings. Due to their convergence (to the set of CCE) they are useful in practice. But if we look closer, it is not clear where this convergence leads the play. We have first shown that we can steer it using a somewhat unnatural algorithm to any NE of the one-shot game, while maintaining the no-regret property. In the next sections, we have understood better how the class of CCE relates to no-regret dynamics, and to the smaller class of CE. This lead us to define more general measures of the price of anarchy: if it is hard to predict where the play following no-regret dynamics will go, we are at least able to give some price of anarchy-type bounds on the resulting payoffs. We have concluded with experimental results that show a concentration of small ratios, indicating a closeness to NE payoffs. An interesting open question is to prove our conjecture about the VoL for 2×2 games, with our proven lower bound of 3/2, which we believe to be tight.
Acknowledgments
The authors would like to thank Harald Bernhard for his helpful comments and suggestions. B. M. would like to acknowledge a SUTD Presidential Graduate Fellowship. G. P. would like to acknowledge SUTD grant SRG ESD 2015 097 and MOE AcRF Tier 2 Grant 2016-T2-1-170.