1. Introduction
Foams and emulsions are dispersions of a fluid phase in a liquid phase, stabilised by surfactants. The dispersed phase is constituted of gas bubbles in foams and liquid droplets in emulsions. These discrete objects are packed together and jammed, which makes foams and emulsions complex fluids: they exhibit a yield stress
 ${\it\sigma}_{Y}$
below which they do not flow, but deform elastically. Above yield stress, they flow like rheothinning fluids. Rheometric measurements in a Couette cell or in cone–plate geometry have shown that the shear stress
 ${\it\sigma}$
and the shear rate
 $\dot{{\it\gamma}}$
obey an empirical Herschel–Bulkley law:
 ${\it\sigma}={\it\sigma}_{Y}+A\dot{{\it\gamma}}^{n}$
, with
 $A$
the plastic viscosity and
 $n$
an exponent generally lower than one, and often close to 0.5 (Princen & Kiss Reference Princen and Kiss1989; Marze, Langevin & Saint-Jalmes Reference Marze, Langevin and Saint-Jalmes2008; Denkov et al.
Reference Denkov, Tcholakova, Golemanov, Ananthapadmanabhan and Lips2009), with some dependence on the surfactants used (Denkov et al.
Reference Denkov, Tcholakova, Golemanov, Ananthapadmanabhan and Lips2009).
The aforementioned measurements did not give access to the microstructure under flow, and other techniques have been developed to visualise it. In emulsions, confocal microscopy on systems of matched optical index has recently enabled the measurement of the local structure (Jorjadze, Pontani & Brujić Reference Jorjadze, Pontani and Brujić2013) and the velocity field (Goyon et al. Reference Goyon, Colin, Ovarlez, Ajdari and Bocquet2008; Goyon, Colin & Bocquet Reference Goyon, Colin and Bocquet2010; Mansard, Bocquet & Colin Reference Mansard, Bocquet and Colin2014). The latter could also be measured using magnetic resonance imaging (Ovarlez et al. Reference Ovarlez, Rodts, Ragouilliaux, Coussot, Goyon and Colin2008). In foams, index matching is not possible and the route has been to devise bidimensional (2D) experiments on either bubble rafts at the surface of a pool of soap solution, with or without a confining top plate (Lauridsen, Chanan & Dennin Reference Lauridsen, Chanan and Dennin2004; Dollet et al. Reference Dollet, Elias, Quilliet, Raufaste, Aubouy and Graner2005; Wang, Krishan & Dennin Reference Wang, Krishan and Dennin2006; Katgert, Möbius & Van Hecke Reference Katgert, Möbius and Van Hecke2008; Katgert et al. Reference Katgert, Tighe, Möbius and van Hecke2010), or on bubble monolayers confined between two plates in a Hele-Shaw cell (Debrégeas, Tabuteau & di Meglio Reference Debrégeas, Tabuteau and di Meglio2001).
Among many interesting features such as shear banding (see e.g. Schall & van Hecke Reference Schall and van Hecke2010 for a review), these studies have called the Herschel–Bulkley law found in rheometry into question. Among possible flow configurations, the Poiseuille flow in a straight channel is particularly interesting, since this geometry enforces a linear variation across the channel of the shear stress, which vanishes at the centre and reaches its maximum at the sidewalls. Together with an evaluation of the shear rate from the measured velocity profile, it gives access to the relation
 ${\it\sigma}(\dot{{\it\gamma}})$
at the local scale. In particular, Goyon et al. (Reference Goyon, Colin, Ovarlez, Ajdari and Bocquet2008, Reference Goyon, Colin and Bocquet2010) have measured this relation in a series of experiments on emulsions, and they have shown that it does not collapse onto a single Herschel–Bulkley law. This deviation from a single flow curve was ascribed to wall effects, more precisely to a non-local influence of plastic events occurring in the vicinity of the boundaries. The velocity profiles were well fitted by a fluidity model (Goyon et al.
Reference Goyon, Colin, Ovarlez, Ajdari and Bocquet2008, Reference Goyon, Colin and Bocquet2010). This model, based on a kinetic theory approach (Bocquet, Colin & Ajdari Reference Bocquet, Colin and Ajdari2009), predicts that the fluidity, defined as
 $f=\dot{{\it\gamma}}/{\it\sigma}$
, is proportional to the rate of plastic events and follows a non-local diffusion equation when it deviates from its bulk value. The range of influence
 ${\it\xi}$
appearing in this equation, called the spatial cooperativity, was shown to be of the order of a few times (typically, five) the size of the elementary microstructural constituent (the drop radius in the case of emulsions) (Goyon et al.
Reference Goyon, Colin, Ovarlez, Ajdari and Bocquet2008, Reference Goyon, Colin and Bocquet2010; Geraud, Bocquet & Barentin Reference Geraud, Bocquet and Barentin2013). This picture was later applied to other soft materials, such as Carbopol gels (Geraud et al.
Reference Geraud, Bocquet and Barentin2013), granular media (Amon et al.
Reference Amon, Nguyen, Bruand, Crassous and Clément2012; Kamrin & Koval Reference Kamrin and Koval2012) and foams in a 2D cylindrical Couette geometry (Katgert et al.
Reference Katgert, Tighe, Möbius and van Hecke2010). The fluidity model agrees with existing experiments, and provides a convenient framework to rationalise the flow of complex fluids. However, at least two points remain unclear and deserve further investigation. The first is the boundary condition at solid walls for fluidity. As a matter of fact, most experimentalists have set it as a free fitting parameter, which certainly improves the agreement between the measurements and the predictions from the fluidity model, but does not provide any insight into the role of the walls. Only recently, Mansard et al. (Reference Mansard, Bocquet and Colin2014) explored the role of surface boundary conditions for the flow of a dense emulsion. They showed that both slippage and wall fluidisation depend non-monotonically on the roughness, a behaviour that has been interpreted with a simple model invoking the building of a stratified layer and the activation of plastic events by the surface roughness. These results are interesting and call for further verification in terms of numerical simulations (Sbragaglia et al.
Reference Sbragaglia, Benzi, Bernaschi and Succi2012; Benzi et al.
Reference Benzi, Bernaschi, Sbragaglia and Succi2013) and other complex fluids (Katgert et al.
Reference Katgert, Tighe, Möbius and van Hecke2010). Second, the fluidity parameter
 $f$
has not yet been convincingly related to an independent measure of the local density of plastic events. In experiments, only indirect indications of such a relation have been proposed, based on the correlations of the fluctuations of the shear rate (Jop et al.
Reference Jop, Mansard, Chaudhuri, Bocquet and Colin2012). Using numerical simulations based on the bubble model (Durian Reference Durian1997), Mansard et al. (Reference Mansard, Colin, Chaudhuri and Bocquet2013) were able to measure the fluidity and the density of plastic events independently, but they showed that the two quantities are not proportional; more precisely, the rearrangement rate was found to be a sublinear power (with an exponent 0.4) of the fluidity.
Actually, fluidity models offer a potential explanation for the deviation from a unique relation between the stress and the strain rate, but they are not the only ones. Another approach has been to develop elasto-viscoplastic models (see e.g. Cheddadi, Saramito & Graner Reference Cheddadi, Saramito and Graner2012 for a review of them) which, in essence, supplement the viscoplastic Herschel–Bulkley rheology with a description of elasticity. These models are local, but since they treat elastic deformation as an independent variable, they also predict deviations from a single Herschel–Bulkley relation. They have been compared with experiments in Couette flows (Cheddadi et al. Reference Cheddadi, Saramito and Graner2012), but not for Poiseuille flows.
All these theoretical approaches rely crucially on the modelling of plastic events, and how they affect the elastic stress and the flow. However, although this connection between elasticity, plasticity and flow has been studied in foam flows in complex geometries (Dollet & Graner Reference Dollet and Graner2007; Dollet Reference Dollet2010; Cheddadi et al. Reference Cheddadi, Saramito, Dollet, Raufaste and Graner2011), there is no existing experimental measurement of the rate of plastic events in a Poiseuille flow. Two-dimensional foams are particularly well suited for such a study, because elementary plastic events (so-called T1 events) are well characterised by the neighbour swapping of four bubbles (figures 2 and 3) and are accessible by image analysis, more easily than in other soft glassy materials.
In this paper, we provide experimental measurements of the rate of plastic events in a Poiseuille flow, on a confined foam in a Hele-Shaw geometry. Such a measurement has already been made in Couette flows (Kabla & Debrégeas Reference Kabla and Debrégeas2003; Wang et al.
Reference Wang, Krishan and Dennin2006), but never in a Poiseuille configuration, to the best of our knowledge. We show that it is closely related to the independently measured velocity profiles, and that there is still a non-vanishing plastic activity towards the centre of the channel. The study of the spatial distribution in the number of plastic events and the simultaneous analysis of the velocity profiles allows us to bridge the gap between the details of the irreversible plastic rearrangements and the corresponding cooperativity flow behaviour at the macroscopic level (Goyon et al.
Reference Goyon, Colin, Ovarlez, Ajdari and Bocquet2008, Reference Goyon, Colin and Bocquet2010; Geraud et al.
Reference Geraud, Bocquet and Barentin2013). We choose to explore this connection by looking at the relationship between the localisation length of the velocity profiles and the localisation length of the number of plastic events. To complement the cooperativity mechanisms studied in foam with those of ‘other’ soft glassy systems, we compare the experiments with simulations of emulsion droplets based on the lattice Boltzmann method (LBM) (Sbragaglia et al.
Reference Sbragaglia, Benzi, Bernaschi and Succi2012). The numerical model falls within the class of ‘mesoscopic’ models, which have been vigorously pursued in the literature to study the behaviour of soft glassy flows (Sollich et al.
Reference Sollich, Lequeux, Hébraud and Cates1997; Hébraud & Lequeux Reference Hébraud and Lequeux1998; Sollich Reference Sollich1998; Bocquet et al.
Reference Bocquet, Colin and Ajdari2009; Mansard et al.
Reference Mansard, Colin, Chaudhuri and Bocquet2013; Nicolas & Barrat Reference Nicolas and Barrat2013). Its elementary mesoscopic rules, at the level of the lattice units, are designed to reproduce the continuum behaviour of soft glassy materials, in the very same way that the Boltzmann equation in statistical physics, once properly averaged, yields the Navier–Stokes equations. The numerical model we use possesses two advantages that are rarely present together. From one side, it gives a realistic structure of the emulsion droplets, like, for example, the surface evolver method (Reinelt & Kraynik Reference Reinelt and Kraynik2000; Kern et al.
Reference Kern, Weaire, Martin, Hutzer and Cox2004; Cox & Janiaud Reference Cox and Janiaud2008); at the same time, due to the built-in properties, the model gives direct access to equilibrium and out-of-equilibrium stresses (Sbragaglia et al.
Reference Sbragaglia, Benzi, Bernaschi and Succi2012), including elastic and viscous contributions. In contrast to other mesoscopic models, such as Durian’s bubble model (Durian Reference Durian1997), our model naturally incorporates the dissipative mechanisms and the interfacial stresses. Numerical simulations are particularly helpful to go beyond some of the limitations of the experiments: because of wall friction, indeed, there is no simple relation between the shear stress and the shear rate, whereas the numerical simulations can be performed both with and without wall friction. In this paper, wall friction will always refer to the friction of the flowing foam on the confining top and bottom plates (see figure 1), and not on the sidewalls, unless explicitly stated. Numerical simulations also offer the possibility to test the robustness of some of the experimental findings versus a change in the viscous ratio
 ${\it\chi}$
between the dispersed phase and the continuous phase, this being set to
 ${\it\chi}=1$
in all the numerical simulations, whereas
 ${\it\chi}\approx 10^{-2}$
in foams; in that sense, the simulations look closer to emulsions.
(a) Sketch of the side view of the set-up. (b) Snapshot of an experiment. The distance between the two sidewalls is
 $H=106.6~\text{mm}$
. The average bubble size is
 $12.3~\text{mm}^{2}$
and the liquid fraction is
 ${\it\phi}_{l}=4.8\,\%$
. The two spots at the left and right of the image are the points between which the pressure drop is measured.

The paper is organised as follows. In § 2, we describe the experimental set-up along with the tools of image analysis for characterisation of the plastic events. In § 3, and supplementary material presented in appendices A and B, we review our computational model based on the LBM. The review of the computational model will be accompanied by further benchmark tests on the capability of the model to include crucial properties such as disjoining pressure and wall friction. Results and discussion will be the subject of § 4. The experimentally measured velocity profiles (§ 4.1) will be compared with local linear and nonlinear models (§ 4.2 and appendix C). Results of numerical simulations and comparisons with the fluidity model (Goyon et al. Reference Goyon, Colin, Ovarlez, Ajdari and Bocquet2008; Bocquet et al. Reference Bocquet, Colin and Ajdari2009) will be the subject of § 4.3. In § 4.4, we compare the localisations of the velocity profiles and of the rate of plastic events. In § 4.5, we will finally report details on the orientation of the plastic rearrangements in the flowing material. Conclusions will follow in § 5.
2. Experimental methods
2.1. Set-up
We have adapted the set-up described in Dollet (Reference Dollet2010). The foam flows in a Hele-Shaw cell, made of two horizontal glass plates of length 170 cm and width 32 cm, separated by a gap
 $h=2~\text{mm}$
thin enough that the foam is confined as a bubble monolayer (figure 1
a). Two plastic plates of thickness 2 mm are inserted inside the Hele-Shaw cell, so that the width
 $H$
of the channel is reduced to 10.66 cm (figure 1
b). These plates have a negligible roughness compared with the bubble size. The channel is connected upstream to a vertical chamber (figure 1
a) in which a soap solution is fed at a prescribed flow rate
 $Q_{l}$
thanks to a syringe pump (PHD2000, Harvard Apparatus). Nitrogen is continuously blown through injectors at the bottom of this chamber, producing rather monodisperse bubbles (figure 1
b). The flow rate in each injector is independently controlled with an electronic flow-rate controller (Brooks). We identify the liquid fraction
 ${\it\phi}_{l}$
as the ratio of the liquid flow rate to the total flow rate:
 ${\it\phi}_{l}=Q_{l}/(Q_{g}+Q_{l})$
, with
 $Q_{g}$
the gas flow rate. The resulting foam accumulates on top of the chamber, then flows through the channel. The transit time through the whole channel is less than 10 min in all experiments; we do not observe significant change of bubble size during this time, hence coarsening is negligible. The soap solution is a mixture of sodium lauryl dioxyethylene sulphate (SLES), cocamidopropyl betaine (CAPB) and myristic acid (MAc), following the protocol described in Golemanov et al. (Reference Golemanov, Denkov, Tcholakova, Vethamuthu and Lips2008). We prepare a concentrated solution of 6.6 wt% of SLES and 3.4 % of CAPB in ultrapure water, we dissolve 0.4 wt% of MAc by continuously stirring and heating at
 $60\,^{\circ }\text{C}$
for about 1 h, and we dilute 20 times in ultrapure water. The solution has a surface tension of
 ${\rm\Gamma}=22.4~\text{mN}~\text{m}^{-1}$
. The contraction region is lit by a circular neon tube, giving isotropic and nearly homogeneous illumination over a diameter of approximately 20 cm. Movies of the foam flow are recorded with a CCD camera at a frame rate of 8 f.p.s., with an exposure time of 8 ms. The movies are constituted of 1000 images of 1312 pixel
 $\times$
672 pixel. The pressure drop is measured across the observation zone by a water–water differential manometer connected to two points of the channel (figure 1
b) through tubes full of water. We performed five different experiments, for which a summary of the parameters is provided in table 1.
Summary of the main characteristics of the experiments presented in this paper, with the respective symbols used in the figures. The parameters
 $v_{0}$
,
 ${\it\alpha}_{s}$
and
 $L_{v}$
come from the fit of the velocity profiles by the formula (4.1). The angles
 ${\it\theta}_{d}$
and
 ${\it\theta}_{a}$
are the orientations of plastic events (figures 2 and 3). The quantity
 $\text{d}P/\text{d}x$
is the pressure drop along the channel, and
 $\text{d}{\it\sigma}\!/\text{d}y$
is the gradient of shear elastic stress across the channel.

(a) A snapshot of the bubbles in the foam flowing from left to right. (b) Sketch of a plastic event. By following the displacements of the bubbles between subsequent images, we are able to determine the features of a T1 rearrangement. In grey (black) we report the bubble edges just before (after) the T1. With the solid (dashed) line, we report the link between the centres of the two bubbles that lose (come into) contact during the T1. From the analysis of the links, we are able to determine the angles associated with the links that disappear (
 $d$
) or appear (
 $a$
) in the T1 rearrangement.

(a) A snapshot of the droplets (identified by their corresponding Voronoi cells) in a concentrated emulsion, flowing from left to right, obtained in numerical simulations based on the lattice Boltzmann model. (b) Sketch of a T1 plastic event from the simulations. To systematically analyse plastic events, we perform a Voronoi tessellation from the centres of mass of the droplets. Following the Voronoi tessellation in time, we are able to identify T1 events and associated disappearing (red solid line) and appearing (blue dashed line) links. In grey (black) we indicate the Voronoi cells soon before (after) a T1 event. The numerical results will be compared with the experimental results (see also figure 2).

2.2. Image analysis
To extract the relevant rheological information from the movies, we follow a home-made procedure very similar to that presented in Dollet & Graner (Reference Dollet and Graner2007) and Dollet (Reference Dollet2010); we refer to these papers for full details. The velocity field is obtained after averaging of all the displacements of all individual bubbles between consecutive frames (approximately
 $3\times 10^{6}$
in total). Averaging is performed along 53 lanes aligned with the flow direction. The T1s are tracked as described in Dollet & Graner (Reference Dollet and Graner2007). For the four bubbles concerned by a T1, we denote
 $\boldsymbol{r}_{d}$
(
 $\boldsymbol{r}_{a}$
) the vector linking the centres of the two bubbles that lose (come into) contact,
 ${\it\theta}_{d}^{\prime }$
and
 ${\it\theta}_{a}^{\prime }$
the angles of these vectors with respect to the flow direction, which we can restrict to the interval
 $[-{\rm\pi}/2,{\rm\pi}/2]$
because the orientations of
 $\boldsymbol{r}_{d}$
and
 $\boldsymbol{r}_{a}$
are irrelevant (figures 2 and 3), and
 $\boldsymbol{x}_{d}$
(
 $\boldsymbol{x}_{a}$
) the position of the midpoint of the centres of the two bubbles that lose (come into) contact. In our program, the detection of appearing and disappearing contacts is first run independently. As a second step, to identify a T1 and minimise artefacts, we decide that a pair of an appearing and a disappearing contact constitutes a single T1 if (i) they are in the same image or if the appearing contact occurs in the image next to the disappearing one; the latter condition is necessary, because it happens that transient fourfold vertices are erroneously recognised as artificial small bubbles; (ii) the positions
 $\boldsymbol{x}_{d}$
and
 $\boldsymbol{x}_{a}$
are closer than a critical distance (which we choose to be of the order of the bubble size, to separate from T1s occurring in the neighbourhood); (iii)
 $|{\it\theta}_{d}^{\prime }-{\it\theta}_{a}^{\prime }|$
is larger than a critical angle (we choose
 ${\rm\pi}/4$
), this condition being necessary because of the appearance of the aforementioned spurious bubbles. By visual inspection on 30 images, we estimate that this procedure leads to an uncertainty of no more than 5 % on the number
 $N_{T1}$
of T1s. We then define the quantity
 $(\boldsymbol{x}_{d}+\boldsymbol{x}_{a})/2$
as the position of a T1, and we ascribe this information to the box where this position belongs. We thus compute the scalar field of the frequency of T1s per unit time and area:
 $$\begin{eqnarray}R_{T1}=\frac{N_{T1}}{2A_{\mathit{box}}t_{\mathit{movie}}},\end{eqnarray}$$
where
 $A_{\mathit{box}}$
is the area of a box and
 $t_{\mathit{movie}}$
is the duration of a movie. Our T1 detection has two major advantages: (i) it is directly based on the topological rearrangements, in contrast to indirect characterisations based on velocity correlations; (ii) it yields an unprecedented statistics, up to
 $2.5\times 10^{4}$
individual T1s, which enables us to average over the same lanes as for the velocity and to perform quantitative analysis.
We now address the measurement of stress. Batchelor (Reference Batchelor1970) has derived the general expression for the stress in a suspension of force-free particles, including the effect of surface tension. This was first applied to the calculation of the elastic stress in foams and emulsions by Khan & Armstrong (Reference Khan and Armstrong1986), and it yields the same prediction of the elastic shear modulus as Princen (Reference Princen1983), which has been experimentally validated (Princen & Kiss Reference Princen and Kiss1986) and used ever since. Considering a representative volume element
 $V$
of foam, the stress is written as
 $$\begin{eqnarray}{\bf\sigma}=-\frac{1}{V}\mathop{\sum }_{k}V_{k}P_{k}\mathbf{1}-{\it\phi}_{\ell }p\mathbf{1}+\frac{{\it\mu}}{V}\int _{V_{\ell }}\dot{{\bf\gamma}}\text{d}V+\frac{{\rm\Gamma}}{V}\int _{S}(\mathbf{1}-\boldsymbol{n}\otimes \boldsymbol{n})\text{d}S,\end{eqnarray}$$
where the index
 $k$
labels the bubbles contained within
 $V$
,
 $V_{k}$
and
 $P_{k}$
are the volume and pressure of bubble
 $k$
,
 $p$
is the pressure in the continuous phase of volume
 $V_{\ell }$
and viscosity
 ${\it\mu}$
,
 $\dot{{\bf\gamma}}$
is the rate-of-strain tensor,
 $S$
is the surface of the gas/liquid interfaces contained within
 $V$
,
 $\boldsymbol{n}$
is the local normal unit vector and
 $\mathbf{1}$
stands for the unity tensor of rank two. The two first terms in (2.2) give the pressure contribution to the stress, and the third term gives the viscous contribution. We cannot measure these contributions in our set-up. The last term in (2.2) is the elastic stress
 ${\bf\sigma}^{e}$
(Cantat et al.
Reference Cantat, Cohen-Addad, Elias, Graner, Höhler, Pitois, Rouyer and Saint-Jalmes2013). A specific advantage of quasi-2D foams, confined in a Hele-Shaw cell so as to form a bubble monolayer, is the possibility to measure elastic stress directly from image analysis. Neglecting the curvature of the films between two bubbles, i.e. assuming that they are flat rectangles of height
 $h$
and horizontal side
 $\boldsymbol{\ell }$
, which is a reasonable approximation in practice (figure 2), the elastic stress is
 $$\begin{eqnarray}{\bf\sigma}^{e}=2{\rm\Gamma}h{\it\rho}_{\boldsymbol{\ell }}\left\langle \frac{\boldsymbol{\ell }\otimes \boldsymbol{\ell }}{\ell }\right\rangle ,\end{eqnarray}$$
with
 ${\it\rho}_{\boldsymbol{\ell }}$
the areal density of bubble edges, and where the average is computed over the same lanes as for the velocity and plastic events. The total number of bubble edges
 $\boldsymbol{\ell }$
treated for each experiment is approximately
 $10^{7}$
.
The ‘force-free’ assumption in the approach of Batchelor (Reference Batchelor1970) amounts to neglecting the effect of buoyancy on the bubbles or, more precisely, to neglecting the variation of hydrostatic pressure
 ${\it\rho}gh$
over the height of the bubbles (with
 ${\it\rho}=10^{3}~\text{kg}~\text{m}^{-3}$
the density of the soap solution,
 $g=10~\text{m}~\text{s}^{-2}$
the gravity acceleration, and
 $h=2~\text{mm}$
the cell gap) compared with the capillary overpressure
 ${\rm\Gamma}/R_{PB}$
, where
 $R_{PB}$
is the radius of the Plateau borders between three neighbouring bubbles, or two neighbouring bubbles and a plate, the latter ones containing most of the solution for foams confined within a Hele-Shaw cell. The quantity
 $R_{PB}$
is readily related to the liquid fraction
 ${\it\phi}_{\ell }$
. Since in order of magnitude, each bubble of volume
 $Ah$
is surrounded by a total length
 ${\approx}\sqrt{A}$
of such Plateau borders of cross-section
 ${\approx}R_{PB}^{2}$
, one has
 $R_{PB}\approx h^{1/2}A^{1/4}{\it\phi}_{\ell }^{1/2}$
. Hence, the ratio of the hydrostatic to capillary pressures is
 ${\it\rho}ghR_{PB}/{\rm\Gamma}\approx {\it\rho}gh^{3/2}A^{1/4}{\it\phi}_{\ell }^{1/2}/{\rm\Gamma}=0.01$
or 0.02 for our experimental values of the parameters (table 1), much lower than one. Therefore, it is safe to assume that the bubbles are ‘force-free’ particles.
3. Numerical method
For the numerical simulations, we adopt a dynamic rheological model based on the LBM (Benzi, Succi & Vergassola Reference Benzi, Succi and Vergassola1992; Chen & Doolen Reference Chen and Doolen1998; Aidun & Clausen Reference Aidun and Clausen2010). Historically, the main successful applications of the LBM in the context of computational fluid dynamics pertain to the weakly compressible Navier–Stokes equations (Benzi et al.
Reference Benzi, Succi and Vergassola1992; Chen & Doolen Reference Chen and Doolen1998) and models associated with more complex flows involving phase transition/separation (Shan & Chen Reference Shan and Chen1993, Reference Shan and Chen1994; Benzi et al.
Reference Benzi, Sbragaglia, Succi, Bernaschi and Chibbaro2009). In particular, we will make use of a computational model for non-ideal binary fluids, which combines a positive surface tension, promoting the formation of diffuse interfaces, with a positive disjoining pressure, inhibiting droplet (or bubble) coalescence. The model has already been validated for a wide spectrum of problems/phenomena (Benzi et al.
Reference Benzi, Sbragaglia, Succi, Bernaschi and Chibbaro2009, Reference Benzi, Bernaschi, Sbragaglia and Succi2010, Reference Benzi, Bernaschi, Sbragaglia and Succi2013; Sbragaglia et al.
Reference Sbragaglia, Benzi, Bernaschi and Succi2012). Among others, these problems/phenomena include the emergence of non-Newtonian Herschel–Bulkley rheology (Benzi et al.
Reference Benzi, Bernaschi, Sbragaglia and Succi2010), the importance of load conditions on rheology (Benzi et al.
Reference Benzi, Bernaschi, Sbragaglia and Succi2013), cooperativity flows (Sbragaglia et al.
Reference Sbragaglia, Benzi, Bernaschi and Succi2012) and ageing (Benzi et al.
Reference Benzi, Sbragaglia, Succi, Bernaschi and Chibbaro2009). In this section we just review the method and highlight its essential supramolecular features. The mesoscopic kinetic model considers two fluids
 $A$
and
 $B$
, each described by a discrete kinetic distribution function
 $f_{{\it\zeta}i}(\boldsymbol{r},\boldsymbol{c}_{i},t)$
, measuring the probability of finding a particle of fluid
 ${\it\zeta}=A,B$
at position
 $\boldsymbol{r}$
and time
 $t$
, with discrete velocity
 $\boldsymbol{c}_{i}$
. In other words, the mesoscale particle represents all molecules contained in a unit cell of the lattice. The distribution functions evolve in time under the effect of free-streaming and local two-body collisions, described, for both fluids (
 ${\it\zeta}=A,B$
), by a relaxation towards a local equilibrium (
 $f_{{\it\zeta}i}^{(eq)}$
) with a characteristic time
 ${\it\tau}_{LB}$
:
 $$\begin{eqnarray}f_{{\it\zeta}i}(\boldsymbol{r}+\boldsymbol{c}_{i},\boldsymbol{c}_{i},t+1)-f_{{\it\zeta}i}(\boldsymbol{r},\boldsymbol{c}_{i},t)=-\frac{1}{{\it\tau}_{LB}}\left(f_{{\it\zeta}i}-f_{{\it\zeta}i}^{(eq)}\right)(\boldsymbol{r},\boldsymbol{c}_{i},t)+S_{{\it\zeta}i}^{(tot)}(\boldsymbol{r},\boldsymbol{c}_{i},t).\end{eqnarray}$$
Local equilibria are given by a low-Mach-number expansion of the Maxwellian distribution, namely
 $$\begin{eqnarray}f_{{\it\zeta}i}^{(eq)}=w(|\boldsymbol{c}_{i}|^{2}){\it\rho}_{{\it\zeta}}\left[1+\frac{\boldsymbol{v}\boldsymbol{\cdot }\boldsymbol{c}_{i}}{c_{s}^{2}}+\frac{\boldsymbol{v}\boldsymbol{v}:(\boldsymbol{c}_{i}\boldsymbol{c}_{i}-c_{s}^{2}\mathbf{1})}{2c_{s}^{4}}\right],\end{eqnarray}$$
with
 $w(|\boldsymbol{c}_{i}|^{2})$
a set of weights chosen in such a way as to maximise the algebraic degree of precision in the computation of the hydrodynamic fields, while
 $c_{s}=1/\sqrt{3}$
is a characteristic velocity (a constant in the model). Our lattice scheme features 25 discrete velocities (Shan, Yuan & Chen Reference Shan, Yuan and Chen2006; Benzi et al.
Reference Benzi, Sbragaglia, Succi, Bernaschi and Chibbaro2009), whose details and associated weights are reported in table 3 in appendix A. Coarse-grained hydrodynamical densities are defined for both species,
 ${\it\rho}_{{\it\zeta}}=\sum _{i}f_{{\it\zeta}i}$
, as well as a global momentum for the whole binary mixture,
 $\boldsymbol{j}={\it\rho}\boldsymbol{v}=\sum _{{\it\zeta},i}f_{{\it\zeta}i}\boldsymbol{c}_{i}$
, with
 ${\it\rho}=\sum _{{\it\zeta}}{\it\rho}_{{\it\zeta}}$
. Non-ideal forces (
 $\boldsymbol{F}_{{\it\zeta}}$
) and a body force term (
 $\boldsymbol{F}_{b}$
) are introduced with the source term
 $\boldsymbol{S}_{{\it\zeta}i}^{(tot)}$
in (3.1). This source term produces the desired force once it is projected on the momentum field, i.e.
 $\sum _{{\it\zeta}}\sum _{i}\boldsymbol{S}_{{\it\zeta}i}^{(tot)}\boldsymbol{c}_{i}=\sum _{{\it\zeta}}\boldsymbol{F}_{{\it\zeta}}+\boldsymbol{F}_{b}$
. The non-ideal forces include a variety of interparticle forces,
 $\boldsymbol{F}_{{\it\zeta}}=\boldsymbol{F}_{{\it\zeta}}^{(r)}+\boldsymbol{F}_{{\it\zeta}}^{(F)}$
. First, a repulsive (
 $r$
) force with strength parameter
 $\mathscr{G}_{AB}$
between the two fluids,
 $$\begin{eqnarray}\boldsymbol{F}_{{\it\zeta}}^{(r)}(\boldsymbol{r})=-\frac{\mathscr{G}_{AB}}{{\it\rho}_{0}^{2}}{\it\rho}_{{\it\zeta}}(\boldsymbol{r})\mathop{\sum }_{i=1-8,{\it\zeta}^{\prime }\neq {\it\zeta}}w(|\boldsymbol{c}_{i}|^{2}){\it\rho}_{{\it\zeta}^{\prime }}(\boldsymbol{r}+\boldsymbol{c}_{i})\boldsymbol{c}_{i},\end{eqnarray}$$
is responsible for phase separation (Benzi et al.
Reference Benzi, Sbragaglia, Succi, Bernaschi and Chibbaro2009). The parameter
 ${\it\rho}_{0}$
is a characteristic normalisation parameter, used as a free parameter in the model. The ‘short’-range interaction in (3.3) is extended up to energy shells
 $|\boldsymbol{c}_{i}|^{2}=2$
(lattice links have been normalised to a characteristic lattice velocity). Phase separating interactions (3.3) are nothing but a lattice transcription of continuum mean-field models for phase segregation (Bastea et al.
Reference Bastea, Esposito, Lebowitz and Marra2002). When the strength parameter
 $\mathscr{G}_{AB}/{\it\rho}_{0}^{2}$
in (3.3) is chosen above a critical value, the model achieves phase separation and promotes the emergence of stable diffuse interfaces with a positive surface tension, which allows for the simulation of a collection of droplets. However, the thin films between neighbouring droplets are not stable against rupture, as the interactions (3.3) give rise only to negative disjoining pressures (Shan & Chen Reference Shan and Chen1993, Reference Shan and Chen1994). To promote the emergence of a positive disjoining pressure stabilising the thin films, we introduce a mechanism for frustration (
 $F$
) for phase separation with the help of competing interactions (Shore, Holzer & Sethna Reference Shore, Holzer and Sethna1992; Seul & Andelman Reference Seul and Andelman1995). In particular, we model short-range (nearest neighbour, NN) self-attraction, controlled by strength parameters
 $\mathscr{G}_{AA,1}<0$
,
 $\mathscr{G}_{BB,1}<0$
, and ‘long-range’ (next to nearest neighbour, NNN) self-repulsion, governed by strength parameters
 $\mathscr{G}_{AA,2}>0$
,
 $\mathscr{G}_{BB,2}>0$
,
 $$\begin{eqnarray}\boldsymbol{F}_{{\it\zeta}}^{(F)}(\boldsymbol{r})=-\mathscr{G}_{{\it\zeta}{\it\zeta},1}{\it\psi}_{{\it\zeta}}(\boldsymbol{r})\mathop{\sum }_{i=1-8}w(|\boldsymbol{c}_{i}|^{2}){\it\psi}_{{\it\zeta}}(\boldsymbol{r}+\boldsymbol{c}_{i})\boldsymbol{c}_{i}-\mathscr{G}_{{\it\zeta}{\it\zeta},2}{\it\psi}_{{\it\zeta}}(\boldsymbol{r})\mathop{\sum }_{i=1-24}p(|\boldsymbol{c}_{i}|^{2}){\it\psi}_{{\it\zeta}}(\boldsymbol{r}+\boldsymbol{c}_{i})\boldsymbol{c}_{i},\end{eqnarray}$$
with
 ${\it\psi}_{{\it\zeta}}(\boldsymbol{r})={\it\psi}_{{\it\zeta}}[{\it\rho}(\boldsymbol{r})]$
a suitable pseudopotential function. The pseudopotential
 ${\it\psi}_{{\it\zeta}}({\it\rho}_{{\it\zeta}})$
is taken in the form originally suggested by Shan & Chen (Reference Shan and Chen1993, Reference Shan and Chen1994),
 $$\begin{eqnarray}{\it\psi}_{{\it\zeta}}[{\it\rho}_{{\it\zeta}}(\boldsymbol{r})]={\it\rho}_{0}[1-\text{e}^{-{\it\rho}_{{\it\zeta}}(\boldsymbol{r})/{\it\rho}_{0}}].\end{eqnarray}$$
The parameter
 ${\it\rho}_{0}$
actually marks the density value above which non-ideal effects come into play. The prefactor
 ${\it\rho}_{0}$
in (3.5) is used to ensure that for small densities the pseudopotential is linear in the density
 ${\it\rho}_{{\it\zeta}}$
. Despite their inherent microscopic simplicity, the above dynamic rules are able to promote a host of non-trivial collective effects (Benzi et al.
Reference Benzi, Sbragaglia, Succi, Bernaschi and Chibbaro2009, Reference Benzi, Bernaschi, Sbragaglia and Succi2010). The model gives direct access to the hydrodynamical variables, i.e. density and velocity fields, as well as the local (in time and space) stress tensor in the system, the latter characterised by both the viscous as well as the elastic contributions (see (A 1) in appendix A, where both contributions appear).
A direct link between the ‘micromechanics’ of the model (3.3)–(3.4) and the more familiar ‘macroscopic’ concepts of surface tension and disjoining pressure can actually be established (Benzi et al.
Reference Benzi, Sbragaglia, Succi, Bernaschi and Chibbaro2009; Sbragaglia et al.
Reference Sbragaglia, Benzi, Bernaschi and Succi2012). To quantify the emergence of the surface tension and the disjoining pressure, one has to consider a 1D problem. For a planar 1D interface, developing along
 $y$
, the surface tension
 ${\rm\Gamma}$
is a direct consequence of the pressure tensor developing at the non-ideal interface and is computed as the integral of the mismatch between the normal (
 $N$
) and tangential (
 $T$
) components of the pressure tensor. This surface tension scales as (Benzi et al.
Reference Benzi, Sbragaglia, Succi, Bernaschi and Chibbaro2009)
 $$\begin{eqnarray}{\rm\Gamma}=\int _{-\infty }^{+\infty }[P_{N}-P_{T}(y)]\text{d}y\propto -\mathop{\sum }_{{\it\zeta}=A,B}\tilde{\mathscr{G}}_{{\it\zeta}{\it\zeta}}\int \left(\frac{\text{d}{\it\psi}_{{\it\zeta}}}{\text{d}y}\right)^{2}\text{d}y-\frac{\mathscr{G}_{AB}}{{\it\rho}_{0}^{2}}\int \frac{\text{d}{\it\rho}_{A}}{\text{d}y}\frac{\text{d}{\it\rho}_{B}}{\text{d}y}\text{d}y.\end{eqnarray}$$
The quantity
 $\tilde{\mathscr{G}}_{{\it\zeta}{\it\zeta}}=\mathscr{G}_{{\it\zeta}{\it\zeta},1}+(12/7)\mathscr{G}_{{\it\zeta}{\it\zeta},2}$
comes from a proper combination of the coefficients in the competing interactions. For repulsive interactions (
 $\mathscr{G}_{AB}>0$
), the second integral on the right-hand side is positive definite, since
 $(\text{d}{\it\rho}_{A}/\text{d}y)(\text{d}{\it\rho}_{B}/\text{d}y)<0$
. With a proper use of the competing interactions, one can choose
 $\tilde{\mathscr{G}}_{{\it\zeta}{\it\zeta}}>0$
, and the first term on the right-hand side of (3.6) is negative definite; consequently, one can decrease the surface tension by simply increasing
 ${\it\rho}_{0}$
. The decrease of the surface tension goes together with an increase of the disjoining pressure at the thin-film interface. The emergence of a positive disjoining pressure
 ${\rm\Pi}_{d}(h)$
can be controlled in numerical simulations by considering a thin film with two non-ideal flat interfaces, separated by the distance
 $h$
. Following Bergeron (Reference Bergeron1999), we write the relation for the corresponding tensions
 $$\begin{eqnarray}{\rm\Gamma}_{f}(h)=2{\rm\Gamma}+\int _{{\rm\Pi}_{d}(h=\infty )}^{{\rm\Pi}_{d}(h)}h\text{d}{\rm\Pi}_{d},\end{eqnarray}$$
where
 ${\rm\Gamma}_{f}$
is the overall film tension. Similarly to what we have done for the surface tension
 ${\rm\Gamma}$
, the expression for
 ${\rm\Gamma}_{f}$
is known in terms of the mismatch between the normal and tangential components of the pressure tensor (Derjaguin Reference Derjaguin1989; Toshev Reference Toshev2008),
 ${\rm\Gamma}_{f}=\int _{-\infty }^{+\infty }[P_{N}-P_{T}(y)]\text{d}y$
, where, in our model,
 $P_{N}-P_{T}(y)=p_{s}(y)$
can be computed analytically (Shan Reference Shan2008; Sbragaglia & Belardinelli Reference Sbragaglia and Belardinelli2013). All the detailed expressions for the interaction stress tensor are reported in appendix A. From the relation
 $s(h)={\rm\Gamma}_{f}(h)-2{\rm\Gamma}$
it is possible to compute the disjoining pressure: a simple differentiation of
 $s(h)$
permits us to determine the first derivative of the disjoining pressure,
 $\text{d}s(h)/\text{d}h=h\text{d}{\rm\Pi}_{d}/\text{d}h$
. This information, supplemented with the boundary condition
 ${\rm\Pi}_{d}(h\rightarrow \infty )=0$
, allows us to completely determine the disjoining pressure of the film (Sbragaglia et al.
Reference Sbragaglia, Benzi, Bernaschi and Succi2012). In figure 4 we analyse some of these features quantitatively. In particular, we consider the interaction parameters
 $\mathscr{G}_{AB}=0.405$
,
 $\mathscr{G}_{{\it\zeta}{\it\zeta},1}=-9.0$
,
 $\mathscr{G}_{{\it\zeta}{\it\zeta},2}=8.1$
, with
 ${\it\rho}_{0}$
chosen in the interval
 $[0.72:0.84]$
. All numbers are reported in lbu (lattice Boltzmann units). As we can see, by increasing the value of
 ${\it\rho}_{0}$
, we enhance the energy barrier at the onset of the film rupture.
This figure shows the emergence of the disjoining pressure in the lattice Boltzmann model (see (3.1) with phase separating interactions obtained with a repulsive (
 $r$
) force (see (3.3)) supplemented with competing interactions (see (3.4)), whose role is to provide a mechanism for frustration (
 $F$
). The use of phase separating interaction is associated with a negative disjoining pressure. Competing interactions stabilise thin films with the emergence of a positive disjoining pressure, the latter tunable with the parameter
 ${\it\rho}_{0}$
in (3.3) and (3.4). Further details can be found in Sbragaglia et al. (Reference Sbragaglia, Benzi, Bernaschi and Succi2012).

The body force
 $\boldsymbol{F}_{b}=\boldsymbol{F}_{P}+\boldsymbol{F}_{D}$
in (3.1) contains the driving due to the imposed (constant) pressure gradient (
 $\boldsymbol{F}_{P}$
) and a drag force (
 $\boldsymbol{F}_{D}$
) mimicking the friction between bubbles and confining plastic plates, as in the experimental set-up (figure 1). This drag force is taken to be proportional to the velocity vector, as in Janiaud, Weaire & Hutzler (Reference Janiaud, Weaire and Hutzler2006), i.e.
 $$\begin{eqnarray}\boldsymbol{F}_{D}=-{\it\beta}\boldsymbol{v}.\end{eqnarray}$$
Once the droplets are stabilised with a positive disjoining pressure, different packing fractions and polydispersity of the dispersed phase can be achieved. In the numerical simulations presented in the following sections, the fraction of the continuous phase (i.e. the equivalent of the liquid fraction in the foam experiment) is kept approximately equal to
 ${\it\phi}_{l}\approx 7.5\,\%$
.
It must be stressed that the micromechanics of the model, (3.3)–(3.4), is not meant to mimic ‘specific’ physico-chemical details of foams, but rather to model a ‘generic’ soft glassy material with non-ideal fluid behaviour (e.g. non-ideal equation of state, phase separation), interfacial phenomena (e.g. surface tension, disjoining pressure) and hydrodynamics. Mesoscale soft glassy models are indeed frequently used to characterise the rheology and cooperativity flow of soft glassy materials (Durian Reference Durian1997; Mansard et al.
Reference Mansard, Colin, Chaudhuri and Bocquet2013). As already stressed in the introduction, our numerical model represents a step forward in this direction, in that it provides two basic advantages whose combination is not common. On one hand, it provides a realistic structure of the emulsion droplets, like for instance the surface evolver method (Reinelt & Kraynik Reference Reinelt and Kraynik2000; Kern et al.
Reference Kern, Weaire, Martin, Hutzer and Cox2004; Cox & Janiaud Reference Cox and Janiaud2008); at the same time, due to its built-in properties, the model gives direct access to dissipative mechanisms in thin films. This latter point will be further discussed and detailed in appendix B. We also remark that the viscous ratio between the dispersed phase and the continuous phase is kept fixed to
 ${\it\chi}=1$
(the simulation parameters are summarised in table 2). This choice is dictated by purely numerical reasons, as numerical instabilities emerge when one considers the case of a viscous ratio much smaller or much larger than unity. Nevertheless, we can use this as an advantage in our joint numerical and experimental study, as it offers the possibility to test the robustness of the experimental findings versus a change in the viscous ratio
 ${\it\chi}$
between the dispersed phase and the continuous phase. It is also comforting that the latest version of our GPU code (Bernaschi et al.
Reference Bernaschi, Rossi, Benzi, Sbragaglia and Succi2009) allows for the simulation of emulsion droplets and their statistics in a reasonable amount of time. The current version runs on multiple GPUs and, by using a combination of CUDA streams and non-blocking MPI primitives, it is able to overlap completely the computation within the bulk of the domain with the exchange of the boundaries. Most simulations have been carried out on Kepler ‘Titan’ GPUs, featuring 14 streaming multiprocessors, with a total of 2688 cores running at 0.88 GHz and a memory bandwidth exceeding
 $200~\text{GB}~\text{s}^{-1}$
. Each run, spanning multimillion time steps for every single set of parameters, takes less than 12 h, to be compared with a running time of about 30 h on previous generation (Fermi) GPU cards. The speedup with respect to a highly tuned (multicore) CPU version is above one order of magnitude. To develop a systematic analysis of plastic events, we perform a Voronoi tessellation (using the voro
 $++$
libraries (Rycroft et al.
Reference Rycroft, Grest, Landry and Bazant2006)) constructed from the centres of mass of the droplets, a representation that is particularly well suited to the capture and visualisation of plastic events in the form of droplet rearrangements and topological changes occurring within the material.
Summary of the simulation parameters. The first six rows refer to runs in the Poiseuille (P
 $\#$
) flow set-up, while the last two are relative to the Couette (C
 $\#$
) flow numerical simulations. Other relevant parameters (kept fixed among the various runs) are the fraction of the continuous phase
 ${\it\phi}_{l}\approx 7.5\,\%$
and the viscous ratio between the dispersed and the continuous phase
 ${\it\chi}=1$
. The interaction parameters for the phase separating interactions (see (3.3)) and competing interactions (see (3.4)) are given in the text and the pseudopotential reference density is
 ${\it\rho}_{0}=0.83$
. The disjoining pressure for these interaction parameters is characterised in figure 4. The total integration time is
 $T_{tot}=2\times 10^{6}$
lbu (lattice Boltzmann units), of which
 $T_{ss}=1.25\times 10^{6}$
steps are in the steady state.

4. Results and discussion
4.1. Experimental velocity profiles
The velocity profiles measured for five experiments are shown in figure 5. They are quite flat at the centre (
 $y=0$
) of the channel, although not completely flat as would be expected from a Herschel–Bulkley model, and decrease significantly close to the sidewalls (
 $y=\pm H/2$
). They are well fitted by an exponential profile, which is written either as
 $v(y)=v_{1}(1+A\cosh y/L_{v})$
or as
 $$\begin{eqnarray}v(y)=v_{0}\frac{\cosh (H/2L_{v})-{\it\alpha}_{s}-(1-{\it\alpha}_{s})\cosh (y/L_{v})}{\cosh (H/2L_{v})-1},\end{eqnarray}$$
with a set of three fitting parameters,
 $v_{0}$
,
 ${\it\alpha}_{s}$
and
 $L_{v}$
, which have a clear physical meaning:
 $v_{0}=v(y=0)$
is the centreline velocity and
 $$\begin{eqnarray}{\it\alpha}_{s}=\frac{v(y=\pm H/2)}{v_{0}}\end{eqnarray}$$
is the relative slip, i.e. the ratio of the slip velocity to the centreline velocity. The parameter
 $L_{v}$
, which we will henceforth call the velocity localisation length, describes the range of influence of the wall friction on the velocity profile. The values of the best fitting parameters are reported in table 1. Among the four experiments run at constant control parameters except for the driving flow rate, the relative slip tends to decrease, and the velocity localisation length to increase, at increasing flow rate, except for the experiment at a flow rate of
 $102.5~\text{ml}~\text{min}^{-1}$
. The fifth experiment is run at a larger liquid fraction that the other four: it shows a larger relative slip, and a smaller velocity localisation length, than the experiment with comparable flow rate.
Velocity profiles for the five experiments described in table 1. These data have been symmetrised with respect to the centreline; the error bars denote the standard deviation resulting from this averaging. Each dashed line is a fit of the data by the law (4.1); see table 1 for the values of the best fitting parameters. The dotted line is a fit of the data series ▵ with the law (C 6) accounting for nonlinear wall friction and bulk viscous stress; see § 4.2.2 and appendix C for details. It is barely distinguishable from the dashed line.

4.2. Comparison of experiments with a local model
4.2.1. Linear model
To provide analytical reference equations for the velocity profiles and place our work in the context of the existing literature, we start by comparing our velocity profiles with local models. We start by a comparison to the model of Janiaud et al. (Reference Janiaud, Weaire and Hutzler2006), which we adapt to the Poiseuille configuration and to slip boundary conditions. It is appealing, due to its simplicity, and it has been shown to reproduce well experimental velocity profiles for foam flows in plane Couette geometry (Katgert et al.
Reference Katgert, Möbius and Van Hecke2008). The model considers a steady unidimensional flow, where inertia vanishes identically. We also neglect end effects, and hence assume that the flow is streamwise invariant. Hence, the flow profile is written as
 $\boldsymbol{v}=v(y)\boldsymbol{e}_{x}$
, with
 $x$
the streamwise direction and
 $y$
the spanwise one. The streamwise invariance implies a constant pressure drop:
 $\boldsymbol{{\rm\nabla}}P=\boldsymbol{e}_{x}\text{d}P/\text{d}x$
with
 $\text{d}P/\text{d}x$
constant. From depth-averaged momentum conservation,
 $\mathbf{0}=\boldsymbol{{\rm\nabla}}\cdot {\bf\sigma}-\boldsymbol{{\rm\nabla}}P+2\boldsymbol{f}_{D}/h$
, with
 $\boldsymbol{f}_{D}$
the foam/wall friction force per unit area. The term
 $2\boldsymbol{f}_{D}/h$
is analogous to the drag force
 $\boldsymbol{F}_{D}$
used in the simulations (see § 3). Taking the streamwise component of the equation, we obtain
 $$\begin{eqnarray}0=\frac{\text{d}{\it\sigma}}{\text{d}y}-\frac{\text{d}P}{\text{d}x}+\frac{2}{h}f_{D},\end{eqnarray}$$
where
 ${\it\sigma}$
is the
 $xy$
component of the stress tensor. The model assumes that for the shear stress
 ${\it\sigma}={\it\sigma}_{Y}f_{e}({\it\gamma}/{\it\gamma}_{Y})+{\it\eta}\dot{{\it\gamma}}$
, with
 ${\it\gamma}$
the shear strain and
 $\dot{{\it\gamma}}=\text{d}v/\text{d}y$
the shear rate,
 ${\it\sigma}_{Y}$
and
 ${\it\gamma}_{Y}$
the yield stress and the yield strain respectively,
 ${\it\eta}$
the plastic viscosity of the foam and
 $f_{e}$
a function quantifying the variation of the elastic stress with the shear strain. Insertion of this model in (4.3) yields
 $$\begin{eqnarray}0={\it\eta}\frac{\text{d}^{2}v}{\text{d}y^{2}}+{\it\sigma}_{Y}\frac{\text{d}{\it\gamma}}{\text{d}y}f_{e}^{\prime }\left(\frac{{\it\gamma}}{{\it\gamma}_{Y}}\right)-\frac{\text{d}P}{\text{d}x}-{\it\beta}v,\end{eqnarray}$$
where
 $f_{D}$
is assumed to be proportional to the velocity, and
 ${\it\beta}$
is defined as
 $$\begin{eqnarray}f_{D}=-{\textstyle \frac{1}{2}}h{\it\beta}v.\end{eqnarray}$$
If we neglect the elastic term for simplicity, we obtain the following ordinary differential equation (ODE) for the velocity:
 $$\begin{eqnarray}\frac{\text{d}^{2}v}{\text{d}y^{2}}-\frac{v}{L_{0}^{2}}=-\frac{v_{1}}{L_{0}^{2}},\end{eqnarray}$$
where we have introduced the friction length
 $$\begin{eqnarray}L_{0}=\sqrt{\frac{{\it\eta}}{{\it\beta}}}.\end{eqnarray}$$
A first boundary condition comes from the fact that
 $x$
is a symmetry axis, hence
 $v$
is an even function of
 $y$
, and we recover the exponential profile (4.1),
 $v(y)=v_{1}[1+A\cosh (y/L_{0})]$
, first proposed in § 4.1 as an empirical fit, with the characteristic velocity
 $v_{1}$
proportional to the pressure gradient:
 $$\begin{eqnarray}v_{1}=-{\displaystyle \frac{L_{0}^{2}}{{\it\eta}}}{\displaystyle \frac{\text{d}P}{\text{d}x}}.\end{eqnarray}$$
As shown in § 4.1, it turns out that this functional form, with
 $v_{1}$
,
 $A$
and
 $L_{0}$
as free fitting parameters, reproduces very well the experimental profiles (figure 5). However, there is a second boundary condition, coming from a force balance of the foam at the sidewall:
 $$\begin{eqnarray}{\it\sigma}=\pm f_{D}\quad \text{at}\;y=\pm H/2,\end{eqnarray}$$
which differs from the original model of Janiaud et al. (Reference Janiaud, Weaire and Hutzler2006), who assumed no-slip boundary conditions. A macroscopic visible signature of the balance (4.9) is the angle between the bubble edges and the sidewalls in figure 1(b), see also Dollet & Cantat (Reference Dollet and Cantat2010). Inserting (4.5), (4.7) and (4.8) in (4.3),
 $\text{d}{\it\sigma}/\text{d}y={\it\beta}(v-v_{1})$
, hence
 $$\begin{eqnarray}{\it\sigma}(y=H/2)={\it\beta}v_{1}A\int _{0}^{H/2}\cosh \frac{y}{L_{0}}\text{d}y={\it\beta}v_{1}AL_{0}\sinh \frac{H}{2L_{0}},\end{eqnarray}$$
which we insert in (4.9) to obtain
 $$\begin{eqnarray}v(y)=v_{1}\left[1-\frac{h\cosh (y/L_{0})}{2L_{0}\sinh (H/2L_{0})+h\cosh (H/2L_{0})}\right]\!.\end{eqnarray}$$
This new functional form, with
 $v_{0}$
and
 $L_{0}$
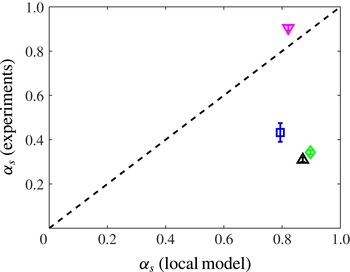
as free fitting parameters, does not fit the experiments. Actually, there is a major discrepancy with the relative slip; setting
 $y=H/2$
in (4.11) and using the definition (4.2) of the relative slip, we obtain
 $$\begin{eqnarray}{\it\alpha}_{s}={\displaystyle \frac{1}{1+{\displaystyle \frac{h}{2L_{0}}}\coth {\displaystyle \frac{H}{2L_{0}}}}}\simeq \frac{1}{1+h/2L_{0}},\end{eqnarray}$$
since
 $\coth (H/2L_{0})$
is very close to 1 for all our experiments. This prediction is much higher than the experimental value, except for the wet foam (figure 6).

4.2.2. Nonlinear model
A possible reason for the discrepancy lies in the fact that the wall friction force is nonlinear in velocity, and the bulk viscous stress is nonlinear in shear rate. Following Denkov et al. (Reference Denkov, Tcholakova, Golemanov, Ananthapadmanabhan and Lips2009), the bulk viscous stress for a 3D foam equals
 ${\it\sigma}=({\it\tau}_{\mathit{VF}}+{\it\tau}_{\mathit{VS}}){\rm\Gamma}/R$
(film and interface contribution respectively), with
 $R$
the bubble radius and
 $$\begin{eqnarray}{\it\tau}_{\mathit{VF}}=1.16\text{Ca}_{\dot{{\it\gamma}}}^{0.47}(1-{\it\phi}_{l})^{5/6}\frac{(0.26-{\it\phi}_{l})^{0.1}}{{\it\phi}_{l}^{0.5}},\end{eqnarray}$$
with
 $\text{Ca}_{\dot{{\it\gamma}}}={\it\mu}\dot{{\it\gamma}}R/{\rm\Gamma}$
the capillary number (
 ${\it\mu}=10^{-3}~\text{Pa}~\text{s}$
: bulk viscosity) and
 ${\it\tau}_{\mathit{VS}}=9.8{\rm\pi}B\dot{{\it\gamma}}^{0.18}$
with
 $B=2.12\times 10^{-3}$
S.I. an empirical constant for SLES/CAPB/MAc foams. Using as orders of magnitude from the experiments
 $R\approx \sqrt{A/{\rm\pi}}\approx 2~\text{mm}$
and
 $\dot{{\it\gamma}}\approx v_{0}/L_{v}\approx 1~\text{s}^{-1}$
, we obtain
 ${\it\tau}_{\mathit{VS}}/{\it\tau}_{\mathit{VF}}\approx 0.6$
, hence the film term is dominant, although the surface term is not negligible. Keeping only the film term for simplicity, (4.13) shows that the bulk viscous stress scales sublinearly with the shear rate:
 $$\begin{eqnarray}{\it\sigma}={\it\eta}^{\prime }\dot{{\it\gamma}}^{0.47},\end{eqnarray}$$
where the prefactor
 ${\it\eta}^{\prime }$
(primed to distinguish it from the plastic viscosity in the linear law used in § 4.2.1) is
 $$\begin{eqnarray}{\it\eta}^{\prime }=1.16\frac{{\it\mu}^{0.47}{\rm\Gamma}^{0.53}}{R^{0.53}}(1-{\it\phi}_{l})^{5/6}\frac{(0.26-{\it\phi}_{l})^{0.1}}{{\it\phi}_{l}^{0.5}}.\end{eqnarray}$$
For solutions giving rigid interfaces, like SLES/CAPB/MAc (Golemanov et al. Reference Golemanov, Denkov, Tcholakova, Vethamuthu and Lips2008), foam/wall friction is quantified by the force per unit area (or equivalently the wall stress) (Denkov et al. Reference Denkov, Tcholakova, Golemanov, Ananthapadmanabhan and Lips2009):
 $$\begin{eqnarray}f_{D}=\frac{{\rm\Gamma}}{R}\left[1.25C_{IF}\sqrt{\text{Ca}^{\ast }}\sqrt{\frac{F_{3}}{1-F_{3}}}+2.1C_{IL}(\text{Ca}^{\ast })^{2/3}\right]F_{3},\end{eqnarray}$$
with two empirical constants
 $C_{IF}=3.7$
and
 $C_{IL}=3.5$
,
 $\text{Ca}^{\ast }={\it\mu}v/{\rm\Gamma}$
another capillary number, and
 $$\begin{eqnarray}F_{3}=\sqrt{1-3.2\left(\frac{1-{\it\phi}_{l}}{{\it\phi}_{l}}+7.7\right)^{-1/2}}.\end{eqnarray}$$
For
 $v\approx 1~\text{cm}~\text{s}^{-1}$
, the ratio of the second term to the first term in (4.16) is 5, hence we neglect the second term. Equation (4.16) then shows that the wall friction force scales sublinearly with the velocity:
 $$\begin{eqnarray}f_{D}=-{\textstyle \frac{1}{2}}h{\it\beta}^{\prime }\sqrt{v},\end{eqnarray}$$
with the following value of the wall friction constant (primed to distinguish it from its counterpart in the linear law used in § 4.2.1):
 $$\begin{eqnarray}{\it\beta}^{\prime }=\frac{2.5C_{IF}}{hR}\sqrt{{\rm\Gamma}{\it\mu}}\sqrt{\frac{F_{3}^{3}}{1-F_{3}}}.\end{eqnarray}$$
Like in § 4.2.1, see (4.7), we can construct a characteristic length from
 ${\it\eta}^{\prime }$
and
 ${\it\beta}^{\prime }$
. To do so, it is convenient to replace the exponent 0.47 by
 $1/2$
in (4.14), recasting the factor
 $\dot{{\it\gamma}}^{0.03}$
in the definition (4.15) of
 ${\it\eta}^{\prime }$
; this factor is almost constant, and equal to 1, for all our experiments. The characteristic length is then
 $L_{0}^{\prime }=({\it\eta}^{\prime }/{\it\beta}^{\prime })^{2/3}$
. It is the extension the friction length
 $L_{0}$
defined in (4.7) to the case of the nonlinear wall friction (4.18) and the nonlinear bulk viscous stress (4.14). We compute with all the experimental values of the parameters appearing in (4.15) and (4.19):
 $L_{0}^{\prime }=1.9~\text{mm}$
for
 ${\it\phi}_{l}=4.8\,\%$
and 2.7 mm for
 ${\it\phi}_{l}=16.9\,\%$
. These orders of magnitude are compatible with the experimental values of the localisation lengths (table 1).
The effect of nonlinear wall friction and bulk viscous stress on the velocity profile has been theoretically considered for Couette flows (Weaire et al. Reference Weaire, Hutzler, Langlois and Clancy2008; Weaire, Clancy & Hutzler Reference Weaire, Clancy and Hutzler2009), but not for Poiseuille flows. Therefore, in appendix C, we compute analytically the velocity profile using the nonlinear laws (4.14) and (4.18), and we show that the role of these nonlinearities on the velocity is negligible.
Hence, the present model is too simple to capture wall slip in our experiments, which suggests that the role of elastic stresses is crucial. This is qualitatively supported by the fact that the only experiment for which the local model is quite accurate in predicting the amount of slip is for a wet foam, which stores less elastic energy (Cantat et al.
Reference Cantat, Cohen-Addad, Elias, Graner, Höhler, Pitois, Rouyer and Saint-Jalmes2013). To further support this idea, we plot the shear component of the elastic stress and the normal elastic stress difference in figure 7; see the end of § 2.2 for the measurement of the elastic stress. The shear elastic stress is indeed about four times weaker for the wet foam than for the four other experiments. For these experiments at given bubble area and liquid fraction, its variation across the channel is as follows: towards the centre of the channel, although with a significant asymmetry for some experiments, there is a zone of quasilinear increase around
 ${\it\sigma}_{xy}^{e}=0$
. The width of this region decreases slightly at increasing flow rate. Outside this region, the elastic shear stress plateaus to a value that does not depend much on the flow rate. Interestingly, there is still some velocity variation, and a significant plastic activity, outside those regions where the shear elastic stress plateaus. Except for the experiment for the wet foam, the normal elastic stress difference
 ${\it\sigma}_{xx}^{e}-{\it\sigma}_{yy}^{e}$
is always positive, i.e. the bubbles are elongated streamwise, an effect that is clearly visible in figure 1(b). It tends to increase towards the wall.
(a) Shear component of the elastic stress and (b) normal difference of the elastic stress for the five experiments described in table 1.

Equation (4.3) expresses the balance between the driving pressure gradient, the foam/wall friction and the gradient of elastic and bulk viscous stresses. Close to the middle of the channel, the velocity gradient is very weak, hence bulk viscous stress is negligible, and the gradient of the shear elastic stress is roughly constant (figure 7). It is interesting to compare the value of this gradient
 $\text{d}{\it\sigma}_{xy}^{e}/\text{d}y$
and the pressure gradient
 $\text{d}P/\text{d}x$
. Their experimental values are reported in table 1; the pressure gradient is always larger than the gradient of shear elastic stress, the missing part being wall friction. This is a major difference from Poiseuille experiments in 3D channels (Goyon et al.
Reference Goyon, Colin, Ovarlez, Ajdari and Bocquet2008, Reference Goyon, Colin and Bocquet2010; Geraud et al.
Reference Geraud, Bocquet and Barentin2013), where wall friction is absent. This prevents us from measuring directly the spanwise stress from the pressure gradient, in contrast to the aforementioned studies.
4.3. Numerical simulations and comparison with the fluidity model
We have shown the inaccuracies of a local model without elasticity in capturing our experimental data thanks to the inspection of the boundary condition at the wall. To test the effects of elasticity, local visco-elastoplastic models could be used (Cheddadi et al.
Reference Cheddadi, Saramito and Graner2012), but it is not straightforward to deduce testable predictions from them. Moreover, elasticity is not the only aspect of the physics of foams and dense emulsions missed by a model such as that discussed in the previous sections. It has recently been shown in experiments of flowing emulsions in microchannels (Goyon et al.
Reference Goyon, Colin, Ovarlez, Ajdari and Bocquet2008) that in order to capture the velocity profiles, the intrinsic non-local rheology of such soft glassy materials must be considered. Non-locality is due to the long-ranged relaxation of stress released after a plastic rearrangement occurs. Building on previous models for soft glassy rheology (Sollich et al.
Reference Sollich, Lequeux, Hébraud and Cates1997; Hébraud & Lequeux Reference Hébraud and Lequeux1998; Sollich Reference Sollich1998), Bocquet et al. (Reference Bocquet, Colin and Ajdari2009) proposed a kinetic elastoplastic model (KEP henceforth) to describe explicitly spatial interactions among plastic events. The continuum limit of KEP suggests that the local relation between the stress
 ${\it\sigma}$
and the rate of strain
 $\dot{{\it\gamma}}$
is dictated by a kind of inverse effective viscosity, the fluidity
 $$\begin{eqnarray}f=\frac{\dot{{\it\gamma}}}{{\it\sigma}},\end{eqnarray}$$
which obeys a non-local diffusion–relaxation equation of the form
 $$\begin{eqnarray}{\it\xi}^{2}{\rm\Delta}f(\boldsymbol{x})+f_{b}({\it\sigma}(\boldsymbol{x}))-f(\boldsymbol{x})=0,\end{eqnarray}$$
where
 $f_{b}$
is the bulk fluidity, i.e. the value of the fluidity in the absence of spatial cooperativity (
 ${\it\xi}=0$
), and
 ${\it\xi}$
is the cooperativity length scale within the material due to spatial heterogeneities and represents, basically, a correlation length for the fluidity itself, as can be easily derived from (4.21). The other important result of KEP is that such fluidity must be expected to be proportional to the rate of occurrence of plastic events,
 $R_{T1}$
, in the system, i.e.
 $f\propto R_{T1}$
. Furthermore, KEP encompasses the effect of elasticity through the non-local relaxation of elastic stress induced by plastic events. There is, however, a difficulty in testing this non-local model against our experiments. The role of wall friction is crucial in experiments, whereas the non-local model has been set up and tested in its absence, although recent studies have considered the coupled role of wall friction and non-locality (Barry, Weaire & Hutzler Reference Barry, Weaire and Hutzler2011; Scagliarini, Dollet & Sbragaglia Reference Scagliarini, Dollet and Sbragaglia2014). Indeed, wall friction complicates the stress profile across the channel, as discussed in § 4.2, and it is thus not straightforward to extract relevant flow curves
 ${\it\sigma}(\dot{{\it\gamma}})$
from our experiments. Hence, it is interesting to run numerical simulations, where the wall friction can be set off and tuned at will.
Various sets of numerical simulations have been performed in the
 $(F_{P},{\it\beta}^{\ast })$
parameter space (see table 2 for the numerical values used), where
 ${\it\beta}^{\ast }$
is the value of the friction coefficient (3.8)
 ${\it\beta}$
made dimensionless with the channel width
 $H$
and viscosity
 ${\it\eta}$
, i.e.
 $$\begin{eqnarray}{\it\beta}^{\ast }=\frac{{\it\beta}H^{2}}{{\it\eta}}=\frac{H^{2}}{L_{0}^{2}},\end{eqnarray}$$
where the last equality is based on the definition of the friction length
 $L_{0}$
given in (4.7). A flat velocity profile in the bulk is shown by all curves (figure 8), including the case with
 ${\it\beta}^{\ast }=0$
, witnessing the presence of a non-trivial bulk rheology (Goyon et al.
Reference Goyon, Colin, Ovarlez, Ajdari and Bocquet2008, Reference Goyon, Colin and Bocquet2010; Geraud et al.
Reference Geraud, Bocquet and Barentin2013). We also report the experimental velocity profile with flow rate
 $152.5~\text{ml}~\text{min}^{-1}$
(see table 1), just to show that we are able to tune the wall friction parameters in the numerics to achieve the same localisation as observed in the experiments for which an equivalent wall friction parameter
 ${\it\beta}^{\ast }\approx 250$
can be estimated based on the wall friction constant (4.19) and the plastic viscosity (4.15). While a direct comparison of experiments and numerics in terms of velocity profiles is complicated by boundary conditions (as observed in the experimental data of figure 5, slippage is found to occur at the surfaces of the experiments, while the numerical simulations are performed by imposing no-slip at the walls), an important insight will be provided by simulations for validation of the picture of the plastic flow (§ 4.4) for different values of the wall friction constant, which is a freely tunable parameter in the numerical model, unlike in experiments.
Numerical velocity profiles, normalised by the centreline velocity
 $v_{0}$
, for different values of the wall friction constant. Data from three sets of simulations are shown with dimensionless wall friction parameter (see (4.22))
 ${\it\beta}^{\ast }=0,100,200$
(runs P1-3 in table 2); the experimental velocity profile with flow rate
 $152.5~\text{ml}~\text{min}^{-1}$
(see table 1) is also reported to show that we are able to tune the wall friction parameters in the numerics to achieve the same localisation as observed in the experiments. The equivalent
 ${\it\beta}^{\ast }$
in the experiments is
 ${\it\beta}^{\ast }\approx 250$
(see text for details). On the abscissae, the
 $y$
-location across the channel has been normalised by the total channel height.

Figure 9(a) indeed provides some indications that wall friction does not seem to dramatically affect the distribution of plastic events. There we plot the rate of plastic rearrangements, normalised by the total number of events, from experiments and numerics (for the three values of
 ${\it\beta}^{\ast }$
). The data show a moderately good collapse onto each other. At a given driving pressure drop, an increase in wall friction results in a decrease of the total number of plastic events
 $N_{T_{1}}$
. We could estimate the number
 $N_{T_{1}}$
in the numerical simulations, and it is reported in figure 9(b): for the same simulation time (see caption of table 2) plastic events diminish from
 $N_{T_{1}}\sim 6\times 10^{3}$
to
 $N_{T_{1}}\sim 2\times 10^{3}$
on increasing
 ${\it\beta}^{\ast }$
from 0 to 400. A similar trend is observed for the centreline velocity, which is reported in the inset of figure 9(b). To make this statement more quantitative, we notice that the overall decrease in the number of plastic events can be well captured by the function
 $$\begin{eqnarray}G({\it\beta}^{\ast })=\frac{2b^{2}N_{T1}^{(0)}}{{\it\beta}^{\ast }}\left[1-\frac{1}{\cosh (\sqrt{{\it\beta}^{\ast }}/b)}\right]\!,\end{eqnarray}$$
a scaling behaviour that can be obtained from the expression of the centreline velocity,
 $v_{0}$
in (4.1), with
 ${\it\alpha}_{s}=0$
(no-slip boundary condition for the numerics). The parameter
 $N_{T1}^{(0)}$
in (4.23) sets the number of plastic events in the limit
 ${\it\beta}^{\ast }\rightarrow 0$
, whereas the argument
 $\sqrt{{\it\beta}^{\ast }}/b$
of the hyperbolic function in (4.23) is inversely proportional to the velocity localisation length. The choice of (4.23) as a fitting function is suggested by the consideration that the total number of plastic events is dominated by events occurring in boundary regions where the shear stress is approximately constant and, hence, the fluidity
 $f$
is basically proportional to the shear rate
 $\dot{{\it\gamma}}$
. Consequently, as the number of events is, by definition, equal to the integral of the corresponding rate
 $R_{T1}$
, and since
 $R_{T1}\propto f\approx |\dot{{\it\gamma}}|$
, we can assume that
 $G({\it\beta}^{\ast })\propto \int _{0}^{H/2}|\dot{{\it\gamma}}|\text{d}y$
, which equals the centreline velocity. Interestingly, the estimate of
 $b$
that we obtain from a best fit procedure (
 $b\approx 6.0$
) is greater than the estimate of
 $b$
based on the friction length
 $L_{0}$
in (4.7), which would yield
 $b=2$
. This is an indication that the velocity localisation length in the numerical simulations is larger than the localisation length induced by the wall friction,
 $\boldsymbol{F}_{D}=-{\it\beta}\boldsymbol{v}$
. This is not a surprise, because our numerical simulations had already confirmed the presence of a cooperativity length scale (Sbragaglia et al.
Reference Sbragaglia, Benzi, Bernaschi and Succi2012), without wall friction, in a Couette flow set-up. This supports the idea that an effective localisation length results from the combination of the friction length and the cooperativity length (Barry et al.
Reference Barry, Weaire and Hutzler2011), an issue that we will further explore in § 4.4.
(a) Plot of the rate of plastic rearrangements as a function of
 $y$
: experiments (▵ in table 1) are compared with numerical data from runs P1–3. The dashed line indicates the function
 $\sinh (y/L_{v})/y$
, representing the fluidity profile based on the hyperbolic cosine fit of the velocity profile (see § 4.1 for details). Numerical data have been symmetrised. (b) Total number of T1s as a function of
 ${\it\beta}^{\ast }$
from the simulations; the dashed line is a fit with the functional form given in (4.23). Inset: the centreline velocity versus
 ${\it\beta}^{\ast }$
is reported.

The study of the spatial distribution in the number of plastic events and the simultaneous analysis of the localisation in the velocity profiles allows us to bridge the gap between the ‘microscopic’ details of local irreversible plastic rearrangements and the macroscopic flow. A connection between the rate of T1 events and the fluidity field is indeed visible in figure 9(a). The dashed line indicates
 $\sinh (y/L_{v})/y$
, which is the ‘synthetic’ fluidity profile (up to an unessential numerical scaling factor) based on the hyperbolic cosine fit of the velocity profile (see § 4.1) and a linear variation of the shear stress across the channel. Interestingly, a significant plastic activity remains towards the centre of the channel, and it is well correlated to the fluidity field, which remains finite in such regions, whereas the strain rate goes to zero. Moreover, a closer inspection reveals that the decrease in the number of plastic events is affected by the wall friction constant
 ${\it\beta}^{\ast }$
, with a steeper decrease associated with the larger
 ${\it\beta}^{\ast }$
. Figure 9 calls, therefore, for a deeper understanding with regard to the link between the rate of plastic events and the local flow properties.
4.4. Localisation lengths: comparison of plasticity and shear rate
To go further, we choose to explore the connection between the rate of plastic events and the local flow properties, by looking at the relationship between the localisation length of the velocity profiles,
 $L_{v}$
, and the localisation length of the number of plastic events,
 $L_{p}$
(henceforth called the plastic localisation length). This connection enables us to compare experiments and simulations, despite their different boundary conditions. The velocity localisation length
 $L_{v}$
is estimated by a hyperbolic cosine function
 $\cosh (y/L_{v})$
, from which the decay length
 $L_{v}$
is extracted (see § 4.1). Simultaneously, the plastic localisation length
 $L_{p}$
is computed out of an exponential fit of the symmetrised rate of plastic events close to the wall (figure 10
a). Since our numerical simulations have already confirmed the presence of a cooperativity length scale (Sbragaglia et al.
Reference Sbragaglia, Benzi, Bernaschi and Succi2012) without wall friction, they are good candidates to complement the experimental findings, showing how the spatial distribution of plastic events is affected by a change in the wall friction parameter
 ${\it\beta}$
. Hence, in figure 10(b) we also look at the localisation in the numerics, by fixing the pressure gradient and changing
 ${\it\beta}^{\ast }$
, something that cannot be easily done in experiments with the data at hand. At fixed pressure gradient, we show the log–lin plot of the rate of plastic events from simulations with different
 ${\it\beta}^{\ast }$
. The extracted
 $L_{p}$
is found to be a decreasing function of
 ${\it\beta}^{\ast }$
.
(a) Decimal logarithm of the density of T1s per unit time and area as a function of
 $y/H$
, for the five experiments described in table 1. These data have been symmetrised with respect to the centreline; the error bars denote the standard deviation resulting from this averaging. Data below
 $10^{-4}~\text{mm}^{-2}~\text{s}^{-1}$
are not shown because they are statistically irrelevant (fewer than 10 T1s counted per bin per experiment). Dashed lines represent the linear fits of the data. (b) Data from numerical simulations complement the experimental results reported in (a). In particular, to appreciate the effect of wall friction at fixed pressure gradient, we show the log–lin plot of the rate of plastic events from simulations P1–3 (fixed pressure drop and different
 ${\it\beta}^{\ast }$
) close to the bottom wall (the dashed lines represent best linear fits of the data). Inset: plastic localisation length as a function of the wall friction parameter
 ${\it\beta}^{\ast }$
.

In figure 11 we report a scatter plot of the velocity localisation length
 $L_{v}$
versus the plastic localisation length
 $L_{p}$
for three sets of data: experiments (symbols as in table 1), simulations with fixed pressure drop and various values of
 ${\it\beta}^{\ast }$
(filled squares) and simulations with fixed
 ${\it\beta}^{\ast }=200$
and various pressure drops (filled circles). Figure 11 shows that the two localisation lengths are indeed close to each other. The fact that the values of
 $L_{p}$
and
 $L_{v}$
agree confirms the picture of the ‘plastic flow’; it is also compatible with the fact that the rate of plastic events and the fluidity seem to be proportional (§ 4.3).
Barry et al. (Reference Barry, Weaire and Hutzler2011) have combined the local model presented in § 4.2 with the non-local equation for the fluidity field (4.21), in the case of a Couette flow with linear laws for the bulk viscous stress and wall friction (as in § 4.2.1). They predicted that the velocity localisation length is an increasing function of both the cooperativity length
 ${\it\xi}$
and the friction length
 $L_{0}$
defined by (4.7). Here, this theoretical prediction can be tested for the first time versus our experiments and simulations. Some care is required in doing so because of the nonlinear nature of wall friction and bulk viscous stress in experiments, and the difference between Couette and Poiseuille flows. However, we have shown in appendix C that the effect of nonlinear wall friction and bulk viscous stress is very weak. Since the velocity localisation length
 $L_{v}$
is much smaller than the channel width and the stress does not vary much across the localisation zone, the comparison with the Couette predictions is relevant. For this reason, we also repeated some numerical simulations in a Couette flow geometry (see table 2). The associated data nicely collapse onto the same master curve, stressing even more the robustness of our findings on changing the load conditions.
In experiments, at given liquid fraction and bubble area, the localisation length
 $L_{v}$
increases with increasing flow rate. Moreover, table 1 shows that at given flow rate (up to 5 %) and bubble area, the localisation length is lower for a wet foam than for a dry one, in qualitative agreement with the experiments of Goyon et al. (Reference Goyon, Colin and Bocquet2010) on emulsions. We tried to get further insight into these findings, by investigating the local effect of single plastic events, namely by measuring the way they affect displacement and elastic stress fields on their surroundings, in the spirit of Picard et al. (Reference Picard, Ajdari, Lequeux and Bocquet2004) in theory and Chen, Desmond & Weeks (Reference Chen, Desmond and Weeks2012) in experiments. Our hope was to directly evidence the cooperativity length as the range of influence on displacement and stress fields of single plastic events, and whether it would depend on the flow rate and liquid fraction. However, the data turned out to be too noisy to address this specific question, in particular because of the difficulty in properly subtracting the effect of the mean flow. Hence, we cannot directly measure the cooperativity length. In some sense, the work presented here bypasses the problem of an accurate measurement of the cooperativity length, but directly explores the link between localisation phenomena in the velocity profiles and the rate of plastic events.
Scatter plot of the velocity localisation length
 $L_{v}$
(computed from a hyperbolic cosine fit of the velocity profiles) versus the plastic localisation length
 $L_{p}$
(computed out of an exponential fit of the symmetrised rate of plastic events across the channel) for three sets of data: experiments (symbols as in table 1), simulations of Poiseuille flow with fixed pressure drop and various values of the normalised friction coefficient
 ${\it\beta}^{\ast }$
(filled squares) and with fixed
 ${\it\beta}^{\ast }=200$
and various pressure drops (filled circles) and simulations of Couette flow at two values of
 ${\it\beta}^{\ast }$
(filled triangles); both lengths are normalised by the mean bubble diameter. The dashed line is the
 $L_{v}=L_{p}$
curve.

4.5. Orientation of the plastic events
The importance of plastic rearrangements has been stressed in that the occurrence of these events induces long-range correlations within the soft glassy material. It is also acknowledged (Picard et al.
Reference Picard, Ajdari, Lequeux and Bocquet2004; Schall, Weitz & Spaepen Reference Schall, Weitz and Spaepen2007) that T1s possess a non-trivial angular structure with a quadrupolar topology. It seems, then, reasonable to argue that for a full understanding of the way they determine non-local effects inside the system, not only the distribution of their locations in space but also their orientational properties need to be addressed. Therefore, we go further with the description of plastic events, and study their angular statistics from experiments and simulations. More precisely, focusing on the four bubbles involved in a T1, we define as a disappearing link the segment connecting the centres of the two bubbles that were in contact before the event (and which are then far apart), and as an appearing link the connector between the other two bubble centres (see also § 2 and figures 2 and 3). We then measure for each event the angle between such links and the flow direction. We have observed that the angles are reversed between the two sides of the channel, consistently with the fact that
 $y=0$
is an axis of symmetry. Therefore, we choose to analyse the statistics of the quantities
 ${\it\theta}_{d}={\it\theta}_{d}^{\prime }\,\text{sign}\,(y)$
and
 ${\it\theta}_{a}=\,{\it\theta}_{a}^{\prime }\text{sign}\,(y)$
(see figure 1 for the sign convention of
 $y$
). We did not observe a significant variation of the distribution of these angles across the channel, hence we analyse the distributions of these angles for all T1s, whatever their location across the channel. Figure 12 shows the histogram of
 ${\it\theta}_{d}$
and
 ${\it\theta}_{a}$
for one experiment and one simulation, while the average and standard deviations of these quantities are summarised for all experiments in table 1. This analysis shows that T1s have preferential orientations:
 ${\it\theta}_{d}$
is peaked around 0.5 rad, with a small dispersion, and
 ${\it\theta}_{a}$
around
 $-0.7~\text{rad}$
, with a larger dispersion. The average values do not depend significantly on the flow rate. For the wet foam,
 ${\it\theta}_{d}$
is larger, and
 ${\it\theta}_{a}$
slightly smaller.
Normalised distributions of the orientations of plastic events. Distributions of appearing (a) and disappearing (b) centre-to-centre links of bubbles involved in rearrangements are shown, from experiment (thin blue line) and simulations (thick red line). Here,
 ${\it\theta}$
denotes the angle formed by the link and the direction of the flow, i.e. the positive
 $x$
-axis. Following Princen (Reference Princen1983), the extreme values are found for a dry foam at liquid fraction
 ${\it\phi}_{l}=0$
and are indicated with a dashed line.

We now derive some reference values for these angles from a microstructural analysis. Since our foams are rather monodisperse, it is interesting to use the simple geometrical model of a sheared 2D hexagonal foam (Princen Reference Princen1983) (see also Khan & Armstrong Reference Khan and Armstrong1986). In this model, the unit cell drawn in dashed lines in figure 13 is sheared, and the locations of the vertices are computed to comply with the equilibrium rule that the three edges meet at equal angles. To account for the finite liquid fraction, the vertices are decorated with Plateau borders for which the radius
 $R_{P}$
is an increasing function of the liquid fraction (figure 13
a),
 ${\it\phi}_{l}=(2\sqrt{3}-{\rm\pi})R_{P}^{2}/A_{h}$
, with
 $A_{h}$
the area of one hexagon. This structure can be sheared up to the point where two neighbouring Plateau borders meet, which defines the onset of the T1 (figure 13
b).
Portions of unsheared (a) and sheared (b) hexagonal foam. The strain is defined as
 ${\it\gamma}=4{\rm\Delta}x/3a$
.

The two angles
 ${\it\theta}_{a}^{\prime }$
and
 ${\it\theta}_{d}^{\prime }$
can be computed from simple geometry, when the two Plateau borders come into contact (figure 13
b). The length of the edge
 $c$
between the two bubbles about to detach is equal to
 $R_{P}$
. Now, at a given strain
 ${\it\gamma}$
, this length is (Khan & Armstrong Reference Khan and Armstrong1986)
 $c=a(1-{\it\gamma}\sqrt{3}/2)/\sqrt{4+{\it\gamma}^{2}}$
, where
 $a$
is the side length of the undeformed hexagon. Setting
 $c=R_{P}$
in the latter equation yields the strain
 ${\it\gamma}_{c}$
at which the T1 occurs;
 ${\it\gamma}_{c}$
is a decreasing function of
 $R_{P}$
. Moreover,
 ${\it\gamma}=1/\sqrt{3}-\cot {\it\alpha}$
(Princen Reference Princen1983), and we compute from geometrical considerations in figure 13(b)
 $\cot {\it\theta}_{d}^{\prime }=2/\sqrt{3}-\cot {\it\alpha}=1/\sqrt{3}+{\it\gamma}_{c}$
and
 $\cot {\it\theta}_{a}^{\prime }=-2/\sqrt{3}-\cot {\it\alpha}=-\sqrt{3}+{\it\gamma}_{c}$
. Qualitatively, these two expressions show that both
 ${\it\theta}_{d}^{\prime }$
and
 ${\it\theta}_{a}^{\prime }$
are decreasing functions of
 ${\it\gamma}_{c}$
, hence increasing functions of
 $R_{P}$
, hence of the liquid fraction. The extreme values are found for a dry foam at
 ${\it\phi}_{l}=0$
, for which
 ${\it\gamma}_{c}=2/\sqrt{3}$
(Princen Reference Princen1983), and for the jamming transition for which
 ${\it\gamma}_{c}=0$
:
 ${\it\theta}_{d}^{\prime }$
varies between
 ${\rm\pi}/6\simeq 0.52$
rad (dry foam) and
 ${\rm\pi}/3\simeq 1.05~\text{rad}$
( jamming transition), and
 ${\it\theta}_{a}^{\prime }$
between
 $-{\rm\pi}/3$
and
 $-{\rm\pi}/6$
. Our measured values are indeed in these ranges. The values of the disappearing angles for the four experiments with
 ${\it\phi}_{l}=4.8\,\%$
are compatible (within experimental dispersion) with the dry foam prediction, the latter indicated with a vertical dashed line in figure 12. The predicted increase of the angles with liquid fraction is compatible with the experiments for
 ${\it\theta}_{d}$
, but not for
 ${\it\theta}_{a}$
.
Although the model by Princen (Reference Princen1983) gives useful reference values, it is difficult to make a more quantitative comparison based on liquid fraction, because the distribution of liquid is specific to each system. In simulations, the films between droplets are thick, and contain a significant proportion of the liquid. In experiments, the distribution of water is complex because of the 3D structure of the bubbles; there is relatively more water close to the confining plates than in the midplane in between (Cox & Janiaud Reference Cox and Janiaud2008). The hexagonal foam model of Princen (Reference Princen1983) is a good approximation of the structure of our experimental foams across the midplane between the top and bottom confining plates, but the liquid fraction across this plane, relevant in the hexagonal model, is significantly lower than the experimental liquid fraction. Moreover, the measurement of the appearing angle is less precise than that of the disappearing one, because the relaxation of the four bubbles after a T1 is fast; hence, the measurements made on the image after the topological rearrangement may not be representative of the configuration at the instant of a T1. This also explains why the dispersion is larger for
 ${\it\theta}_{a}$
than for
 ${\it\theta}_{d}$
.
5. Conclusions
We have reported on the first experimental study measuring the rate of plastic events in Poiseuille flows of foams. Experiments have been supplemented by numerical simulations, capable of capturing the realistic foam structure and of incorporating naturally the expected mesoscopic dynamics. We have addressed the relation between T1 distribution and macroscopic rheology and revealed a link between the localisation length scale of the velocity profiles and that of plastic events across the channel, confirming the relevance of cooperativity for foams (Katgert et al. Reference Katgert, Tighe, Möbius and van Hecke2010). The use of numerical simulations allowed us to study in a controlled way (something not easily feasible in the experiments) the effect of wall friction, helping to confirm its role in the emergence of an extra localisation for the velocity profiles, as predicted theoretically (Barry et al. Reference Barry, Weaire and Hutzler2011). Our study highlighted that the elasticity gives rise to a complex near-to-wall dynamics which calls for focused studies both experimentally (in the spirit of the recent work by Mansard et al. (Reference Mansard, Bocquet and Colin2014)) and numerically, and for a more refined theoretical modelling of the boundary conditions. Finally, unprecedented results on the distribution of the orientation of plastic events showed – with good agreement between experiments and numerics – that there is a non-trivial correlation with the underlying local shear strain. This suggests that more complex forms for the propagators invoked in theoretical models of soft glassy materials (Bocquet et al. Reference Bocquet, Colin and Ajdari2009) may be needed, with an explicit angular structure, especially in the situation of non-homogeneous stress (as it is for Poiseuille flows).
Acknowledgements
The authors kindly acknowledge funding from the European Research Council under the EU Seventh Framework Programme (FP7/2007-2013)/ERC Grant Agreement no. 279004. We acknowledge computational support from CINECA (IT). M.S. and A.S. gratefully acknowledge M. Bernaschi for computational support and F. Bonaccorso for helpful visualisations of the flowing emulsions from the numerical simulations.
Appendix A. Pressure tensor in LBM simulations
In this appendix we provide the technical details for the lattice Boltzmann pressure tensor used in (3.6) and (3.7) to compute both the surface tension and the disjoining pressure at the non-ideal interface. Given the mechanical model for the lattice interactions described in (3.3)–(3.5), an exact lattice theory is available (Shan Reference Shan2008; Sbragaglia & Belardinelli Reference Sbragaglia and Belardinelli2013) which allows us to connect the interaction forces to the lattice pressure tensor. The exact pressure tensor is given by
 $$\begin{eqnarray}\unicode[STIX]{x1D64B}_{{\it\alpha}{\it\beta}}=\mathop{\sum }_{{\it\zeta},i}f_{{\it\zeta}i}c_{i}^{{\it\alpha}}c_{i}^{{\it\beta}}+\mathop{\sum }_{{\it\zeta}}P_{{\it\zeta},{\it\alpha}{\it\beta}}^{(int)}.\end{eqnarray}$$
The term
 $\sum _{{\it\zeta},i}f_{{\it\zeta}i}c_{i}^{{\it\alpha}}c_{i}^{{\it\beta}}$
represents an internal contribution to the pressure tensor and its out-of-equilibrium contribution gives the dissipative stress in the system (Gross et al.
Reference Gross, Moradi, Zikos and Varnik2011), while
 $P_{{\it\zeta},{\it\alpha}{\it\beta}}^{(int)}$
is a contribution coming from the interactions and embeds the elastic stresses of the system. As for
 $P_{{\it\zeta},{\it\alpha}{\it\beta}}^{(int)}$
, we can separately write the contributions coming from the repulsive (
 $r$
) phase separating interactions (see (3.3)), and those coming from competing interactions providing a mechanism of frustration (
 $F$
) (see (3.4)),
 $$\begin{eqnarray}P_{{\it\zeta},{\it\alpha}{\it\beta}}^{(int)}=P_{{\it\zeta},{\it\alpha}{\it\beta}}^{(r)}+P_{{\it\zeta},{\it\alpha}{\it\beta}}^{(F,1)}+P_{{\it\zeta},{\it\alpha}{\it\beta}}^{(F,2)}+P_{{\it\zeta},{\it\alpha}{\it\beta}}^{(F,4)}+P_{{\it\zeta},{\it\alpha}{\it\beta}}^{(F,5)}+P_{{\it\zeta},{\it\alpha}{\it\beta}}^{(F,8)}.\end{eqnarray}$$
The contribution coming from the phase separating interactions
 $P_{{\it\zeta},{\it\alpha}{\it\beta}}^{(r)}$
is (Sbragaglia & Belardinelli Reference Sbragaglia and Belardinelli2013)
 $$\begin{eqnarray}P_{{\it\zeta},{\it\alpha}{\it\beta}}^{(r)}=\frac{\mathscr{G}_{AB}}{2}{\it\rho}_{{\it\zeta}}(\boldsymbol{r})\mathop{\sum }_{i=1-8}w(|\boldsymbol{c}_{i}|^{2}){\it\rho}_{{\it\zeta}^{\prime }}(\boldsymbol{r}+\boldsymbol{c}_{i})c_{i}^{{\it\alpha}}c_{i}^{{\it\beta}},\quad {\it\zeta}^{\prime }\neq {\it\zeta},\end{eqnarray}$$
while the contributions coming from the frustrating interactions are given by various terms,
 $P_{{\it\zeta},{\it\alpha}{\it\beta}}^{(F,1)}$
,
 $P_{{\it\zeta},{\it\alpha}{\it\beta}}^{(F,2)}$
,
 $P_{{\it\zeta},{\it\alpha}{\it\beta}}^{(F,4)}$
,
 $P_{{\it\zeta},{\it\alpha}{\it\beta}}^{(F,5)}$
,
 $P_{{\it\zeta},{\it\alpha}{\it\beta}}^{(F,8)}$
, labelled with the number of the ‘energy shell’ (see table 3),
 $$\begin{eqnarray}\displaystyle & \displaystyle P_{{\it\zeta},{\it\alpha}{\it\beta}}^{(F,1)}=\frac{\mathscr{G}_{{\it\zeta}{\it\zeta},1}}{2}{\it\psi}_{{\it\zeta}}(\boldsymbol{r})\mathop{\sum }_{i=1-4}w(1){\it\psi}_{{\it\zeta}}(\boldsymbol{r}+\boldsymbol{c}_{i})c_{i}^{{\it\alpha}}c_{i}^{{\it\beta}}+\frac{\mathscr{G}_{{\it\zeta}{\it\zeta},2}}{2}{\it\psi}_{{\it\zeta}}(\boldsymbol{r})\mathop{\sum }_{i=1-4}p(1){\it\psi}_{{\it\zeta}}(\boldsymbol{r}+\boldsymbol{c}_{i})c_{i}^{{\it\alpha}}c_{i}^{{\it\beta}}, & \displaystyle \nonumber\\ \displaystyle & & \displaystyle\end{eqnarray}$$
 $$\begin{eqnarray}\displaystyle & \displaystyle P_{{\it\zeta},{\it\alpha}{\it\beta}}^{(F,2)}=\frac{\mathscr{G}_{{\it\zeta}{\it\zeta},1}}{2}{\it\psi}_{{\it\zeta}}(\boldsymbol{r})\mathop{\sum }_{i=5-8}w(2){\it\psi}_{{\it\zeta}}(\boldsymbol{r}+\boldsymbol{c}_{i})c_{i}^{{\it\alpha}}c_{i}^{{\it\beta}}+\frac{\mathscr{G}_{{\it\zeta}{\it\zeta},2}}{2}{\it\psi}_{{\it\zeta}}(\boldsymbol{r})\mathop{\sum }_{i=5-8}p(2){\it\psi}_{{\it\zeta}}(\boldsymbol{r}+\boldsymbol{c}_{i})c_{i}^{{\it\alpha}}c_{i}^{{\it\beta}}, & \displaystyle \nonumber\\ \displaystyle & & \displaystyle\end{eqnarray}$$
 $$\begin{eqnarray}\displaystyle P_{{\it\zeta},{\it\alpha}{\it\beta}}^{(F,4)} & = & \displaystyle \frac{\mathscr{G}_{{\it\zeta}{\it\zeta},2}}{4}\mathop{\sum }_{i=9-12}w(4){\it\psi}_{{\it\zeta}}(\boldsymbol{r}){\it\psi}_{{\it\zeta}}(\boldsymbol{r}+\boldsymbol{c}_{i})c_{i}^{{\it\alpha}}c_{i}^{{\it\beta}}\nonumber\\ \displaystyle & & \displaystyle +\,\frac{\mathscr{G}_{{\it\zeta}{\it\zeta},2}}{4}\mathop{\sum }_{i=9-12}w(4){\it\psi}_{{\it\zeta}}\left(\boldsymbol{r}-\frac{\boldsymbol{c}_{i}}{2}\right){\it\psi}_{{\it\zeta}}\left(\boldsymbol{r}+\frac{c_{i}}{2}\right)c_{i}^{{\it\alpha}}c_{i}^{{\it\beta}},\end{eqnarray}$$
 $$\begin{eqnarray}\displaystyle P_{{\it\zeta},{\it\alpha}{\it\beta}}^{(F,5)} & = & \displaystyle \frac{\mathscr{G}_{{\it\zeta}{\it\zeta},2}}{4}{\it\psi}_{{\it\zeta}}(\boldsymbol{r})\mathop{\sum }_{i=13-20}p(5){\it\psi}_{{\it\zeta}}(\boldsymbol{r}+\boldsymbol{c}_{i})c_{i}^{{\it\alpha}}c_{i}^{{\it\beta}}\nonumber\\ \displaystyle & & \displaystyle +\,\frac{\mathscr{G}_{{\it\zeta}{\it\zeta},2}}{4}p(5)\left[{\it\psi}_{{\it\zeta}}(\boldsymbol{r}+\boldsymbol{c}_{5}){\it\psi}_{{\it\zeta}}(\boldsymbol{r}+\boldsymbol{c}_{3})+{\it\psi}_{{\it\zeta}}(\boldsymbol{r}+\boldsymbol{c}_{1}){\it\psi}_{{\it\zeta}}(\boldsymbol{r}+\boldsymbol{c}_{7})\right]c_{13}^{{\it\alpha}}c_{13}^{{\it\beta}}\nonumber\\ \displaystyle & & \displaystyle +\,\frac{\mathscr{G}_{{\it\zeta}{\it\zeta},2}}{4}p(5)\left[{\it\psi}_{{\it\zeta}}(\boldsymbol{r}+\boldsymbol{c}_{5}){\it\psi}_{{\it\zeta}}(\boldsymbol{r}+\boldsymbol{c}_{4})+{\it\psi}_{{\it\zeta}}(\boldsymbol{r}+\boldsymbol{c}_{2}){\it\psi}_{{\it\zeta}}(\boldsymbol{r}+\boldsymbol{c}_{7})\right]c_{14}^{{\it\alpha}}c_{14}^{{\it\beta}}\nonumber\\ \displaystyle & & \displaystyle +\,\frac{\mathscr{G}_{{\it\zeta}{\it\zeta},2}}{4}p(5)\left[{\it\psi}_{{\it\zeta}}(\boldsymbol{r}+\boldsymbol{c}_{2}){\it\psi}_{{\it\zeta}}(\boldsymbol{r}+\boldsymbol{c}_{8})+{\it\psi}_{{\it\zeta}}(\boldsymbol{r}+\boldsymbol{c}_{6}){\it\psi}_{{\it\zeta}}(\boldsymbol{r}+\boldsymbol{c}_{4})\right]c_{15}^{{\it\alpha}}c_{15}^{{\it\beta}}\nonumber\\ \displaystyle & & \displaystyle +\,\frac{\mathscr{G}_{{\it\zeta}{\it\zeta},2}}{4}p(5)\left[{\it\psi}_{{\it\zeta}}(\boldsymbol{r}+\boldsymbol{c}_{6}){\it\psi}_{{\it\zeta}}(\boldsymbol{r}+\boldsymbol{c}_{1})+{\it\psi}_{{\it\zeta}}(\boldsymbol{r}+\boldsymbol{c}_{3}){\it\psi}_{{\it\zeta}}(\boldsymbol{r}+\boldsymbol{c}_{8})\right]c_{16}^{{\it\alpha}}c_{16}^{{\it\beta}},\end{eqnarray}$$
 $$\begin{eqnarray}\displaystyle P_{{\it\zeta},{\it\alpha}{\it\beta}}^{(F,8)} & = & \displaystyle \frac{\mathscr{G}_{{\it\zeta}{\it\zeta},2}}{4}{\it\psi}_{{\it\zeta}}(\boldsymbol{r})\mathop{\sum }_{i=21-24}p(8){\it\psi}_{{\it\zeta}}(\boldsymbol{r}+\boldsymbol{c}_{i})c_{i}^{{\it\alpha}}c_{i}^{{\it\beta}}\nonumber\\ \displaystyle & & \displaystyle +\,\frac{\mathscr{G}_{{\it\zeta}{\it\zeta},2}}{4}\mathop{\sum }_{i=21-24}p(8){\it\psi}_{{\it\zeta}}\left(\boldsymbol{r}-\frac{\boldsymbol{c}_{i}}{2}\right){\it\psi}_{{\it\zeta}}\left(\boldsymbol{r}+\frac{\boldsymbol{c}_{i}}{2}\right)c_{i}^{{\it\alpha}}c_{i}^{{\it\beta}}.\end{eqnarray}$$
Links and weights of the two-belt 25-speed lattice (Shan et al.
Reference Shan, Yuan and Chen2006; Benzi et al.
Reference Benzi, Sbragaglia, Succi, Bernaschi and Chibbaro2009) for all interactions given in (3.3) and (3.4). The first-belt lattice velocities are indicated with
 $i=1\dots 8$
, while the second-belt ones are indicated with
 $i=9\dots 24$
. Here,
 $p(|\boldsymbol{c}_{i}|^{2})$
or
 $w(|\boldsymbol{c}_{i}|^{2})$
indicates the weight associated with the
 $i$
th link in the various interactions. The weights associated with the velocity at rest,
 $w(0)$
and
 $p(0)$
, are chosen to enforce a unitary normalisation,
 $\sum _{i=0}^{i=8}w(|\boldsymbol{c}_{i}|^{2})=1$
and
 $\sum _{i=0}^{i=24}p(|\boldsymbol{c}_{i}|^{2})=1$
.

Appendix B. Friction forces in LBM simulations
In this appendix, we propose benchmark tests for the LBM introduced in § 3 with regard to the viscous drag forces acting on individual bubbles. Friction properties in the thin films between neighbouring droplets/bubbles or between droplets/bubbles and the walls are important for both foams and concentrated emulsions (Denkov et al.
Reference Denkov, Tcholakova, Golemanov, Subramanian and Lips2006, Reference Denkov, Tcholakova, Golemanov, Ananthapadmanabhan and Lips2008, Reference Denkov, Tcholakova, Golemanov, Ananthapadmanabhan and Lips2009; Katgert et al.
Reference Katgert, Latka, Möbius and Van Hecke2009). We start by presenting benchmark computations for the motion of droplets in confined channels with changing capillary number. The drag force on a single bubble that slides past a solid wall was first investigated by Bretherton (Reference Bretherton1961) and has recently received renewed attention (Denkov et al.
Reference Denkov, Tcholakova, Golemanov, Subramanian and Lips2006, Reference Denkov, Tcholakova, Golemanov, Ananthapadmanabhan and Lips2008; Katgert et al.
Reference Katgert, Latka, Möbius and Van Hecke2009). For a single bubble sliding past a solid wall, Bretherton (Reference Bretherton1961) showed that the drag force scales nonlinearly with the capillary number, Ca, defined in terms of the dynamic viscosity of the carrier liquid and the relative velocity between the bubble and the wall. The lubrication approximation yields the velocity
 $U$
of the bubble immersed in the Poiseuille flow to be approximated at leading order in
 $$\begin{eqnarray}U/U_{\mathit{av}}=1+1.29(3\text{Ca})^{2/3},\end{eqnarray}$$
where
 $U_{\mathit{av}}$
represents the mean flow velocity. This theory can be readily modified for a 2D bubble placed in the Poiseuille flow between two parallel plates (Afkhami, Leshansky & Renardy Reference Afkhami, Leshansky and Renardy2011),
 $$\begin{eqnarray}U/U_{\mathit{av}}=1+0.643(3\text{Ca})^{2/3}.\end{eqnarray}$$
An extension to droplets with an arbitrary viscosity has been considered in various papers (Schwartz, Princen & Kiss Reference Schwartz, Princen and Kiss1986; Hodges, Jensen & Rallison Reference Hodges, Jensen and Rallison2004). For a very viscous drop, results analogous to the previous equations can readily be found, as the coefficients 1.29 and 0.643 in (B 1) and (B 2) respectively are reduced by a factor of
 $2^{-1/3}\approx 0.794$
, yielding
 $$\begin{eqnarray}U/U_{\mathit{av}}=1+1.023(3\text{Ca})^{2/3}\end{eqnarray}$$
for a bubble in a cylindrical capillary and
 $$\begin{eqnarray}U/U_{\mathit{av}}=1+0.511(3\text{Ca})^{2/3}\end{eqnarray}$$
for a 2D bubble in a channel. In figure 14 we present our benchmark tests for (B 4). As we can see, the predicted scaling for the velocity of the bubble agrees well with the theoretical prediction, confirming a scaling exponent in the capillary number close to
 $2/3$
and a numerical coefficient in between the case of a very viscous droplet and the case of a bubble.
Velocity of a 2D droplet in a confined channel. The viscous ratio between the dispersed phase and the continuous phase is set to
 ${\it\chi}=1$
in all the numerical simulations. In panel (a) we report two snapshots associated with two different capillary numbers. Blue/white (dark/light) colours indicate regions with majority of the dispersed/continuous phase. The droplet is driven by a constant pressure gradient. The average velocity of the droplet is normalised with respect to the mean flow velocity (
 $U_{\mathit{av}}$
) in the inlet of the channel. The scaling laws for both a very viscous (
 ${\it\chi}\gg 1$
) droplet (Schwartz et al.
Reference Schwartz, Princen and Kiss1986; Hodges et al.
Reference Hodges, Jensen and Rallison2004) and a bubble in a 2D channel are reported (Bretherton Reference Bretherton1961; Afkhami et al.
Reference Afkhami, Leshansky and Renardy2011). The velocity scaling agrees well with the theoretical prediction, confirming a scaling exponent in the capillary number close to
 $2/3$
and a numerical coefficient in between the two extreme cases (
 ${\it\chi}\gg 1$
and
 ${\it\chi}\ll 1$
).

We now continue by presenting benchmark tests for the drag force between two bubbles sliding past each other,
 $F_{bb}$
. Some recent works (Denkov et al.
Reference Denkov, Tcholakova, Golemanov, Subramanian and Lips2006, Reference Denkov, Tcholakova, Golemanov, Ananthapadmanabhan and Lips2008; Katgert et al.
Reference Katgert, Latka, Möbius and Van Hecke2009) have provided evidence that the viscous drag force scales like
 $F_{bb}\propto \text{Ca}^{{\it\xi}}$
, with a scaling exponent
 ${\it\xi}$
between
 $1/2$
and
 $2/3$
. This is an important test for our numerical simulations: LBM modelling of two-phase flows is intrinsically a diffuse interface method and involves a finite thickness of the interface between the two liquids and related model parameters. The values of the interface thickness and capillary number need to be larger than the ones suggested by physical considerations in order to make the simulations affordable (Komrakova et al.
Reference Komrakova, Shardt, Eskin and Derksen2013; Magaletti et al.
Reference Magaletti, Picano, Chinappi, Marino and Casciola2013). Nevertheless, the structure and the dynamical properties of the emulsion droplets that we reproduce in the numerical simulations share non-trivial features with the experiments (Goyon et al.
Reference Goyon, Colin, Ovarlez, Ajdari and Bocquet2008, Reference Goyon, Colin and Bocquet2010; Mansard et al.
Reference Mansard, Bocquet and Colin2014). It is therefore of great importance to investigate the scaling laws associated with friction properties, to show that they are realistic and in line with those measured in experiments. In particular, we measure the viscous drag forces between bubbles directly by rheological experiments where two rows of ordered bubbles are sheared past each other. Results are reported in figure 15. A scaling law in the velocity difference
 $U$
between the two rows of droplets is confirmed,
 $F_{bb}\sim \text{Ca}^{{\it\xi}}$
, with a scaling exponent between
 $1/2$
and
 $2/3$
.
Viscous drag force
 $F_{bb}$
between droplets measured directly in rheological experiments where two rows of ordered bubbles are sheared past each other. The packing fraction of the continuous phase into the dispersed phase is changed in the interval
 ${\it\phi}_{l}=[0.06:0.18]$
. Panel (a) reports three snapshots of the simulations for two different packing fractions. Blue/white (dark/light) colours indicate regions with majority of the dispersed/continuous phase. A scaling law in the capillary number is found,
 $F_{bb}\sim \text{Ca}^{{\it\xi}}$
, with a scaling exponent between
 $1/2$
and
 $2/3$
.

Appendix C. Velocity profile in the nonlinear local model
In this appendix, we provide a solution of the velocity profile, obeying momentum conservation (4.3) with the nonlinear law (4.18) for wall friction, and (4.14) for the bulk viscous stress but with a velocity exponent
 $1/2$
instead of 0.47, an approximation that enables us to provide an analytical solution. Hence, we solve for
 $-H/2\leqslant y\leqslant 0$
(so that
 $\text{d}v/\text{d}y\geqslant 0$
):
 $$\begin{eqnarray}0={\it\eta}^{\prime }\frac{\text{d}}{\text{d}y}\left[\left(\frac{\text{d}v}{\text{d}y}\right)^{1/2}\right]-\frac{\text{d}P}{\text{d}x}-{\it\beta}^{\prime }v^{1/2},\end{eqnarray}$$
with boundary conditions
 $\text{d}v/\text{d}y=0$
at
 $y=0$
and
 ${\it\sigma}=-f_{D}$
at
 $y=-H/2$
.
We make space and velocity dimensionless,
 $\bar{y}=y/L_{0}^{\prime }$
and
 $\bar{v}=v/V$
, by rescaling them by
 $$\begin{eqnarray}L_{0}^{\prime }=({\it\eta}^{\prime }/{\it\beta}^{\prime })^{2/3},\quad V=[(-\text{d}P/\text{d}y)/{\it\beta}]^{2}.\end{eqnarray}$$
Then the problem becomes
 $$\begin{eqnarray}0=(\bar{v}_{\bar{y}}^{1/2})_{\bar{y}}-\bar{v}^{1/2}+1,\end{eqnarray}$$
where the subscript denotes derivation, with boundary conditions
 $\bar{v}_{\bar{y}}=0$
at
 $\bar{y}=0$
and
 $\bar{v}_{\bar{y}}^{1/2}=h\bar{v}^{1/2}/2L_{0}^{\prime }$
at
 $\bar{y}=-H/2L_{0}^{\prime }$
. The velocity thus obeys an autonomous equation of the form
 $\bar{v}_{\bar{y}\bar{y}}=F(\bar{v},\bar{v}_{\bar{y}})$
, with
 $F(x,y)=-2(1-\sqrt{x})\sqrt{y}$
. This kind of equation can be recast as a first-order ODE (Polyanin & Zaitsev Reference Polyanin and Zaitsev2003) by setting
 $\bar{w}=\bar{v}_{\bar{y}}$
; it then becomes
 $\bar{w}_{\bar{v}}=F(\bar{v},\bar{w})/\bar{w}=-2(1-\sqrt{\bar{v}})/\sqrt{\bar{w}}$
. The latter is an ODE with separable variables, which is thus simply integrated to yield
 $2\bar{w}^{3/2}/3=-2\bar{v}+4\bar{v}^{3/2}/3+\text{const}$
. The boundary condition at
 $\bar{y}=0$
imposes that
 $\bar{w}=0$
for the unknown centreline velocity
 $\bar{v}_{0}$
, hence
 $2\bar{w}^{3/2}/3=-2(\bar{v}-\bar{v}_{0})+4(\bar{v}^{3/2}-\bar{v}_{0}^{3/2})/3$
. In the limit
 $2L_{0}^{\prime }/H\ll 1$
, which is a good approximation in our experiments, the dimensionless bulk viscous stress term
 $(\bar{v}_{\bar{y}}^{1/2})_{\bar{y}}$
is negligible at the centre of the channel. Hence after (C 3),
 $\bar{v}_{0}=1$
. Therefore,
 $$\begin{eqnarray}\bar{v}_{\bar{y}}=\left[\left(1-\sqrt{\bar{v}}\right)^{2}\left(2\sqrt{\bar{v}}+1\right)\right]^{2/3}.\end{eqnarray}$$
The right-hand side is a decreasing function over
 $[0,1]$
, equal to 1 for
 $\bar{v}=0$
and to 0 for
 $\bar{v}=1$
. Therefore, for a given value of the parameter
 $h/2L_{0}^{\prime }$
, the boundary condition at the wall,
 $\bar{v}_{\bar{y}}=h^{2}\bar{v}/4L_{0}^{\prime 2}$
, admits a single solution for
 $\bar{v}$
and
 $\bar{v}_{\bar{y}}$
at
 $\bar{y}=-H/2L_{0}^{\prime }$
. The velocity field obeying (C 3) and the boundary condition then obeys the implicit equation
 $\bar{y}+H/2L_{0}^{\prime }={\rm\Phi}(\bar{v})-{\rm\Phi}(\bar{v}_{s})$
, with
 $$\begin{eqnarray}\displaystyle {\rm\Phi}(\bar{v}) & = & \displaystyle \int \frac{\text{d}\bar{v}}{\left[\left(1-\sqrt{\bar{v}}\right)^{2}\left(2\sqrt{\bar{v}}+1\right)\right]^{2/3}}\nonumber\\ \displaystyle & = & \displaystyle \left(1+2\sqrt{\bar{v}}\right)^{1/3}\left[\frac{2}{(1-\sqrt{\bar{v}})^{1/3}}+2^{1/3}3^{2/3}~_{2}F_{1}\left(\frac{1}{3},-\frac{2}{3},\frac{4}{3},\frac{1}{3}\left(1+2\sqrt{\bar{v}}\right)\right)\right.\nonumber\\ \displaystyle & & \displaystyle \left.-\,\frac{2^{1/3}3^{2/3}}{12}_{2}F_{1}\left(\frac{4}{3},\frac{1}{3},\frac{7}{3},\frac{1}{3}\left(1+2\sqrt{\bar{v}}\right)\right)\right]\!,\end{eqnarray}$$
where
 $_{2}F_{1}$
denotes the hypergeometric function. With this complicated expression, fitting of the experimental data is not easy. A simpler alternative consists in developing (C 4) for
 $1-\bar{v}\ll 1$
. This gives
 $\bar{v}_{\bar{y}}=(3/4)^{2/3}(1-\bar{v})^{4/3}$
, with general solution
 $1-\bar{v}=48/(\bar{y}+\text{const}.)^{3}$
. This gives an alternative fitting formula for the velocity profile:
 $$\begin{eqnarray}v=V\left[1-\frac{48L_{0}^{\prime 3}}{(y-y_{0})^{3}}\right]\!.\end{eqnarray}$$
Taking
 $V$
,
 $L_{0}^{\prime }$
and
 $y_{0}$
yields a fit that is close to the exponential fit (4.1), the difference between the two fits being within the dispersion of the experimental data. This suggests that the effect of the nonlinearities of wall friction and of the bulk viscous stress on the flow profile is weak. Finally, we have checked that the qualitative conclusion given by figure 6, namely that the relative slip is overestimated by the local model, remains valid with nonlinear laws. Hence, the role of nonlinearities is secondary in this study, and can be neglected.