




No CrossRef data available.
Article contents
Increased cell proliferation of mouse fibroblast NIH-3T3 in vitro induced by excretory/secretory product(s) from Opisthorchis viverrini
Published online by Cambridge University Press: 14 September 2004
Abstract
Infection by Opisthorchis viverrini is a strong risk factor for cholangiocarcinoma. However, the mechanism by which the parasite is involved in carcinogenesis is not clear. In addition to the direct damage of the bile duct epithelium via direct contact with O. viverrini, the excretory/secretory (ES) product(s) released from the parasites may play important roles in this process. We therefore investigated the responses of a fibroblast cell line, NIH-3T3, to ES product(s) released from O. viverrini by using a non-contact co-culture technique. In this culture system, the parasites in the upper chamber had no direct contact with the NIH-3T3 cells in the lower chamber of the culture plate. The results indicated a marked increase in NIH-3T3 cell proliferation in the non-contact co-culture condition with either 0% or 10% calf serum in the medium compared with that without parasites. ES product(s) increased cell proliferation by stimulating the expression of phosphorylated retinoblastoma (pRB) and cyclin D1, the key proteins in driving cells through the G1/S transition point of the cell cycle. This led to the induction of cells going into the S-phase of the cell cycle. ES product(s) also changed the morphology of NIH-3T3 cells to a refractive and narrow shape, which allowed the cells to proliferate in the limited culture area. For the first time, we have been able to demonstrate increased cell proliferation induced by the ES product(s) from O. viverrini; this finding may clarify how O. viverrini ES product(s) affect human bile duct epithelium during cholangiocarcinogenesis.
Keywords
Information
- Type
- Research Article
- Information
- Copyright
- 2004 Cambridge University Press
INTRODUCTION
Cholangiocarcinoma remains a major public health problem in many parts of Southeast Asia, including Thailand, Laos and Vietnam (Vatanasapt et al. 1999). In northeastern Thailand a strong risk factor for bile duct cancer is opisthorchiasis, with 13·8 million people estimated to be infected (Jongsuksuntigul & Imsomboon, 1998). Parkin et al. (1991) performed a case-control study of patients and estimated that two-thirds of cholangiocarcinoma cases in Thailand were caused by Opisthorchis viverrini infestation. Moreover, the working group of the International Agency for Research on Cancer (IARC) concluded that O. viverrini is a definite cause of bile duct cancer in humans and classified this parasite as a carcinogen (IARC, 1994). The pathogenesis of O. viverrini-associated cholangiocarcinoma may be a complex process involving several mechanisms (Watanapa & Watanapa, 2002). Chronic irritation caused by the parasite later results in proliferation of the bile duct epithelium and leads to hyperplasia and adenomatous changes (Bhamarapravati, Thammavit & Vajrasthira, 1978; Riganti et al. 1989). The pathogenesis of these changes may be from either mechanical or chemical irritation. The mechanical irritation is the direct contact of parasites with bile duct epithelium; the chemical irritation is believed to be caused by ES products released from the flukes (Vatanasapt et al. 1999). The induction of cell proliferation is an important step to the genesis of cancer because hyperplastic cells are vulnerable to a carcinogen that can easily induce DNA damage during active cell proliferation (Williamson & Rainey, 1984; Watanapa & Williamson, 1993). If that DNA damage involves cell cycle control genes, neoplastic changes will occur. In cholangiocarcinogenesis, much evidence confirms endogenous and exogenous carcinogens in both human and animal models that can induce DNA damage (Migasena, Reaunsuwan & Changbumrung, 1980; Mitacek et al. 1999; Pinlaor et al. 2003). Though many investigators believed that ES product(s) from O. viverrini could induce cellular proliferation of bile duct epithelium (Pairojkul et al. 1991; Vatanasapt et al. 1999), no evidence supports this. The aim of this study is to examine the action of the ES product(s) from O. viverrini on cells in an in vitro model.
The effects of the ES product(s) from O. viverrini would be difficult to study in models in vivo because the parasites always adhere to the bile duct epithelial cells. So we decided to use the non-contact co-culture technique in vitro. This system has been previously used in experiments to study the functions of Trypanosoma cruzi ES product(s) (Kierszenbaum et al. 1990). The non-contact co-culture in vitro system does not allow the parasites to contact the cells underneath, enabling us to observe only the effects of ES product(s) on cells to the exclusion of any mechanical effects from the flukes. In our experiment, NIH-3T3 fibroblast cells were used as the model to investigate the effects of O. viverrini ES product(s). The advantage of this cell line is its sensitive response to external stimuli and its rapid transformation when exposed to even low amounts or concentrations of appropriate exogenous substances. This experiment demonstrates the effects of O. viverrini ES product(s) on cellular proliferation of NIH-3T3 cells. The cell-cycle control induced by ES product(s) is also explored.
MATERIALS AND METHODS
Parasites
Opisthorchis metacercariae were obtained from naturally infected cyprinoid fish captured from fresh-water reservoirs in the endemic area of Khon Kaen province, Thailand. Pepsin–HCl was used to digest the flesh to obtain metacercariae (Pattanapanyasat, Flavell & Vongsangnak, 1983), which were then introduced to the 6- to 8-week-old hamsters ad libitum. After 1 month the adult forms of O. viverrini were collected from the bile ducts of the hamsters and were washed several times with PBS containing 100 μg/ml penicillin and 100 U/ml streptomycin. To prevent microbial contamination, the adult O. viverrini were then incubated for 30 min in PBS containing antibiotics before being used in the non-contact co-culture technique.
NIH-3T3 cell culture
The mouse fibroblast cell line NIH-3T3 was bought from the American Type Culture Collection (ATCC). It was maintained by culture in DMEM (Gibco BRL) containing 10% calf serum (CS) (Gibco BRL or Starrate), designated as complete medium. It was placed in a 5% CO2 incubator at 37 °C and passaged twice a week. Trypan blue staining was used to measure the viability of the cells. The cells, with more than 95% viability, were collected for other experiments.
Non-contact co-culture technique
The non-contact co-culture between NIH-3T3 cells and intact viable O. viverrini was performed in a 24-well transwell (Costar). The parasites were incubated in the upper chamber containing the 8 μm porous plate, which allowed the ES product(s) to diffuse to the lower chamber where the NIH-3T3 cells adhered. The effects of parasitic products on cellular morphological changes were observed with an inverted microscope and cell proliferation and cell death were assessed using Trypan blue staining. Briefly, 10000 NIH-3T3 cells were plated onto the lower chamber of a 24-well double-chamber culture plate for 2 days with complete medium to let most of the cells adhere to the well. Then the media in some wells were changed to DMEM without CS while the rest of the wells continued in complete medium. Five viable adult O. viverrini were added to the upper chamber of each well. The NIH-3T3 cells cultured in complete medium and DMEM without CS were used as negative controls. The cultures were grown for 2, 4, 6, and 8 days. At each time-point cells in the lower chamber and their controls were trypsinized for enumerating the number of cells, including viable, dead and total cells.
To examine the effect of the numbers of viable adult O. viverrini against NIH-3T3 cell numbers, we used different numbers of the viable parasites in the upper chamber and co-culture with NIH-3T3 cells in the lower one. This experiment was performed with 30000 cells of NIH-3T3 at the starting point and culture in complete medium for 2 days. After a 3-day incubation period with the parasites, the number of cells was measured by Trypan blue staining.
Flow cytometry analysis
Cell cycle distribution experiments were performed by DNA staining methods using either propidium iodide (PI) staining or double staining with PI and 5-bromo-2′-deoxy-uridine (BrdU). With PI staining, NIH-3T3 cells were grown at the beginning in a 24-well plate in serum-starved medium (DMEM with 0·1% CS) for 2 days to arrest cells in the quiescent stage of the cell cycle (Iyer et al. 1999). Then cells were treated with conditioned medium for 24 h. The conditioned medium was the 2-day culture DMEM without CS and with parasites; eggs and faeces were removed by centrifugation at 2000 g for 15 min. Then 105–106 cells were subjected to PI staining as described previously (Kerkhoff & Rapp, 1997). The PI-stained cells were then analysed for DNA content by flow cytometry (fluorescence-activated cell sorting [FACS]; FACSCalibur; Becton Dickinson). The distribution of cells in each stage of the cell cycle was quantified with the computer program ModFit LT (Verity Software House). In place of conditioned medium, either serum-starved medium or complete medium were used simultaneously in each run as negative and positive controls respectively.
When double staining with PI and BrdU was used, cells were exposed to 10 μM final concentration of BrdU (Sigma) for 15 min. Cells (105–106) were then washed twice with 1% BSA/1× PBS and fixed in ice-cold 70% ethanol at 4 °C for at least 4 h. After centrifugation at 3000 g for 10 min, the cell pellet was resuspended with 2 M HCl with 0·1% (v/v) Triton X-100 and incubated for 30 min at room temperature for DNA denaturation. After the acid solution was discarded by centrifugation, the cell pellet was dissolved in 0·1 M Na2B4O7.10H2O, pH 8·5. For immunodetection about 106 cells were covered with mouse monoclonal anti-BrdU IgG (dil. 1[ratio ]1000) (Becton Dickinson) and incubated at room temperature for 30 min. Then a goat anti-mouse antibody conjugated with fluorescein isothiocyanate (dil. 1[ratio ]2000) (FITC; Becton Dickinson) was added. The assay was incubated at 4 °C in the dark for 30 min. The cell suspension was centrifuged and the cell pellet was washed with 1× PBS with 0·5% (v/v) Tween 20. A solution of 1× PBS with a final concentration of PI 0·05 mg/ml was added to the cell pellet. Cells were incubated on ice for 30 min and then analysed for their distribution in the cell cycle by flow cytometer (FACSCalibur; Becton Dickinson) with CellQuest software (Becton Dickinson).
Western blot analysis
To test the expression profile of the 2 important cell cycle-regulated proteins, pRB and cyclin D1, we performed Western blot analysis. Cells treated with conditioned medium for various time-points including 15 min, 6, 12, 24, and 48 h were trypsinized and lysed in a protein lysis buffer (62·5 mM Tris–HCl pH 6·8, 1·25% (w/v) SDS, 5% (v/v) glycerol) at a concentration of 50000 cells/μl. The concentration of total proteins extracted was measured with a DC protein assay kit (BioRad). Then β-mercaptoethanol and 0·01% bromophenol blue were added to a final concentration of 5% (v/v) and 0·01% (w/v), respectively. The 30 μg of total proteins was separated on 7·5% and 10% SDS–PAGE for pRB and cyclin D1, respectively. The proteins were transferred to a polyvinylidene fluoride (PVDF) membrane (Millipore) using the transfer buffer (25 mM Tris–HCl pH 8·5, 192 mM glycine, 20% methanol) in a semidry transfer system (Trans-Blot SD; BioRad) with 12 mA for 1 h. Immunodetection was performed as previously described (Kerkhoff & Rapp, 1997). The protein bands were visualized with the ECL detection system (Phototope®-HRP Western detection system; Cell Signaling Technology) and photographed with a CCD camera (Hamamatsu II).
For reprobing the membranes, the first and second antibodies were removed by incubating the membranes for 1 h at 65 °C in stripping buffer (0·2 M glycine–HCl pH 2·5, 0·05% Tween 20, 0·1 M β-mercaptoethanol) after which the membranes were ready for Western blot with further antibodies. The following primary antibodies were used: 1[ratio ]1000 of rabbit polyclonal anti-pRB-Ser780 and anti-pRB-Ser795 IgG for pRB at different amino acid residues (PhosphoPlus®kit; Cell Signaling Technology); 1[ratio ]1000 of mouse monoclonal anti-cyclin D1 IgG was used for cyclin D1. Anti-rabbit and anti-mouse IgGs conjugated with horseradish peroxidase (dil. 1[ratio ]2000) (Cell Signaling Technology) were used as secondary antibodies for pRB and cyclin D1 respectively.
RESULTS
Induction of cell proliferation and morphological changes by ES product(s)
The growth curve of NIH-3T3 with complete medium in a 24-well culture plate is shown in Fig. 1A (dash line). The cell growth curve can be divided into three main parts including the lag phase (day 0 to day 2), the exponential or log phase (day 3 to day 6) and the decline phase (day 7 to day 10). The growth pattern observed in conditions using DMEM without CS displayed only the lag and decline phases (Fig. 1B; dash line). After non-contact co-culture with parasites in both complete medium and DMEM without CS, the number of viable NIH-3T3 cells increased in all time-points including days 4, 6, 8, and 10 (Fig. 1A and B; continuous lines) compared with those without parasites (Fig. 1A and B; dash lines). This result was dramatically demonstrated by using DMEM without CS (Fig. 1B). Cells seemed to die or could not divide in conditions without co-cultured parasites, but they could be restored to a normal cell growth pattern by co-culture with O. viverrini. Moreover, in conditions with complete medium ES product(s) showed an additive effect of 10% CS by accelerating NIH-3T3 cells to increased cell numbers in log phase (Fig. 1A). Our results demonstrated equal numbers of dead cells in the conditions with O. viverrini and its counterpart, without O. viverrini in either medium with or without serum (data not shown).

Fig. 1. The graphs showing numbers of viable NIH-3T3 cells after staining with Trypan blue on the y-axes and duration of culture in day(s) on the x-axes. DMEM with 10% CS (complete medium) (A) and without CS (B) were used in the experiment. After adding adult Opisthorchis viverrini at day 2, the numbers of viable cells were measured at days 4, 6, 8 and 10. The numbers of NIH-3T3 cells in non-contact co-culture with parasites were higher (continuous lines) than those without co-culture (dash lines). Triplicate experiments were performed and the means±standard deviation (S.D.) are indicated.
The maximum number of cells that grew in the limited area of a 24-well culture plate was different between the conditions with and without O. viverrini. As shown in Fig. 1A (continuous line), in co-culture with the parasites as many as 620000 cells grew (at day 10 of culture) whereas at maximum only about 250000 cells grew without parasites (at day 6 of culture; Fig. 1A; dash line). Thus the maximal number of viable cells in the co-culture system was approximately 3 times higher than without parasites. This might be associated with the morphological change of NIH-3T3 cells in co-culture, as shown in Fig. 2. The normal flat fibroblastic shape of NIH-3T3 in medium with 10% CS (Fig. 2A) changed to the smaller refractive shape by co-culture with the parasites (Fig. 2C). This shape change also occurred in the co-culture condition with DMEM without CS (Fig. 2D), confirming cell shape change as the effect of ES product(s). The viable NIH-3T3 cells in DMEM without CS showed the normal flat fibroblastic shape while the dead cells with blebbing, floated (Fig. 2B).

Fig. 2. Photographs taken by inverted light microscopy of NIH-3T3 cells cultured in different conditions. (A) The normal flat and broad fibroblastic shape of NIH-3T3 cells was observed in complete medium. Cell–cell contact led to inhibition of cell proliferation. (B) The same morphology was also seen in some populations of cells cultured in DMEM without CS, while most cells showed blebbing and floated, indicating that they were dead. (C, D) After non-contact co-culture with viable Opisthorchis viverrini, the refractive fibroblastic shape was observed when using DMEM with or without 10% CS. Cells with this morphology were longer and narrower than normal. This new shape of NIH-3T3 cells allowed higher numbers of cells to be counted in co-culture conditions by delaying the occurrence of cell–cell contact inhibition.
To confirm our result that O. viverrini induced cell proliferation by ES product(s) released from the parasites, we used various numbers of viable O. viverrini in non-contact co-culture systems. This experiment used DMEM without CS as the culture medium in non-contact co-culture system to exclude the cell proliferation effect of CS. With 30000 NIH-3T3 cells on the starting day, 20000, 33000, 69000, 129000, and 223000 viable cells were counted under conditions with 0, 1, 2, 5, and 10 viable O. viverrini respectively (Fig. 3). The results indicate that the number of viable NIH-3T3 cells increased in a nearly linear ratio to the number of parasites.

Fig. 3. Bar graph showing the correlation between number of parasites used in the experiment (x-axis) and the number of viable NIH-3T3 cells (y-axis). 30000 NIH-3T3 cells were plated at the beginning and were allowed to co-culture with parasites. The numbers of NIH-3T3 cells were counted after co-culture for 3 days. The number of cells increased as the number of parasites increased. The values shown represent the means±S.D. of 3 experiments.
Cell-cycle analysis
Cells were arrested in the quiescent stage of the cell cycle by culture in serum-starved medium. The raw data as provided by the FACS machine which showed the FACS profiles (x-axes=DNA content; y-axes=cell counts) are presented in Fig. 4A. The highest peak indicates cells in G1-phase. The percentage of cells in G1, S and G2/M phases was analysed by ModFit LT (Verity Software House). The percentage of cells arrested in G1-phase was as follows: serum-starved medium, conditioned medium, and complete medium as 90, 85, and 78% respectively (Fig. 4B). After incubating G1-arrested cells with fresh conditioned medium for 24 h, the percentage of cells in the S-phase was 10% and that with 10% CS was 12% (Fig. 4B), whereas cells with serum-starved medium showed only 4% in S-phase. Furthermore, the percentages of cells in these 3 media in S/G2/M-phase were 22% in complete medium, 15% in conditioned medium and 10% in serum-starved medium.

Fig. 4. Cell-cycle analysis of NIH-3T3 cells in different culture media. The cell populations were analysed for DNA content after PI staining using a flow cytometer. (A) The raw data provided by the FACS machine shows the FACS profiles (x-axis=DNA content; y-axis=cell number). (B) The cell cycle distribution of the profiles was quantified with the computer program ModFit and is shown in a bar graph, including G1, S and G2/M-phases. The percentage of cells in S-phase was highest when NIH-3T3 cells were cultured in complete medium. A higher percentage of cells in the S-phase was observed in cultures with conditioned medium than in serum-starved medium. Results are expressed as the means±S.D. of triplicate experiments.
The results indicated the same pattern when using PI plus BrdU staining. The raw data of cell distribution in different phases of the cell cycle according to PI signal (x-axis) and BrdU signal (y-axis) are shown in Fig. 5A. There was a slightly higher percentage of cells in the S-phase after stimulation with conditioned medium than with complete medium, 11% and 8% respectively (Fig. 5B), and conditions using serum-starved medium resulted in only 1% of cells in S-phase. The distributions of cells in S/G2/M-phase were 33%, 27% and 19% in conditioned medium, complete medium, and serum-starved medium, respectively.

Fig. 5. Cell-cycle analysis of NIH-3T3 cells in different culture media. The cell populations were analysed for DNA content after PI-BrdU staining. (A) The raw data provided by the FACS machine are shown with the x-axis as PI signal and the y-axis as BrdU signal. The cell-cycle distribution of the profiles was quantified with the CellQuest program. Cells with a BrdU signal higher than 102 represented increased BrdU incorporation of cells in the S-phase. The cells with lower BrdU signal were classified as G1 or G2/M depending on their DNA content (PI signal). (B) The simplified data are shown in a bar diagram, including G1, S and G2/M-phases. The percentage of cells in S-phase when cultured in conditioned medium was slightly higher than that in complete medium. The number of S-phase cells was lowest in the serum-starved medium. Results are expressed as the means±S.D. of duplicate experiments.
Expression of proteins in G1-S checkpoint
Many proteins play important roles in driving cells to enter the cell cycle. The most critical checkpoint that commits cells to completely divide is G1/S-phase. Phosphorylated retinoblastoma and cyclin D1 are the 2 important proteins acting at this step. In the case of phosphorylation at Ser 780 and 795 of RB, the pattern of expression was similar in cells treated with either complete medium or conditioned medium but was different from those treated with serum-starved medium (Fig. 6). The pRB-Ser 780 was detected only after 12 h of exposure of cells to complete medium and conditioned medium but could not be seen at any time of culturing in serum-starved medium. In the case of pRB-Ser 795, the expression was detected as early as 15 min and showed maximal expression at 12 h, then declined until 48 h in cells treated with either complete medium or conditioned medium, while its expression was very low in cells treated in serum-starved medium. For cyclin D1, the expression was observed from 15 min to 48 h of culture in both complete and conditioned medium. The maximum expression point was at 12 h. The Ku-70 protein, a nuclear protein acting as double-stranded DNA binding protein, was used as an internal control of protein expression in each sample: equal expression of Ku-70 determined the equal amount of total proteins used in each samples.

Fig. 6. The regulation of 2 cell cycle-related proteins, pRB and cyclin D1, by different culture media: complete medium (A), conditioned medium (B), and serum-starved medium (C). The amounts of these proteins were measured by Western blot analysis and detected by chemiluminescence. The positive bands are shown in black with different intensities. All 4 Western blots for 4 different proteins in each culture medium were performed on the same blotted PVDF membrane using the reprobing technique. The peaks of protein expression of pRB-Ser780, pRB-Ser795 and cyclin D1 were observed after culture for 12 h in both complete and conditioned media, whereas cells in serum-starved medium showed no, or only slight expression. The same amounts of total proteins were used in each condition, represented by the same expression level of Ku-70.
DISCUSSION
This present study has demonstrated for the first time the effect of O. viverrini ES product(s) in the induction of cell proliferation in an in vitro model. How ES product(s) can stimulate cell proliferation at any step of the cell cycle is also explored. These investigations may help in understanding the possible cause of O. viverrini-induced cellular hyperproliferation occurring in cholangiocarcinogenesis.
Opisthorchiasis is the strong risk factor causing cholangiocarcinogenesis in the northeastern part of Thailand (Jongsuksuntigul & Imsomboon, 1998). Many reports suggested that the parasite can directly damage the bile duct epithelium and cause chronic inflammation and chronic irritation which finally turn to cholangiocarcinoma (Watanapa & Watanapa, 2002). As to chronic irritation from parasites, previous work emphasized the mechanical damage from parasitic suckers. However, the mechanism underlying the increase in cell proliferation after chronic irritation with O. viverrini was not clearly explained. Moreover, some investigators believed that some biochemical substances simultaneously released from parasites might cause host cell proliferation (Pairojkul et al. 1991; Vatanasapt et al. 1999), but there were no reports about the capability of parasitic ES product(s) to induce cell proliferation without any mechanical damage. The in vivo study of the effects of ES product(s) produced from the parasites is difficult to perform because of the impossibility to completely separate the parasites and host cells in animal models. Thus, the non-contact co-culture in vitro system has been used because it allows parasites and host cells to stay in the same environment without contact with each other. The double-chamber culture plates used in this system have been used previously in experiments to study the effects of other parasitic secretory products (Kierszenbaum et al. 1990). The ES product(s) released from parasites placed in the upper chamber can pass through the 8 μm pores and later act on the adherent cells in the lower chamber. In this present experiment we used NIH-3T3 as the cell model to investigate the effects of O. viverrini ES product(s). This cell line has a sensitive response to external stimuli and rapidly transforms itself when exposed to appropriate exogenous substances.
Supplementing with serum in the culture medium is the well-known procedure to increase cell proliferation in cell culture. In our results the NIH-3T3 cells did not proliferate in the culture conditions without serum supplement. The association of serum stimulation and cell proliferation has previously been reported in the NIH-3T3 cell line (Taylor & Shalloway, 1996; Gille & Downward, 1999). The significant increase of viable NIH-3T3 cell numbers when co-cultured with viable parasites in serum-free medium indicated that ES product(s) from O. viverrini may act as the growth factor, like the supplement CS, which can induce the NIH-3T3 cells to proliferate. Furthermore, the linear relationship in the co-culture system between the number of viable O. viverrini and the number of viable NIH-3T3 cells confirms this conclusion. However, the efficacy of ES product(s) was not equal to that of serum since the maximal numbers of cells in co-culture using no CS was lower than that in 10% CS. The explanation might be either that the concentration of growth stimulant in ES product(s) is lower than that in serum or that the pathways that ES product(s) use to control cell proliferation are different from those used by CS (Grossi et al. 1998; Spencer & Misra, 1999). The latter explanation might be supported by the result of the NIH-3T3 cell shape changes that occurred only in co-culture conditions but not with complete medium. In addition, the effect of the ES product(s) can be an additive effect to CS, producing more viable cells in co-culture conditions than with complete medium alone. This additive effect of the ES product(s) to CS might be supported by a previous publication showing that 10% serum was the saturable condition to increase the rate of NIH-3T3 cell cycling (DiSalvo, Zhang & Jacobberger, 1995). Moreover the number of dead cells, including apoptotic cells, was measured and the result showed no differences in cell death in co-culture compared with the non-co-culture ones, either with or without serum (data not shown). This confirms that the increased number of cells is the result of increased cell proliferation not decreased cell death.
Cell proliferation is ultimately controlled by a number of nuclear proteins called cell-cycle regulatory proteins (Norbury & Nurse, 1992; Sherr & Roberts, 1995). These include G1/S-phase cyclins and cyclin-dependent kinases (CDKs) that are necessary for G1/S transition and DNA synthesis (Matsushime et al. 1994). The early G1-phase cyclins (the D-type cyclins including D1, D2, and D3) differ in their interactions with their primary target, RB protein (Norbury & Nurse, 1992). In this previous study overexpression of cyclin D1 shortened the G1-phase of the cell cycle and enhanced the progression through G1-phase to S-phase (Norbury & Nurse, 1992). Moreover, phosphorylation of RB protein is the current molecular definition of G1/S transition (Planas-Silva & Weinberg, 1997). After full phosphorylation with the help of at least two classes of CDKs and cyclin D, phosphorylated RB will release from the E2F family of transcription factors (Sherr, 1996). This will initiate subsequent events necessary for transition through the other phases of the cell cycle. Thus, expression of pRB and cyclin D1 are important to commit to complete cell division. Our data indicate that cyclin D1 protein abundance is slightly increased in NIH-3T3 cells after 15 min of co-culture and is clearly expressed at 8 h in both serum-induced and ES product(s)-induced conditions. Furthermore, the maximal expression of cyclin D1 is at 12 h of stimulation both by serum and ES product(s) and shows a gradual decrease until 48 h, whereas no cyclin D1 is expressed at any time in cells cultured in serum-starved medium. The pRB at either serine residues 780 or 795 shows a peak of expression after 12 h of exposure to both serum and ES product(s). The expression of cyclin D1 protein seems to happen before that of pRB. The similar expression profiles of pRB and cyclin D1 were previously shown in human fibroblasts treated with serum (Danesh et al. 1999). These two proteins, cyclin D1 and pRB, are essential for G1/S transition and complete cell division as mentioned earlier (Sherr, 1996). This evidence explains our cell-cycle analysis data that their expressions can lead to increased cell numbers entering the S-phase and decreased cell numbers in G1-phase in serum and ES product(s) stimulation compared with those in serum-starved medium. In conclusion, ES product(s) from O. viverrini seem to act as growth stimulant(s) that can induce NIH-3T3 cell proliferation. The increase in cell proliferation can be explained by the capability of ES product(s) to stimulate entrance of cells through the G1/S transition point into the cell cycle by overexpression of pRB and cyclin D1.
ES product(s) from O. viverrini can also induce changes in the cell shape of NIH-3T3. Loss of cell–cell contact in the refractive shape after exposure to ES product(s) could allow cells to proliferate continuously whereas those with the normal flat fibroblastic shape did not. However, the NIH-3T3 cells in Fig. 2B did not proliferate since they lacked supplemental CS in the medium. The refractive shaped NIH-3T3 cells can be observed in both media used in the non-contact co-culture systems, either with or without serum. This might indicate that the shape change was induced by ES product(s), not by either the presence or absence of serum. From our observations the greater the increase in cell number during the longer period of non-contact co-culture, the greater the cell shape changes. In conclusion, cellular morphological changes induced by ES product(s) may be postulated to be one factor associated with cell proliferation because the changes allow increased cell proliferation without cell–cell contact inhibition. The same shape change of NIH-3T3 cells was previously presented by Kerkhoff & Rapp (1997) as the result of Raf overexpression which induces collapse of actin filaments, removal of anti-proliferation signals mediated by cell–cell contact and leads to increased cellular proliferation. Further work will be needed to prove whether O. viverrini ES product(s) induce Raf overexpression in NIH-3T3 cells.
In conclusion, these data demonstrate the effects of ES product(s) released from O. viverrini directly on cells. The ES product(s) induced cell shape changes and cell proliferation. The increased NIH-3T3 cell proliferation after exposure to ES product(s) is mediated by the capability of cells to pass through the G1/S transition into the S-phase of the cell cycle. The phosphorylation of RB and overexpression of cyclin D1 play important roles in this step. Even though the NIH-3T3 is not the real host cell of O. viverrini, this demonstration may trigger consideration of the possibility of how parasites affect human bile duct epithelium. This result may, in part, help to understand O. viverrini-associated induction of cell proliferation during cholangiocarcinogenesis.
Financial support was provided by Khon Kaen University. Departments of Biochemistry, Pathology and Parasitology, Faculty of Medicine, Khon Kaen University, supplied all the facilities. We would like to thank Mr Suwit Banthaisong for the preparation and necropsy of the hamsters. Special thanks are given to Ilse Riegel for her excellent English editing of this manuscript. The authors declare that all the experiments performed in this article comply with current laws of Thailand.
References
REFERENCES
BHAMARAPRAVATI, N.,
THAMMAVIT, W. &
VAJRASTHIRA, S. (1978).
Liver changes in hamsters infected with a liver fluke of man, Opisthorchis viverrini.
American Journal of Tropical Medicine and Hygiene 27,
787–794.CrossRefGoogle Scholar
DANESH, F. R.,
YE, M.,
SALMI, S.,
LAPOINTE, M. &
BATLLE, D. (1999).
Temporal profile of serum-induced S-phase entry and retinoblastoma protein phosphorylation in human skin fibroblasts.
Kidney International 56,
1282–1285.CrossRefGoogle Scholar
DISALVO, C. V.,
ZHANG, D. &
JACOBBERGER, J. W. (1995).
Regulation of NIH-3T3 cell G1 phase transit by serum during exponential growth.
Cell Proliferation 28,
511–524.CrossRefGoogle Scholar
GILLE, H. &
DOWNWARD, J. (1999).
Multiple ras effector pathways contribute to G(1) cell cycle progression.
Journal of Biological Chemistry 274,
22033–22040.CrossRefGoogle Scholar
GROSSI, M.,
LA ROCCA, S. A.,
PIERLUIGI, G.,
VANNUCCHI, S.,
RUARO, E. M.,
SCHNEIDER, C. &
TATO, F. (1998).
Role of Gas1 down-regulation in mitogenic stimulation of quiescent NIH3T3 cells by v-Src.
Oncogene 17,
1629–1638.CrossRefGoogle Scholar
INTERNATIONAL AGENCY FOR RESEARCH ON CANCER (1994).
Infection with the liver flukes (Opisthorchis viverrini, Opisthorchis felineus and Clonorchis sinensis).
IARC Monograp on Evaluation of Carcinogenic Risks of Human 61,
121–175.
IYER, V. R.,
EISEN, M. B.,
ROSS, D. T.,
SCHULER, G.,
MOORE, T.,
LEE, J. C.,
TRENT, J. M.,
STAUDT, L. M.,
HUDSON, J. Jr.,
BOGUSKI, M. S.,
LASHKARI, D.,
SHALON, D.,
BOTSTEIN, D. &
BROWN, P. O. (1999).
The transcriptional program in the response of human fibroblasts to serum.
Science 283,
83–87.CrossRefGoogle Scholar
JONGSUKSUNTIGUL, P. &
IMSOMBOON, T. (1998).
Epidemiology of opisthorchiasis and national control program in Thailand.
Southeast Asian Journal of Tropical Medicine and Public Health 29,
327–332.Google Scholar
KERKHOFF, E. &
RAPP, U. R. (1997).
Induction of cell proliferation in quiescent NIH 3T3 cells by oncogenic c-Raf-1.
Molecular and Cellular Biology 17,
2576–2586.CrossRefGoogle Scholar
KIERSZENBAUM, F.,
CUNA, W. R.,
BELTZ, L. A. &
SZTEIN, M. B. (1990).
Trypanosomal immunosuppressive factor: a secretion product(s) of Trypanosoma cruzi that inhibits proliferation and IL-2 receptor expression by activated human peripheral blood mononuclear cells.
Journal of Immunology 144,
4000–4004.Google Scholar
MATSUSHIME, H.,
QUELLE, D. E.,
SHURTLEFF, S. A.,
SHIBUYA, M.,
SHERR, C. J. &
KATO, J. Y. (1994).
D-type cyclin-dependent kinase activity in mammalian cells.
Molecular and Cellular Biology 14,
2066–2076.CrossRefGoogle Scholar
MIGASENA, P.,
REAUNSUWAN, W. &
CHANGBUMRUNG, S. (1980).
Nitrates and nitrites in local Thai preserved protein foods.
Journal of Medical Association of Thailand 63,
500–505.Google Scholar
MITACEK, E. J.,
BRUNNEMANN, K. D.,
SUTTAJIT, M.,
MARTIN, N.,
LIMSILA, T.,
OHSHIMA, H. &
CAPLAN, L. S. (1999).
Exposure to N-nitroso compounds in a population of high liver cancer regions in Thailand: volatile nitrosamine (VNA) levels in Thai food.
Food and Chemical Toxicology 37,
297–305.CrossRefGoogle Scholar
NORBURY, C. &
NURSE, P. (1992).
Animal cell cycles and their control.
Annual Review of Biochemistry 61,
441–470.CrossRefGoogle Scholar
PAIROJKUL, C.,
SHIRAI, T.,
HIROHASHI, S.,
THAMAVIT, W.,
BHUDHISAWAT, W.,
UTTARAVICIEN, T.,
ITOH, M. &
ITO, N. (1991).
Multistage carcinogenesis of liver-fluke-associated cholangiocarcinoma in Thailand.
Princess Takamatsu Symposium 22,
77–86.Google Scholar
PARKIN, D. M.,
SRIVATANAKUL, P.,
KHLAT, M.,
CHENVIDHYA, D.,
CHOTIWAN, P.,
INSIRIPONG, S.,
L'ABBE, K. A. &
WILD, C. P. (1991).
Liver cancer in Thailand. I. A case-control study of cholangiocarcinoma.
International Journal of Cancer 48,
323–328.Google Scholar
PATTANAPANYASAT, K.,
FLAVELL, D. J. &
VONGSANGNAK, V. (1983).
A method for collecting metacercariae of Opisthorchis viverrini.
Siriraj Hospital Gazette 35,
143–146.Google Scholar
PINLAOR, S.,
YONGVANIT, P.,
HIRAKU, Y.,
MA, N.,
SEMBA, R.,
OIKAWA, S.,
MURATA, M.,
SRIPA, B.,
SITHITHAWORN, P. &
KAWANISHI, S. (2003).
8-Nitroguanine formation in the liver of hamsters infected with Opisthorchis viverrini.
Biochemical and Biophysical Research Communications 309,
567–571.CrossRefGoogle Scholar
PLANAS-SILVA, M. D. &
WEINBERG, R. A. (1997).
The restriction point and control of cell proliferation.
Current Opinion in Cell Biology 9,
768–772.CrossRefGoogle Scholar
RIGANTI, M.,
PUNGPAK, S.,
PUNPOOWONG, B.,
BUNNAG, D. &
HARINASUTA, T. (1989).
Human pathology of Opisthorchis viverrini infection: a comparison of adults and children.
Southeast Asian Journal of Tropical Medicine and Public Health 20,
95–100.Google Scholar
SHERR, C. J. &
ROBERTS, J. M. (1995).
Inhibitors of mammalian G1 cyclin-dependent kinases.
Genes and Development 9,
1149–1163.CrossRefGoogle Scholar
SPENCER, J. A. &
MISRA, R. P. (1999).
Expression of the SRF gene occurs through a Ras/Sp/SRF-mediated-mechanism in response to serum growth signals.
Oncogene 18,
7319–7327.CrossRefGoogle Scholar
TAYLOR, S. J. &
SHALLOWAY, D. (1996).
Cell cycle-dependent activation of Ras.
Current Biology 6,
1621–1627.CrossRefGoogle Scholar
VATANASAPT, V.,
SRIPA, B.,
SITHITHAWORN, P. &
MAIRIANG, P. (1999).
Liver flukes and liver cancer.
Cancer Survey 33,
313–343.Google Scholar
WATANAPA, P. &
WATANAPA, W. B. (2002).
Liver fluke-associated cholangiocarcinoma.
British Journal of Surgery 89,
962–970.CrossRefGoogle Scholar
WATANAPA, P. &
WILLIAMSON, R. C. (1993).
Experimental pancreatic hyperplasia and neoplasia: effects of dietary and surgical manipulation.
British Journal of Cancer 67,
877–884.CrossRefGoogle Scholar
WILLIAMSON, R. C. N. &
RAINEY, J. B. (1984).
The relationship between intestinal hyperplasia and carcinogenesis.
Scandinavian Journal of Gastroenterology 19 (Suppl.),
57–76.Google Scholar
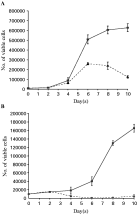
Fig. 1. The graphs showing numbers of viable NIH-3T3 cells after staining with Trypan blue on the y-axes and duration of culture in day(s) on the x-axes. DMEM with 10% CS (complete medium) (A) and without CS (B) were used in the experiment. After adding adult Opisthorchis viverrini at day 2, the numbers of viable cells were measured at days 4, 6, 8 and 10. The numbers of NIH-3T3 cells in non-contact co-culture with parasites were higher (continuous lines) than those without co-culture (dash lines). Triplicate experiments were performed and the means±standard deviation (S.D.) are indicated.

Fig. 2. Photographs taken by inverted light microscopy of NIH-3T3 cells cultured in different conditions. (A) The normal flat and broad fibroblastic shape of NIH-3T3 cells was observed in complete medium. Cell–cell contact led to inhibition of cell proliferation. (B) The same morphology was also seen in some populations of cells cultured in DMEM without CS, while most cells showed blebbing and floated, indicating that they were dead. (C, D) After non-contact co-culture with viable Opisthorchis viverrini, the refractive fibroblastic shape was observed when using DMEM with or without 10% CS. Cells with this morphology were longer and narrower than normal. This new shape of NIH-3T3 cells allowed higher numbers of cells to be counted in co-culture conditions by delaying the occurrence of cell–cell contact inhibition.
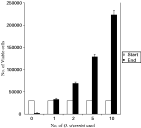
Fig. 3. Bar graph showing the correlation between number of parasites used in the experiment (x-axis) and the number of viable NIH-3T3 cells (y-axis). 30000 NIH-3T3 cells were plated at the beginning and were allowed to co-culture with parasites. The numbers of NIH-3T3 cells were counted after co-culture for 3 days. The number of cells increased as the number of parasites increased. The values shown represent the means±S.D. of 3 experiments.
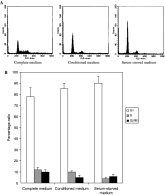
Fig. 4. Cell-cycle analysis of NIH-3T3 cells in different culture media. The cell populations were analysed for DNA content after PI staining using a flow cytometer. (A) The raw data provided by the FACS machine shows the FACS profiles (x-axis=DNA content; y-axis=cell number). (B) The cell cycle distribution of the profiles was quantified with the computer program ModFit and is shown in a bar graph, including G1, S and G2/M-phases. The percentage of cells in S-phase was highest when NIH-3T3 cells were cultured in complete medium. A higher percentage of cells in the S-phase was observed in cultures with conditioned medium than in serum-starved medium. Results are expressed as the means±S.D. of triplicate experiments.
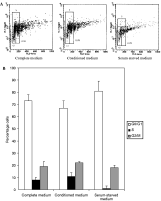
Fig. 5. Cell-cycle analysis of NIH-3T3 cells in different culture media. The cell populations were analysed for DNA content after PI-BrdU staining. (A) The raw data provided by the FACS machine are shown with the x-axis as PI signal and the y-axis as BrdU signal. The cell-cycle distribution of the profiles was quantified with the CellQuest program. Cells with a BrdU signal higher than 102 represented increased BrdU incorporation of cells in the S-phase. The cells with lower BrdU signal were classified as G1 or G2/M depending on their DNA content (PI signal). (B) The simplified data are shown in a bar diagram, including G1, S and G2/M-phases. The percentage of cells in S-phase when cultured in conditioned medium was slightly higher than that in complete medium. The number of S-phase cells was lowest in the serum-starved medium. Results are expressed as the means±S.D. of duplicate experiments.
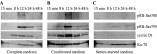
Fig. 6. The regulation of 2 cell cycle-related proteins, pRB and cyclin D1, by different culture media: complete medium (A), conditioned medium (B), and serum-starved medium (C). The amounts of these proteins were measured by Western blot analysis and detected by chemiluminescence. The positive bands are shown in black with different intensities. All 4 Western blots for 4 different proteins in each culture medium were performed on the same blotted PVDF membrane using the reprobing technique. The peaks of protein expression of pRB-Ser780, pRB-Ser795 and cyclin D1 were observed after culture for 12 h in both complete and conditioned media, whereas cells in serum-starved medium showed no, or only slight expression. The same amounts of total proteins were used in each condition, represented by the same expression level of Ku-70.
 You have
Access
- 65
- Cited by