Nomenclature
Symbols
- 4PB
-
Four (4) Point Bending
- ASTM
-
American Society for Testing and Materials
- BFD
-
Back Face Deflection
- CDM
-
Continuum Damage Mechanics
- CFRP
-
Carbon Fibre Reinforced Plastic
- CLT
-
Classical Lamination Theory
- CZM
-
Cohesive Zone Modelling
- FEM
-
Finite Element Method
- GF
-
Glass Fibre
- HVI
-
High Velocity Impact
- LVI
-
Low Velocity Impact
- NCF
-
Non-Crimp Fabric
- UD
-
Uni-Directional
- UMAT
-
User MATerial
1.0 Introduction
The use of numerical models for the prediction of mechanical properties or impact response can considerably reduce the time and cost related to composite structural design. Numerical techniques such as the Finite Element Method (FEM), is often utilised to predict damage due to impact loading in a composite material. In recent years, the use of energy-based models has seen an appreciable increase due to their accuracy and reliability in damage prediction. This is favourable especially in the aeronautical industry due to its capabilities in designing and damage tolerance and damage resistance structure. In addition, the significant increase in the use of composite materials demands a more sophisticated design tool since in practice, many composite structures are over-engineered to compensate for the low damage tolerance. Ultimately, the use of energy-based models could harness the full of composite materials.
The earliest implementation of energy-based damage mechanics approach is proposed by Ladeveze [Reference Ladeveze and LeDantec1]. In-plane testing of various laminate orientation was simulated using the CDM approach and later compared with the experimental results. Damage onset was taken as the failure strength of relevant modes, and then linearly degraded until zero. Excellent correlation between the experimental and simulation results was obtained. Later, Matzenmiller et al. [Reference Matzenmiller, Lubliner and Taylor2] utilise the CDM approach by considering the post-failure behaviour as a function of the Weibull distribution of strength. Williams et al. [Reference Williams and Vaziri3] implemented the approach suggested by Matzenmiller et al. [Reference Matzenmiller, Lubliner and Taylor2] into LS-Dyna as a plane stress material model. Following this, Iannucci et al. [Reference Iannucci, Willows and Degrieck4–Reference Iannucci, Pope and Dalzell8] employed the CDM approach to model thin laminated composites (UD and woven) under LVI and HVI loadings. All numerical prediction including the force-time/displacement histories were in close agreement with the experimental results.
The present work has focused on the development of a damage model for high performance fibre composites, in particular for Vectran/Epoxy laminates. The energy-based damage model has been applied to both quasi-static in-plane tests (tension, compression, and ±45° in-plane shear), as well as plate impact test. The former has been described in a separate paper [Reference Syed Abdullah, Iannucci, Greenhalgh and Ahmad9]. The current model is an extension of the work by Iannucci et al. [Reference Iannucci and Ankersen5–Reference Iannucci and Willows7] which has been modified to allow for the non-linear behaviour observed in Vectran/Epoxy composite. The damage model has been implemented into the non-linear Finite Element (FE) software package, LS-Dyna via Fortran 77.
2.0 Finite element model (FEM) setup
2.1 Element type and boundary conditions
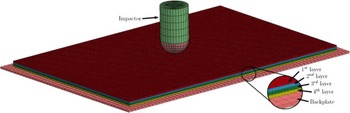
A simplified representation of the Low Velocity Impact (LVI) condition was made in the FEM modelling [Reference Abdullah10]. Four layers of stacked 8-noded thick shell elements (single integration point, six degrees of freedom) were utilised to model the 100mm×150mm composite plate (following ASTM D7136 [11] recommendation), with each connected using a cohesive algorithm (explained in Subsection 4.3) to represent the delamination behaviour. Similar to the experiment, the 16mm diameter steel hemispherical impactor and the 110mm×160mm steel backplate (1mm thickness) to represent the composite plate support was modelled using solid elements. Note that in the actual experiment, the impactor mass is 2.1kg and has a height of 1.52m. However, in the current modelling strategy, the height of the impactor is defined to be 30mm. A load mass of 2.1kg is then applied to the impactor. A total of 60,000 thick shell elements and 13,760 solid elements were used in this model. Figure 1 shows the FEM model setup for LVI condition.
FEM model used in the low velocity impact case. Note that a mesh size of 1 and 2.5mm was utilised for the laminate and backing plate, respectively.

The impactor was constrained in all directions, except the vertical (z-axis), following the experimental boundary conditions. A full constraint was applied on the backplate, whilst no constraint was given to the composite plate. The composite plate was fixed on the backplate, and a contact algorithm (CONTACT AUTOMATIC SURFACE TO SURFACE) was used between the two parts to model their interactions. The contact algorithm utilises linear springs, with the stiffness of each spring calculated based on the bulk modulus of each connected parts (composite plate and impactor/composite plate and backplate).
Under High Velocity Impact (HVI) condition, no backplate (as in the case of LVI modelling) was utilised. This is because the composite plate was supported using braided Kevlar yarns on a custom house-made fixture in the experiment. The 16mm diameter steel spherical projectile for HVI loading was modelled using solid elements. A total of 60,000 thick shell elements and 3,584 solid elements were utilised in the HVI modelling.
2.2 Material models
MAT ELASTIC was chosen to represent the behaviour of the impactor and backplate, while MAT LAMINATED FRACTURE DAIMLER CAMANHO (MAT262) was selected to represent the behaviour of IM7/8552. The former material model is based on an hypoelastic formulation, suitable for modelling elastic isotropic materials such as steel. For the latter, the formulation is based on an energy-based damage mechanics material model, utilising fracture mechanics to represent material failure. A tri-linear initiation-propagation law was established for the tensile and compressive fibre failure, Fig. 2(a), and a bi-linear law was defined for failure in the transverse direction for both tensile and compressive failure modes, Fig. 2(a). Information for the energy input can be found by performing standard fracture mechanics-based laboratory tests such as Compact Tension/Compression or Four Point Bending (4PB). Finally, for Vectran/MTM57, a vectorised user-defined material model (UMAT 41v) was utilised. The material model uses a plane stress formulation which is briefly described in the previous section as well as in Ref. (Reference Syed Abdullah, Iannucci, Greenhalgh and Ahmad9) to represent the behaviour of Vectran/MTM57 composite material.
(a) Trilinear law to represent tensile and compressive fibre failure (b) Bilinear law to represent tensile and compressive failure in the transverse (matrix) direction.
 $l$
represent the characteristic element length [36].

Both material model formulations, (MAT262 and UMAT 41v), utilise the smeared crack approach in alleviating the mesh dependency. However, the calculation for the characteristic element length,
 ${l_c}$
, in MAT262 is slightly different from the approach described in subsection. While
 ${l_c}$
is taken as the smallest element length in the UMAT, MAT262 calculates
 ${l_c}$
from a purely geometrical approach which utilises information from the nodal connectivity. Inputs for the in-plane material properties are shown in Table 1 whilst for the fracture energies are given in Table 2.
2.3 Cohesive algorithm
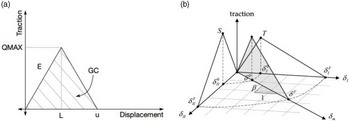
The delamination behaviour for each laminated composite used in the study was modelled using the commercially available cohesive algorithm in LS-Dyna. There are two types of cohesive algorithm commonly used to predict delamination damage by way of the Cohesive Zone Method (CZM). These are the cohesive surface and the cohesive element approach. In this study, the cohesive surface approach was utilised as no additional element was needed to model the interlaminar behaviour. The approach utilises a tiebreak contact formulation (CONTACT AUTOMATIC ONE WAY SURFACE TO SURFACE TIEBREAK: OPTION 9) to ‘tie’ the nodes of the part in contact using linear springs on each node. The behaviour of each spring is constituted by a bi-linear initiation-propagation law, based on fracture mechanics. The area under the curve (Fig. 3) represents the strain energy release rate (
 ${G_c}$
) for Mode I and II, and
 $\beta $
in Fig. 3 is the ‘mode-mixity,’ which defines the ratio of Mode I and II in a mixed-mode delamination case. Table 3 presents the inputs used in the cohesive algorithm.
In Plane material properties

*For Vectran/Epoxy the longitudinal and transverse tensile and compressive properties were assumed to be the same since the architecture is
 $0^{\circ}/{90^\circ }$
.
Fracture toughness inputs for composite materials used in this study

*Fracture energy for tensile fibre failure, taken from a Mode I translaminar fracture toughness test.
†Fracture energy for compressive fibre failure, taken from a Mode I translaminar fracture toughness test.
‡Fracture energy for transverse (matrix) tensile failure, taken from a Mode I interlaminar fracture toughness test.
 ${\unicode{x00B6}}$
Fracture toughness for transverse (matrix) compressive failure, taken from a Mode II interlaminar fracture toughness test.
Contact algorithm for interlaminar properties (a) Bi-linear initiation-propagation law (b) Mixed-mode I and II initiation -propagation law.

For the interaction between the composite plate and the backplate, and the composite plate with the impactor, CONTACT AUTOMATIC SURFACE TO SURFACE type was employed. This type of contact utilises a penalty stiffness based on linear springs between the two parts. The penalty (spring) stiffness is calculated based on the bulk modulus of the two parts (composite plate and backplate).
2.4 Mesh sensitivity study
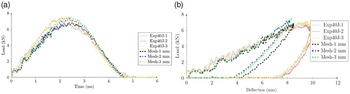
Although both MAT 262 and UMAT utilises the smeared crack formulation to alleviate mesh dependency, careful selection of mesh sizes must be made to ensure the convergence of results. This is due to the mesh dependency on the volume of damaged material, which is a common problem with many FE formulations [Reference Abdullah10, Reference Pinho14]. For this, a mesh sensitivity study was performed on the two material models used in this study. Note that all the experimental results presented in this paper has been presented in Ref. (Reference Syed Abdullah, Iannucci, Greenhalgh and Ahmad15). In the actual LVI experiment, a 90kN load cell (strain gauge based) was attached to the impactor to record the load-time history plots.
First, results from the mesh sensitivity study for UMAT is discussed. Figure 4(a) and (b) presents the load-time and load-deflection histories, respectively, for Vectran/MTM57 under 40J of LVI loading using three different mesh sizes. Results from the FE predictions were observed to converge as the mesh was further refined, resulting in a closer agreement with the experimental results. This is similar to the load-displacement response, where it can be observed that the irreversible strain was larger (closer to the experimental result), with a decrease in mesh size. Note the difference between the FE predictions on the impactor deflection and the experimental results. This will be discussed in Subsection 5.1.
Inputs for delamination prediction

(a) Load-time curve for 40J impact loading of Vectran/MTM57 using three different mesh sizes (b) Load-deflection response for 40J impact loading of Vectran/MTM57 using three different mesh sizes.

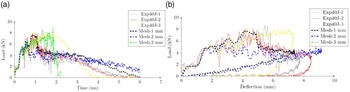
Secondly, the results for MAT262 are considered. Figure 5(a) and (b) presents the load-time and load-deflection histories, respectively, for IM7/8552 under 40J of LVI loading using three different mesh sizes. It can be observed that a considerable difference in the load-time and load-deflection response was indicated with a change in mesh size. Whilst the initial (elastic) response was nearly identical between all three mesh sizes, results tend to diverge as the mesh size increases.
(a) Load-time response for 40J impact loading IM7/8552 using three different mesh sizes (b) Load-deflection response for 40J impact loading of IM7/8552 using three different mesh sizes.

Further FEM analysis using MAT262 employed a mesh size of 1mm since the results are the most comparable when compared to the experimental observations. Also, the computational cost is not as excessive (approximately 4h of running time on a local PC for each analysis), which is a critical aspect in a FEM analysis.
Mesh biasing was not applied since the characteristic element length,
 ${l_c}$
, was manually entered in the model before the analysis. Therefore, the same lc may not be applicable for the different mesh sizes due to biasing. Hence, it is desirable to use a uniform mesh size throughout the analysis.
2.5 Delamination sensitivity analysis
While the objective in performing a mesh sensitivity study is clear, it is also important to investigate the effects of the cohesive algorithm in the FE model. In the current FE analysis, the model was discretised into four separate layers, each representing a specific number of plies with respect to the experimental laminate. Each ply is represented by a through-thickness integration point, with the orientation adjusted according to the ply orientation. Three cohesive surfaces were placed in between the four layers, Fig. 6, with each layer having two cohesive surface segments to represent the ‘master’ and ‘slave’ surface.
Side view of the FE model. Note that the distance between each layer are slightly increased to illustrate the placement of each cohesive surface.

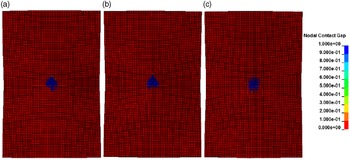
While the post-damage oscillations can be seen to reduce with an increase in the number of cohesive layers used in the model, no significant difference can be observed in the load-time response, Fig. 7. This is also shown by the contour of FE delamination prediction, Fig. 8, exhibiting no considerable difference with respect to the number of cohesive layers. More importantly, this highlights that under LVI loading, delamination damage is not the primary source of energy absorption, partly due to the enhanced interlaminar properties of Vectran/MTM57 laminate, consistent with the experimental observation.
Load-time response for 100J impact loading of Vectran/MTM57 with varying layer of cohesive surface.

FEM prediction on the delamination damage under 100J loading at the middle layer (a) One cohesive layer (b) Two cohesive layer (c) Three cohesive layer.

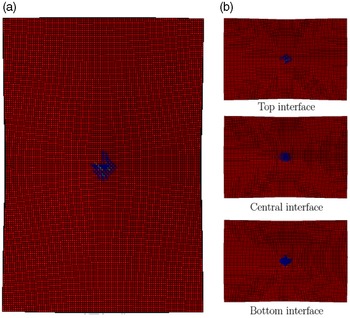
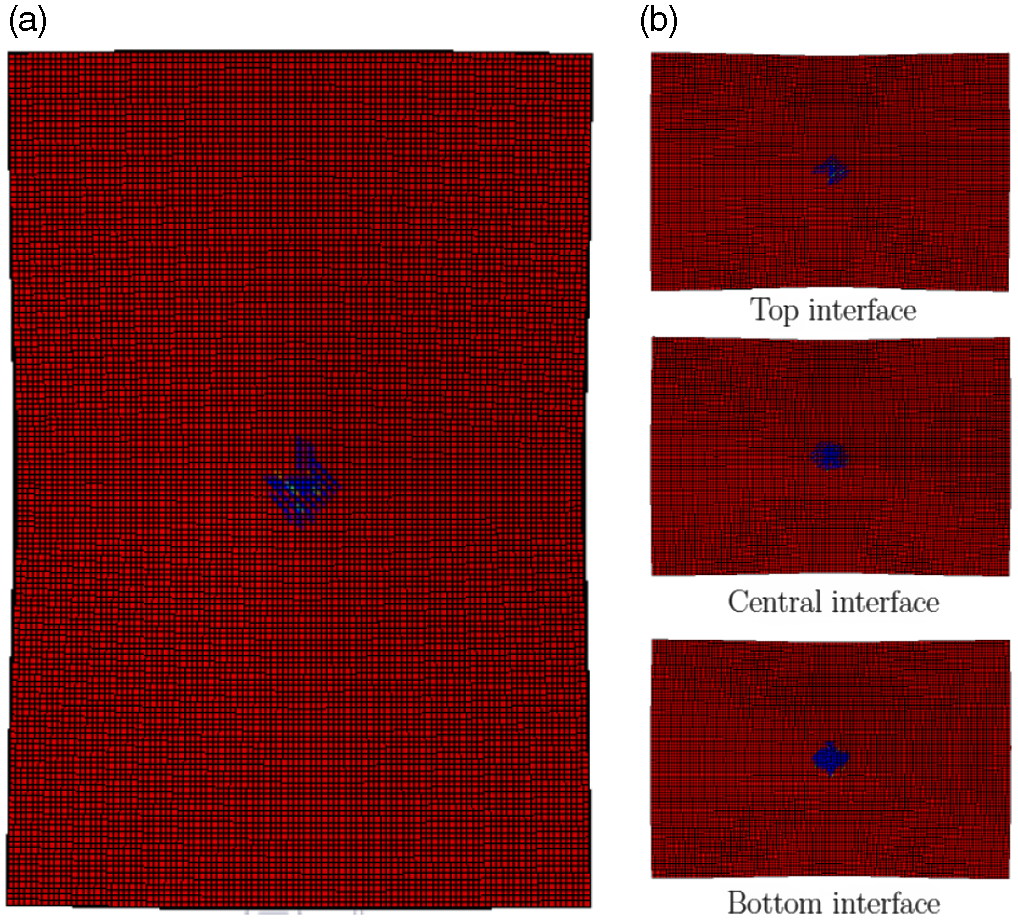
However, the use of three cohesive surface resulted in a greater dispersion of energy from delamination damage. This is shown in Fig. 9, where each layer is seen to have delaminated. Moreover, while the influence of delamination may not be significant under LVI, substantial delamination damage can be seen under HVI impact. Therefore, the use of three cohesive layers in HVI modelling may be beneficial due to the greater energy absorption, hence predicting a more accurate result.
FEM prediction of delamination under 100J LVI loading using three cohesive surfaces (a) Average envelope (b) Individual interface.
3.0 Results
3.1 Low velocity impact
3.1.1 IM7/8552
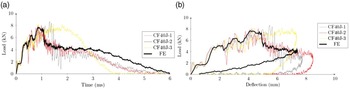
In general, all the FEM predictions under all three energy levels (40, 100, and 160J) displayed a good correlation with the experimental results. However, a number of issues were found during the FE analyses. First, MAT262 does not consider any definition of residual strain in the material formulation, hence resulting in an unloading curve returning to the origin upon load removal. This can be seen in the 40J impact case, where the load-displacement response, Fig. 10(b), unloads to the origin towards the end of the simulation.
(a) FEM prediction of the load-time response for 40J impact loading on IM7/8552 and compared with three experimental results (b) FEM prediction of the load-deflection response for 40J impact loading on IM7/8552 and compared with three experimental results.

Large oscillations can also be observed in the experimental load-time and load-displacement histories under all energy levels. These oscillations were thought to be due to the natural frequency of the impactor, in addition to other external forces such as vibrations from the LVI rig. These effects were not included in the FE model, which may result in the relatively smooth response observed in the FEM predicted load-time and load-deflection histories.
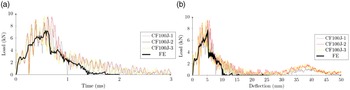
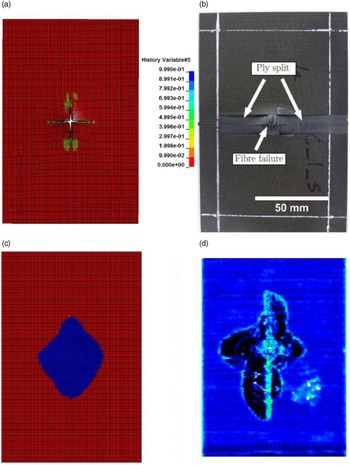
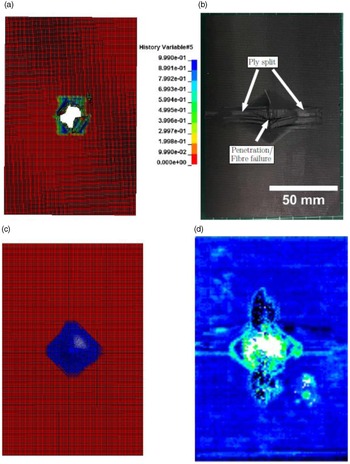
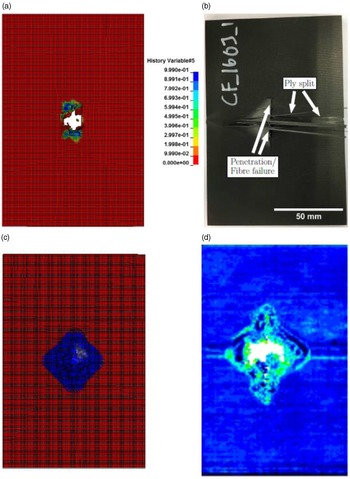
Under the 100 and 160J energy levels, a better correlation can be observed between the FEM model and the experimental results, shown in Figs. 11 and 12. This is mainly because in both cases, complete penetration has occurred. Examination of the predicted delamination indicate the FE prediction slightly under-estimating the experimental results by approximately 20%. This is thought to be due to the bi-linear formulation of the cohesive algorithm, which may be too simplistic and does not explicitly consider the failure mechanism under interlaminar failures, such as the fibre-bridging effect. In spite of this, the typical rhombus shape normally observed for UD cross ply laminates under impact loading was well predicted by the FEM model at each impact energy level, shown in Figs. 13(c), 14(c), and 15(c) for 40, 100, and 160J LVI energies, respectively.
(a) FEM prediction of the load-time response for 100J impact loading on IM7/8552 and compared with three experimental results (b) FEM prediction of the load-deflection response for 100J impact loading on IM7/8552 and compared with three experimental results.

(a) FEM prediction of the load-time response for 160 J impact loading on IM7/8552 and compared with three experimental results (b) FEM prediction of the load-deflection response for 160 J impact loading on IM7/8552 and compared with three experimental results.

Comparison of experimental and simulation results for 40J impact load on IM7/8552 (a) FEM prediction of damage on the laminate back face. Contours showing the damage associated with tensile fibre failure (b) Experimental back face damage (c) FEM prediction damage (d) C-scan results.

Comparison of experimental and simulation results for 100J impact load on IM7/8552 (a) FEM prediction of damage on the laminate back face. Contours showing the damage associated with tensile fibre failure (b) Experimental back face damage (c) FEM prediction damage (d) C-scan results.

Comparison of experimental and simulation results for 160J impact load on IM7/8552 (a) FEM prediction of damage on the laminate back face. Contours showing the damage associated with tensile fibre failure (b) Experimental back face damage (c) FEM prediction damage (d) C-scan results.

3.1.2 Vectran/MTM57
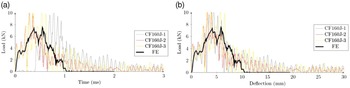
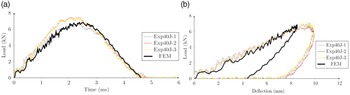
The load-time and load-deflection histories are presented in Fig. 16, respectively for Vectran/MTM57 laminates under a 40J impact load. The predicted load-time response, correlates well with the experimental results, although a slight over-estimation on the peak load can be observed. An underestimation of the permanent through-thickness deformation can be seen in the load-deflection history, shown in Fig. 16(b), by approximately 2–3mm, hence leading to an underestimation of the energy absorbed by the FEM model in the 40J impact event.
(a) FEM prediction of the load-time response for 40J impact loading on Vectran/MTM57 and compared with three experimental results (b) FEM prediction of the load-deflection response for 40J impact loading on Vectran/MTM57 and compared with three experimental results.

This may be due to a number of reasons. First, it is observed that the experimental laminate experiences a local indentation, in addition to a global flexural response of the laminate. This is diagrammatically shown in Fig. 17, in which at the apex of the impact event, local deflection (indentation) allows the laminate to deform further, hence enabling the impactor to further travel downwards with respect to the laminate.
Impact response mechanism of Vectran/MTM57 laminates under low velocity impact loads (a) Before impact (b) During impact (c) After impact.

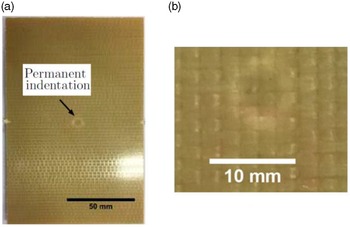
This mechanism often results in an observable permanent indentation, which is visible in the impacted specimens. This effect is even more pronounced at higher impact energies if full penetration does not occur. It can be clearly seen in Fig. 18(b) that a circular white ‘ring’ is present on the laminate front face, due to a localised tensile straining upon impact. The highly localised damage seen in Fig. 18 may also be influenced by Vectran’s fabric architecture, where the stitches present in the fabric promote localised through- thickness damage, resisting further delamination damage throughout the laminate [Reference Potluri, Hogg, Arshad, Jetavat and Jamshidi16]. This effect is more pronounced on polymer fibres with poor compressive properties (such as Dyneema and Vectran), in which significant permanent indentation can be observed on the laminate after impact [Reference Hazzard, Hallett, Curtis, Iannucci and Trask17].
Front face of Vectran/MTM57 after 40J impact loading (a) Experimental front face damage (b) Close-up view of the permanent indentation.

Second, the inherent nature of the shell element often results in an insufficient prediction of the surface indentation behaviour [Reference Bogenfeld, Kreikemeier and Wille18] due to the zero-stress through-thickness assumption. While the
 $\beta $
term was included to define the irreversible strain, the localised deformation observed may be due to the high dominance of through-thickness shear, which is not accounted for in the current formulation, due to the plane-stress assumptions. Third, transverse compression properties of Vectran fibres are also suggested to exhibit some form of irreversible deformation, owing to its fibrillar structure [Reference Cheng, Chen and Weerassoriya19, Reference Sockalingam, Bremble, Gillespie and Keefe20]. In addition, the nature of polymeric epoxy resins often displays some form of plastic deformation [Reference Yamini and Young21], further promoting permanent indentation in the laminate.
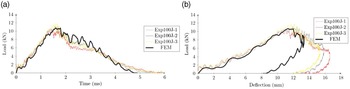
Figure 19 presents the load-time and load-deflection histories for the 100J LVI loading on Vectran/MTM57 laminates. While the load-time response is in a good agreement with the experimental results, Fig. 19(a), a similar underestimation of the through-thickness deformation can be observed in the load-deflection history, Fig. 19(b), resulting in an underestimation of the energy absorption by the FEM model. As stated earlier, the underestimation in the through-thickness deformation is largely due to the influence of through-thickness stresses, particularly in shear. Thus, an explicit definition of the through-thickness stress must be included in the material formulation to capture this response.
(a) FEM prediction of the load-time curve for 100J impact loading on Vectran/MTM57 and compared with three experimental results (b) FEM prediction of the load-deflection curve for 100J impact loading on Vectran/MTM57 and compared with three experimental results.

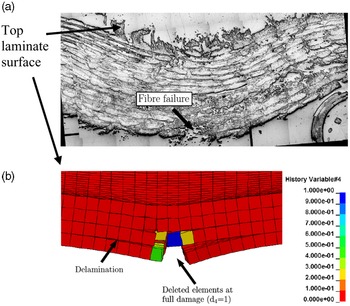
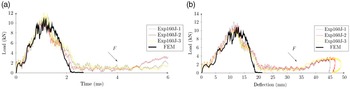
In addition to the significant permanent indentation, some evidence of fibre failure can be observed on the rear face of the laminate, Fig. 20(a), due to the large tensile strain experienced under LVI. The FEM prediction, shown in Fig. 20(b), was also observed to predict fibre failure, in line with the experimental observation seen in Fig. 20(a). Finally, for the 160J impact case, both the load-time and load-deflection histories showed very good correlation with the experimental results. Complete penetration can be observed in both the experimental result and the FEM prediction, shown in Fig. 21. However, the post-impact response (after penetration has occurred) was not captured in the FE model, as this was due to the friction between the impactor and the laminate after penetration has occurred, identified as ‘F’ in Fig. 22.
Damage observed in the Vectran/MTM57 specimen under 100J of LVI loading (a) Optical micrograph showing fibre failure (b) Predicted failure in the FEM model including fibre failure and delamination. Contours representing fibre tensile damage.

Damage observed in the Vectran/MTM57 specimen under 160J of LVI loading (a) Optical micrograph showing extensive fibre failure at every ply (b) Damage prediction from the FEM model showing complete penetration. Contours representing fibre tensile damage.

(a) FEM prediction of the load-time curve for 160J impact loading on Vectran/MTM57 and compared with three experimental results (b) FEM prediction of the load-deflection curve for 160J impact loading on Vectran/MTM57 and compared with three experimental results.

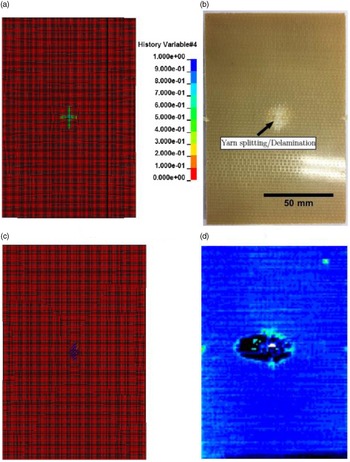
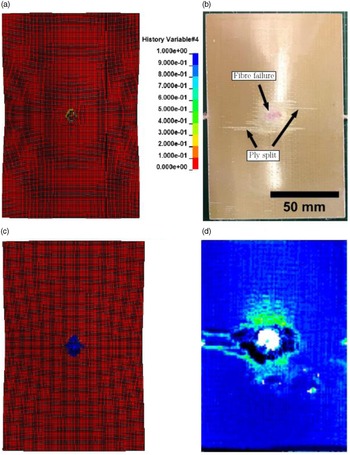
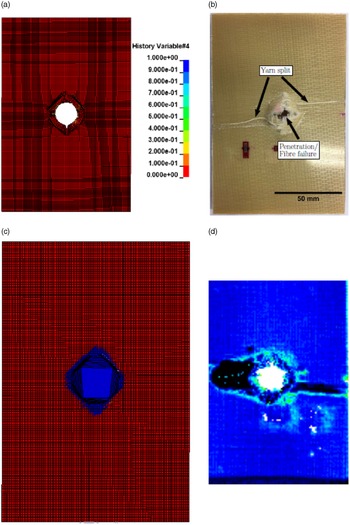
An underestimation on the delamination damage can be observed in the FEM model when compared to the experimental results. Similar to the case of IM7/8552, the simplistic bi-linear formulation does not account for specific toughening mechanisms in delamination behaviour, particularly fibre-bridging effects, which is highly dominant in Vectran/MTM57 composites. Figures 23, 24 and 25 presents the delamination prediction by the FEM model, as well as the experimentally observed delamination damage. Also shown in Figs. 23, 24 and 25 are a comparison between the FEM model and the experimental observations of the damage observed on the back face of the laminate.
Comparison of experimental and simulation results for 40J impact load on Vectran/MTM57 (a) FEM prediction of damage on the laminate back face. Contours showing the damage associated with tensile fibre failure (b) Experimental back face damage (c) FE prediction damage (d) C-scan result.

Comparison of experimental and simulation results for 100J impact load on Vectran/MTM57 (a) FEM prediction of damage on the laminate back face. Contours showing the damage associated with tensile fibre failure (b) Experimental back face damage (c) FE prediction damage (d) C-scan results.

Comparison of experimental and simulation results for 160J impact load on Vectran/MTM57 (a) FEM prediction of damage on the laminate back face. Contours showing the damage associated with tensile fibre failure (b) Experimental back face damage (c) FE prediction damage (d) C-scan results.

3.2 High velocity impact
3.2.1 IM7/8552
The ballistic curve for IM7/8552 is shown in Fig. 26, where it can be observed that the FEM predictions were in close agreement with the experimental results, albeit with an overestimation at each impact level (
 $V_{50}^{FE}$
≍ 115m/s;
 $V_{50}^{exp}$
≍ 90m/s). This could be mainly due to the plane stress assumptions for the FE modelling, which neglects the through-thickness properties of the laminate, hence resulting in a slightly higher
 ${V_{50}}$
compared to the actual experiment.
Impact versus residual velocity for FEM predictions and experimental measurements for IM7/8552.

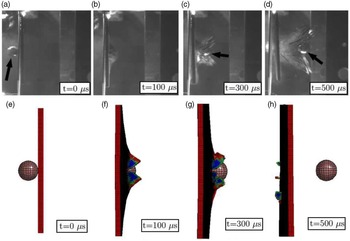
The experimental and FEM predicted HVI events are also shown in Fig. 27, where extensive ply-splitting can be observed on the laminate back face, upon projectile impact. This was not predicted by the FEM model, as it requires extensive mesh refinement, modelling each layer of ply (in this case, 32 plies), connected with the cohesive algorithm. However, this would result in a high computational time, due to the significant number of elements involved, as well as the amount of cohesive algorithm used.
HVI events on IM7/8552 at
 ${V_i}$
≍ 115m/s. (a) – (d) Experimental HVI events (e) – (h) FEM predictions. Black arrow showing projectile.

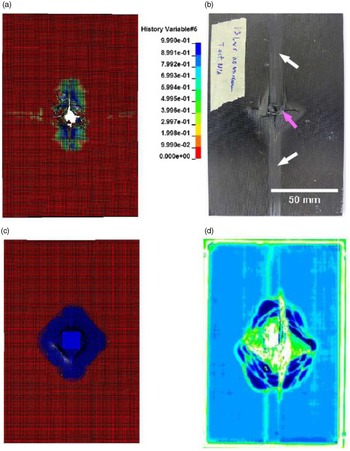
Also shown in Fig. 28 is the delamination prediction by the numerical model using a contact algorithm as explained in Subsection 2.3. It can be observed that the FEM prediction underestimated the delamination area when compared to the C- scan results – see Fig. 28 (FEM: 1972mm2; Exp: 3,138mm2).
Comparison of damage on IM7/8552 laminate under ≍ 92m/s impact velocity. The black arrows represent ply-splitting whilst the red arrow represents fibre fracture. Contours represent fibre damage (a) FEM prediction (b) Experimental specimen (c) FEM delamination prediction (d) C-scan results.

This is because the cohesive algorithm used in the FEM model defines a single linear softening curve, which may not be suitable for predicting the fibre-bridging effects. Thus, the use of advanced cohesive algorithms such as the bi-linear or a multi-linear softening model may improve the delamination prediction, as it more accurately represents fibre-bridging effects in the formulation.
3.2.2 Vectran/MTM57
Figure 29 presents the ballistic curve for Vectran/MTM57 laminates under HVI loading. It can be observed that the developed UMAT is in good agreement with the experimental results (
 $V_{50}^{FEM}$
≍ 153m/s;
 $V_{50}^{Exp}$
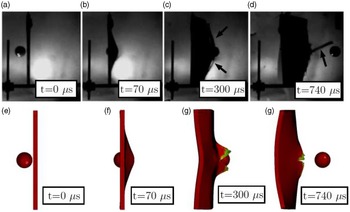
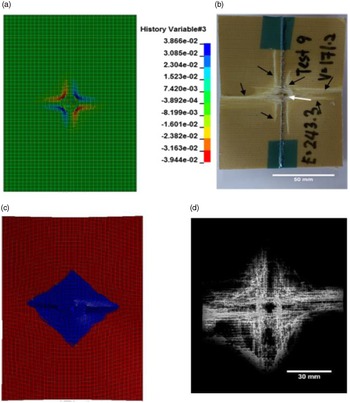
≍ 161m/s), although at higher velocities, the FEM prediction tends to overestimate the residual velocity. It can be seen from Fig. 30 that extensive ply-splitting has occurred at the back of the laminate, which was not predicted by the UMAT. However, closer inspection of the laminate revealed extensive compressive damage on the laminate front face, Fig. 31, extending along both directions. This is suggested to exist initially due to shear damage, in which the front face of the laminate undergoes irreversible shear (shear strain/stress exceeding its linear elastic strain/stress, Fig. 31(a)), therefore damaging the matrix. As a result of matrix damage, the compressive strength (due to damage in the matrix) is reduced hence yielding a damage pattern as observed in Fig. 31(c), due to the flexural motion experienced upon impact.
Impact versus residual velocity for FEM predictions and experimental measurements for Vectran/MTM57.

HVI events on Vectran/MTM57 at ≍ 170m/s (a) – (d) Experimental HVI events (e) – (h) FEM predictions. Black arrow showing ply-splitting.

Comparison of damage on Vectran/MTM57 laminate under ≍ 170m/s impact velocity. The black arrows represent ply-splitting whilst the red arrow represents fibre fracture. Contours represent fibre damage (a) FEM prediction (b) Experimental specimen (c) FEM delamination prediction (d) C-scan results.

Also shown in Fig. 31 is the numerical prediction of the delamination damage. Similar to the other composites, the FEM model resulted in an underestimation of the delamination area, similar to the case of IM7/8552 (FEM ≍ 2092mm2; Exp ≍ 3,871mm2). This is thought to be due to the simplified bi-linear law of the cohesive algorithm. Further, the inherent NCF characteristics that involve stitches often lead to an arbitrary crack propagation path due to the crack arresting mechanism promoted by the stitches.
4.0 Discussion
4.1 Permanent indentation
The occurrence of the permanent indentation on the laminate surface is seen as an energy absorption mechanism to resist impactor penetration. This is particularly true for Vectran/MTM57 composites since a small region of damage was observed under LVI loading for the 40 and 100J case. While the
 $\beta $
term controls the amount of irreversible strain in the in-plane direction for both tensile and compressive direct stresses, the through-thickness behaviour was not modelled within the present UMAT framework, particularly the through-thickness shear. Moreover, although the ‘penalty’ method was utilised to represent the normal and through-thickness shear stresses, it is possible that the approach could not adequately predict the stress localisation due to the local indentation. This is because the ‘penalty’ approach used in the current UMAT formulation assumes a linear stress-strain relationship in the through-thickness direction, which may be an oversimplification of the actual through-thickness behaviour in Vectran/MTM57 composite.
For Vectran/Epoxy, permanent indentation is observed together with other damage modes such as matrix cracking and fibre failure. However, a significant underestimation in the load-deflection response is observed, due to the absence of any explicit permanent strain definition in the tensile and compressive failure modes, such as the
 $\beta $
term in the developed UMAT formulation. Furthermore, the plane-stress assumptions imposed in the UMAT place strict limitations on predicting the through-thickness behaviour of Vectran/Epoxy laminate, hence resulting in the underestimation in terms of the impact energy absorption.
One strategy in capturing the effects of permanent indentation in composite laminates is by discretising the model into ‘strips’ and connecting them using a cohesive algorithm based on the intralaminar (matrix) energy release rate. This was shown by Bouvet et al. [Reference Bouvet, Castanie, Bizeul and Barrau22], when modelling the effects of permanent indentation in CFRP laminates. The approach was observed to capture very well the permanent indentation seen on CFRP laminates under LVI loading, with excellent correlation between the FEM model and the experimental results. However, apart from the long computational times, and complex meshing techniques, the approach requires through-thickness effects to be defined.
4.2 Strain-rate effects
The significance of the strain-rate effects in transverse impact loading is particularly important, especially for Glass Fibre/Epoxy (GF/Epoxy) and polymer fibre-based composites [Reference Singh23–Reference Zhu, Mobasher, Erni, Bansal and Rajan28]. Furthermore, MAT262 does not offer any enhancement on the tensile and compressive modes from strain-rate effects. Hence the enhancement must be performed manually to obtain a good correlation with experimental results. In contrast, Carbon Fibre/Epoxy (CF/Epoxy) composites were found to be strain-rate independent under tensile and compressive modes [Reference Singh23]. Under ±45° in-plane shear, a considerable improvement was evident in the initial shear stiffness and strength, as well as the shear strength at failure (
 $G_{12}^0$
,
 $\tau _{12}^0$
,
 $\tau _{12}^u$
, respectively) with increasing strain-rates [Reference Iannucci and Ankersen5, Reference Singh23].
Due to the lack of information on the strain-rate effects in Vectran fibres (or laminated composite), it is proposed that laminated composites based on Vectran fibres would behave differently under different strain-rate. This is because other polymers, especially those having a similar ‘skin-core’ structure as Vectran, behaves differently with respect to strain-rate, with an average improvement of approximately 30% in the fibre tensile strength and modulus [Reference Tan, Zeng and Shim24, Reference Zhu, Mobasher, Erni, Bansal and Rajan28, Reference Wang and Xia29]. As a composite, the sensitivity with strain-rate is greater, with some researchers reporting an increase of up to 50% in its tensile properties (strength and modulus) [Reference Harding and Welsh26, Reference Daniel and Liber27, Reference Woo and Kim30].
The fibre-matrix interface also plays a major role in determining the composite sensitivity to strain-rate effects. A weak interface strength is often an indicator of high sensitivity to strain-rate effects, and vice versa [Reference Termonia31]. It has been reported that the fibre-matrix interfacial shear strength,
 ${\tau _i}$
in a Vectran/Epoxy composite system is approximately 19.5MPa [Reference Zeng and Netravali32]. This is considerably low compared to that of Carbon/Epoxy composites (
 ${\tau _i}$
> 40MPa [Reference Koyanagi, Ogihara, Nakatani, Okabe and Yoneyama33]). Thus, this indicates a stronger dependency on strain-rate effects. Although the effect may not be as large under LVI compared to HVI, some improvements on the material properties may still exist with increasing velocity. Thus, the material inputs should be adjusted accordingly to account for the effect of strain-rate. Finally, future work on Vectran composites should also be dedicated to characterising these strain rate effects.
4.3 Delamination
The experimental observations present a spectrum of damage modes, which translate into potential sources of energy dissipation, hence defining the impact performance of a composite material. While most of the damage modes such as delamination, fibre failure and matrix failure (using MAT262) were captured by the numerical model, there still exists other types of damage modes which cannot be predicted using the current material models. In particular, the effect of stitches which is an inherent characteristic of NCF composites remains elusive, since the use of the cohesive algorithm in this study considers a single linear softening curve, hence neglecting any effect of stitching or fibre-bridging. This results in a generic delamination mapping, which follows the local element orientation based on the material inputs. However, the propagation of delamination, especially under HVI loading is difficult to predict due to the presence of stitches which results in an indeterminate change of crack path in the laminate. This is not accounted for in the current cohesive algorithm formulation. Further, due to the fibrillar nature of Vectran fibres, fibre-bridging is particularly important as a toughening mechanism under delamination damage. This requires advanced cohesive algorithms which employ a bi-linear or multi-linear softening curve to define the effect of the fibre-bridging mechanism. Table 4 presents a summary of the FEM prediction on the delamination damage, as well as the measurements from the experimental observations for LVI. Here, the variation on predicted delamination damage with respect to the energy level can be observed.
For IM7/8552, the largest delamination was observed at 40J of impact energy level, following which a decreasing trend can be seen with increasing impact energy level. This could be explained due to the impact energy (and impact velocity) has well exceed the laminate impact energy (and impact velocity), therefore damage induced by the impactor was reduced. In contrast, for Vectran/Epoxy, an impact energy of 40J induced little to no observable damage, compared to significant damage and penetration at the same energy level.
Comparison of FEM prediction and experiments on the measured delamination area under LVI. Units in mm2

*Using MAT262.
†Using UMAT 41v.
(a) Comparison between the average normalised absorbed energy for all laminates under LVI loading – FEM versus experiments (b) Comparison between the average normalised peak load for all laminates under LVI loading – FEM versus experiments.

Illustration of the bi-linear approach using MAT262 for the ±45° in-plane shear response of IM7/8552.

Under HVI loading, the difference between numerical predictions and experimental observations were ultimately larger. In most cases, the delamination area predicted by the FEM model is approximately 50% smaller than the experimental results.
4.4 Numerical accuracy
While it can be observed that the material models used in the current work (MAT262 and UMAT) are able to simulate the LVI and HVI response of IM7/8552 and Vectran/MTM57 composites, it is important to fully investigate the accuracy of the numerical model, particularly the developed UMAT for Vectran/MTM57. Figure 32 presents a comparison from the average normalised energy absorption between the numerical prediction and the experimental results. Here, two observations can be made. First, the FEM predictions can be observed to underestimate the experimental results for both LVI and HVI loading conditions. Under LVI, the load-deflection response for all composites are considerably underestimated, resulting in a significant underestimation in the energy absorption. As stated before, this is because the material formulation does not consider any effects on permanent strain in the tensile and compressive failure modes. It should be noted that MAT262 was developed based on the response of carbon fibre composites, which are well known to have little to no plastic component apart from the ±45° in-plane shear [Reference Maimi, Camanho, Mayugo and Davila34, Reference Maimi, Camanho, Mayugo and Davila35]. Thus, the effects of permanent strain are neglected in the material formulation.
Secondly, a bi-linear approach in modelling the ±45° in-plane shear of laminates is seen to be a slight oversimplification of the shear response. This is illustrated in Fig. 33, where it can be observed that the ±45° in-plane shear component using MAT252 results in an overestimation, particularly in the non-linear region where the composite undergoes strain-hardening. This could result in a stiffer response in the numerical model, hence yielding an underestimation in the Back-Face Deflection (BFD), particularly under HVI loading. This is shown in Fig. 34, where it can be observed that the FEM prediction always result in an underestimation of the absorbed impact energy, due to the larger residual velocity,
 ${V_i}$
, upon projectile penetration. The FEM under- estimation on other damage types such as delamination, will also influence the amount of impact energy absorption predicted by the numerical model. This is because delamination damage is the most severe under HVI loading, particularly for Vectran/MTM57 laminates. In addition, damage types such as ply-splitting and stitch failure, particularly for NCF based architecture, should also be included to yield a more realistic numerical prediction, hence resulting in a better correlation with the experimental observations.
Average normalised energy absorption per unit weight under HVI loading between the FEM and experimental results.

Figure 32(b) presents the average normalised peak loads for all laminates under LVI loading. It can be seen that the numerical model, both MAT262 and UMAT 41v are able closely predict the peak load with the experimental results with a considerable accuracy. This is an excellent feature which could be attributed to the energy-based modelling approach utilised by both material models in this work. In contrast with other modelling approaches such as the strain/stress failure criteria, failure does not occur when the stress reaches its maximum strength. Rather, failure is taken at full damage (d = 1), which allows the laminate to continue carrying load even when the maximum stress has been reached. This is the great advantage of the energy-based modelling strategy, which compensates the longer computational time compared to the more simpler strain/stress failure criteria approach.
5.0 Conclusion
This chapter present outcomes from the FEM modelling of IM7/8552, and Vectran/MTM57 under LVI and HVI loadings. It was found that MAT262 predicted with a considerable accuracy the LVI and HVI response of IM7/8552 and composites, despite a number of drawbacks due to the formulation of the material model. First, a large underestimation on the permanent deflection is observed from the load-deflection histories of IM7/8552. This is because MAT262 does not consider any definition of permanent strain in its material formulation, such as the
 $\beta $
component in the developed UMAT. Secondly, the effects of strain-rate on the tensile and compressive failure modes have to be manually adjusted, due to the strain-rate sensitivity.
The developed UMAT for Vectran/MTM57 composite was observed to be in good agreement with the experimental results under LVI and HVI loadings. Similar to the case of MAT262, an underestimation is observed in the load-deflection response, although the effects of permanent deflection were explicitly included in the material formulation. This is thought to be due to the large influence in the through-thickness stresses, particularly the shear component. Therefore, a 3D formulation should be developed to fully capture the composite response under LVI loading.
Finally, it was found that the cohesive algorithm employed in the FEM model underestimated the delamination behaviour for the composite materials under LVI and HVI loadings. This is especially true for Vectran/MTM57 composites, where fibre-bridging is one of the dominant toughening mechanisms, apart from the effects of NCF stitches. This is largely due to the simplistic nature of the bi-linear approach, which does not explicitly include any effects of fibre-bridging. Thus, advanced cohesive formulation should be employed, such as the multi-linear or exponential softening formulation, to be able to better predict the extent of delamination damage in composite materials under impact loadings.