Introduction
Man-made materials which promote cell adhesion, migration and proliferation are central to numerous medical applications.[ Reference Knapp, Tower, Tranquillo and Barocas 1 , Reference Stevens and George 2 ] For instance, successful implants and bone augmentation scaffolds rely upon the healthy integration of the material and a seed layer of cells.[ Reference Johnson, Lancaster, Zhen, He, Gupta, Kong, Engel, Krick, Ju, Meng, Enquist, Jia and McAlpine 3 , Reference Melchiorri, Hibino, Best, Yi, Lee, Kraynak, Kimerer, Krieger, Kim, Breuer and Fisher 4 ] Biomaterials for wound healing and regeneration aim to promote adhesion but also target cell division, differentiation, and migration.[ Reference Griffin, Weaver, Scumpia, Di Carlo and Segura 5 – Reference Ren, Tu, Bischoff, Weisgerber, Lewis, Yamaguchi, Miller, Harley and Lee 8 ] All such materials should be designed with an understanding that cells respond to a variety of environmental signals, both physical.[ Reference Chen, Mrksich, Huang, Whitesides and Ingber 9 – Reference Wirtz, Konstantopoulos and Searson 13 ] and chemical.[ Reference Jiang, Bruzewicz, Wong, Piel and Whitesides 14 – Reference Muinonen-Martin, Susanto, Zhang, Smethurst, Faller, Veltman, Kalna, Lindsay, Bennett, Sansom, Herd, Jones, Machesky, Wakelam, Knecht and Insall 16 ] The most extensively studied biochemical adhesion mechanism involves specific bonds between cell surface proteins, or receptors, and molecules in the extra-cellular environment, called ligands. In addition, cell adhesion is known to be strongly dependent on substrate roughness and stiffness,[ Reference Lo, Wang, Dembo and Wang 17 – Reference Jiang, Suen, Wang, Zhang, Wertheim and Ameer 21 ] which depend conditionally upon chemical interactions as well since topography can alter the adsorption and presentation of ligands. The design of high–fidelity interfaces between cells and man-made materials will require the co-optimization of these physical and chemical parameters.
Creating surfaces in which these properties can be combined and independently tuned, has proven to be a challenging fabrication problem. As a result, most of our insight comes from substrates designed to characterize one particular adhesion or cell guidance mechanism. With regard to chemical signaling, it has long been recognized that extracellular glycoproteins such as fibronectin and collagen promote adhesion and migration.[ Reference Ricoult, Thompson-Steckel, Correia, Kennedy and Juncker 22 , Reference Smith, Elkin and Reichert 23 ] Preserved amino acid sequences, such as the Arg-Gly-Asp (RGD) motif, are found in many of these proteins and known to bind specific membrane-bound receptors (i.e., integrins).[ Reference Humphries, Byron and Humphries 24 , Reference DeLong, Gobin and West 25 ] Substrates functionalized with RGD of varying surface densities have been employed to illuminate the average inter-molecular distance above which cell adhesion declines, as well as its dependence on receptor clusters known as focal adhesions.[ Reference Huang, Grater, Corbellinl, Rinck, Bock, Kemkemer, Kessler, Ding and Spatz 26 , Reference Cavalcanti-Adam, Volberg, Micoulet, Kessler, Geiger and Spatz 27 ] The strength of adhesion in turn strongly influences cell motility in a bi-phasic manner, with high receptor-ligand bond densities favoring static conditions and low-densities preventing adequate support for migration.[ Reference Palecek, Loftus, Ginsberg, Lauffenburger and Horwitz 28 ]
Studies of cell adhesion as a function of substrate surface roughness show a variability that is highly cell-type specific.[ Reference Nikkhah, Edalat, Manoucheri and Khademhosseini 29 , Reference Anselme and Bigerelle 30 ] For example, while bone cells tend to show improved bonding with increased surface roughness, epithelial cells adhere more efficiently to smoother surfaces. Commonly utilized isotropic roughening techniques for investigating cell adhesion include sanding, sand blasting and chemical etching, and have the advantages of being applicable to a wide range of materials while covering surface areas typical of large implant devices, such as hip implants.[ Reference Anselme and Bigerelle 30 ] The surfaces created by these techniques, however, form a spectrum of topographies which can be challenging to characterize. For instance, commonly used roughness parameters such as the amplitude's arithmetical mean deviation, Ra, have been found to vary significantly depending on the measurement technique and the length scale under investigation.[ Reference Anselme and Bigerelle 30 , Reference Giljean, Najjar, Bigerelle and Iost 31 ] Beyond the additional care required to characterize such surfaces lies more challenging questions regarding which length scales, or combinations thereof, are driving the induced cell phenotypes.
A spectrum of topographies will naturally impart complex characteristics to surface-bound signaling molecules.[ Reference Galli, Coen, Hauert, Katanaev, Groning and Schlapbach 32 , Reference Lord, Foss and Besenbacher 33 ] The analyte binding activity of these molecules—as relates to crowding, orientation, and state of naturation—can be markedly different on rough surfaces versus smooth ones. Adding to the characterization challenge is the fact that there are numerous mechanisms by which such ligands can coat the substrate, only some of which are under the experimentalist's control, including (i) deposition as part of the surface preparation protocol (ii) adsorption from the media, and (iii) secretion by the cells, or any combination of the three.
To simplify roughness interpretation as well as introduce well-defined anistropic topographies, lithographic approaches are now commonly used.[ Reference Charras and Sahai 34 , Reference Kim, Han, Gupta, Kwon, Suh and Levchenko 35 ] Taking advantage of masking techniques developed primarily for the semiconductor industry, optical or electron beam resists can be patterned with nanoscale precision. Such patterns can be used as hard masks during reactive ion etching such that uncovered substrate regions can be etched to a defined depth, creating a 3D architecture. Alternatively, the patterned substrates can be used as 3D molds for a different, cell compatible material, such as polydimethylsiloxane, which is cured and then transferred to a new substrate. The resulting surface architectures have illuminated the fact that cells are exquisitely sensitive to surface topography. Lithographically patterned steps as small as tens of nanometers can cause a wide range of cell types to preferentially orient and migrate along shoulders, a phenotypic behavior known as contact guidance.[ Reference Fraser, Ting, Mallon, Wendt, Murphy and Nealey 36 , Reference Mahmud, Campbell, Bishop, Komarova, Chaga, Soh, Huda, Kandere-Grzybowska and Grzybowski 37 ] In addition, these surfaces can be designed to mimic in vivo structures such as collagen bundles, providing in vitro models for studying cell migration, and adhesion in a variety of physiological contexts such as wound healing and development.
This potent capability—the culturing of cells on a wide range of precisely defined 3D surfaces—has enabled a deeper set of questions to be asked regarding the nature of contact guidance: to what degree is such guidance governed by the surface-imparted physical constraints and to what degree is it due to lithography-induced variations in surface chemistry? Contact guidance experiments conducted on the same surface but with differing culture media have been shown to give variable results with regards to cell orientation,[ Reference Teixeira, Abrams, Bertics, Murphy and Nealey 38 , Reference Teixeira, McKie, Foley, Berticsc, Nealey and Murphy 39 ] indicating the importance of both physical and chemical context, but their interdependencies have proven challenging to decouple. This is a result of the fact that quantitative surface chemistry characterization is hindered by the same 3D topographical and media composition factors discussed above for the isotropic roughening techniques.
In this work, we present a solution to this challenge by independently patterning two materials on a single chip, one for topography, and the other for chemical functionalization. The first material, quartz, is light microscopy compatible and can be dry etched for 3D topography formation. The second material, gold, was incorporated as a substrate for presenting well-defined surface chemistries and patterned independently of the quartz etching process. We show that precise quartz patterning can be achieved while holding the biochemical functionalization properties of the gold constituent constant. This enabled the investigation of individual cells exposed to a single type of gold surface functionalization but two distinct quartz substrate topographies. In addition to decoupling topographical and chemical cues, the fact that such variations can be introduced within the footprint of a single cell ensured a single phenotype was investigated, eliminating enzymatic state variations that must be accounted for in experimental approaches that rely upon cell-to-cell comparisons. The A549 lung carcinoma cell line, the surface adherence of which has previously been shown to vary significantly with roughness,[ Reference Gentile, Tirinato, Battista, Causa, Liberale, di Fabrizio and Decuzzi 40 ] was chosen to validate the approach.
Experimental methods
Substrate cleaning
The substrates used for patterning the nanostructures and nanopillars were 25.4 mm diameter quartz coverslips (SPI Supplies) with an average thickness of 170 µm. Substrate cleaning involved soaking in piranha acid (3:1 H2SO4: H2O2) for a minimum of 10 h and then washing with copious amounts of deionized, distilled water (DDW). [Caution: piranha solution reacts violently with organic materials; it must be handled with extreme care, followed by rinsing with copious amounts of DDW]. Substrates were rinsed with acetone followed by IPA and baked on a hot plate to dehydrate the surface and promote resist adhesion.
Nanolithography of nanostructures
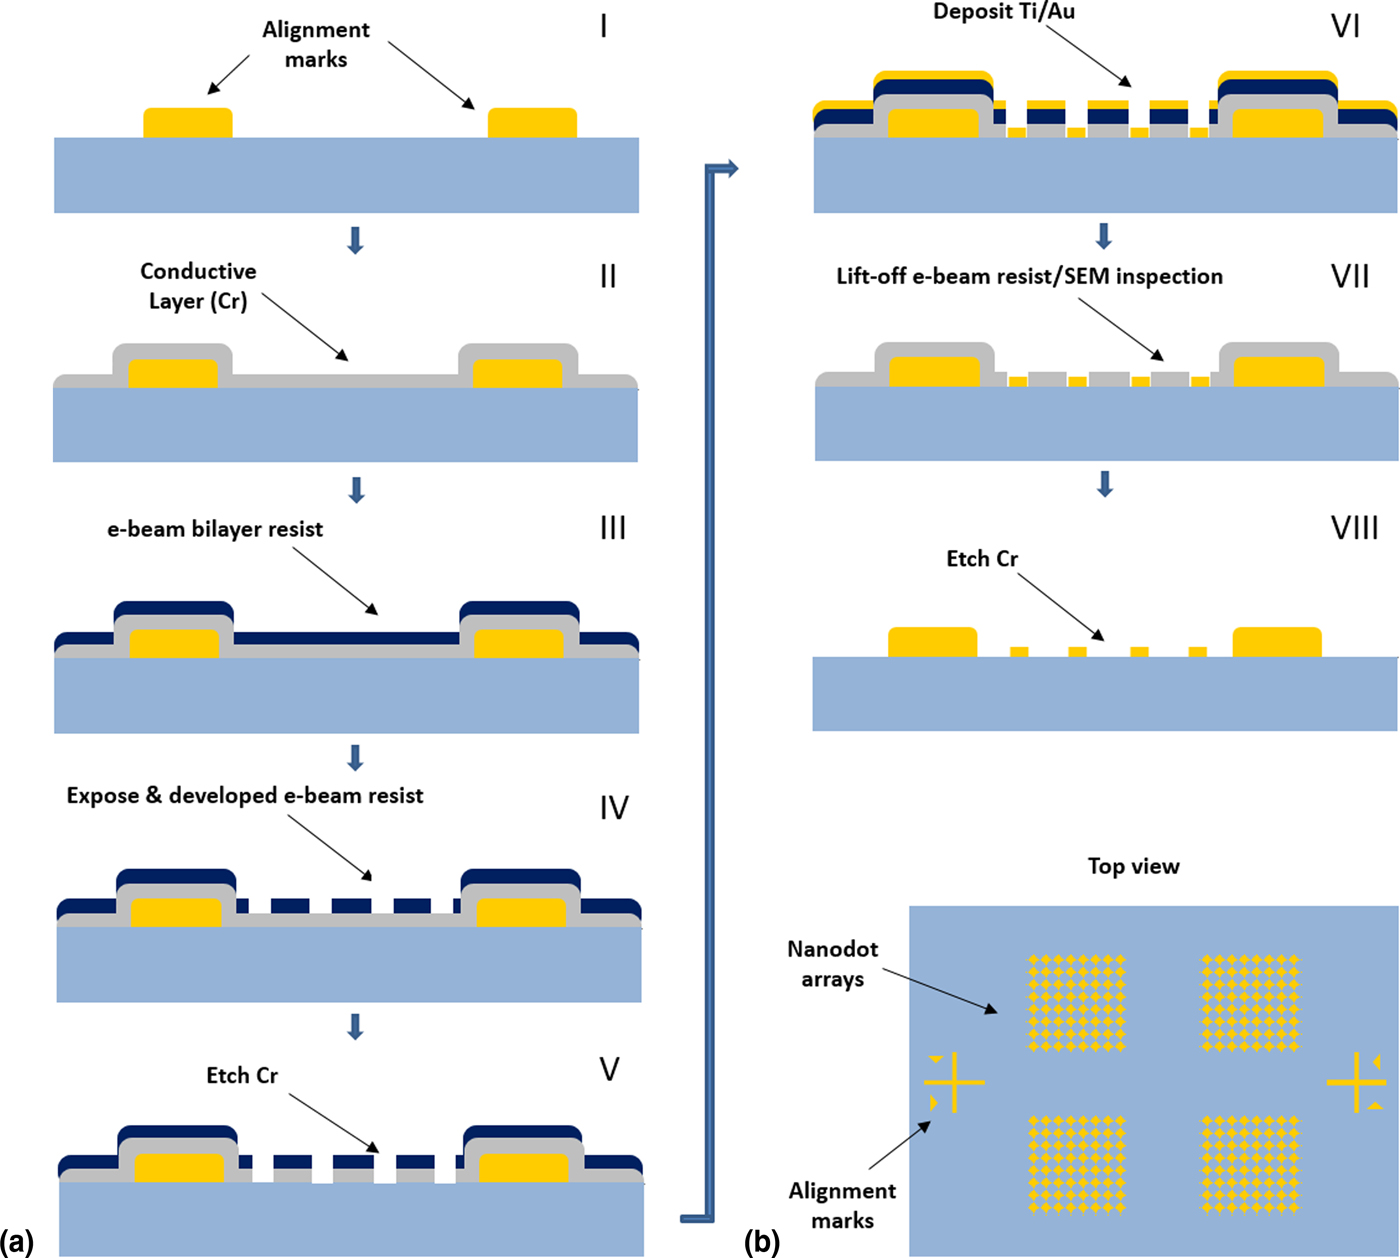
The nanodot lithography steps are illustrated in Fig. 1. First, a 10 nm chromium thin film was deposited using a Temescal e-beam evaporator as a conducting underlayer. A bilayer process was used to facilitate lift-off. In this process, an undercut of the bottom layer was created to promote discontinuity of the deposited metal film. The copolymer used, MMA-EL6 (Microchem), is closely related to PMMA (Poly methyl methacrylate) and spins on with a thickness of 180 nm at 2000 rpm. Next, PMMA A4 resist (Microchem) was spin-coated at 3000 rpm to a thickness of 250 nm. Samples were then patterned via electron beam lithography (EBL) using area doses of approximately 300 µC/cm2 and circular beam deflection profiles (Raith 150). The resist was developed for 60 s in a 1 IPA : 2 MIBK (isopropanol to methyl isobutyl ketone) solution from Sigma Aldrich. After developing, the quartz sample was rinsed in IPA for 60 s. The conducting Cr layer was etched for 10 s, using chrome etchant CR-7 solution from KMG Electronic Chemicals, Inc. A quick “descum” oxygen plasma cleaning step was performed (20 s, oxygen plasma, 30 mTorr). Ti (5 nm)/Au (80 nm) was deposited with an e-beam evaporator. Following this metal deposition, the PMMA/copolymer bilayer was lifted off by soaking in acetone for 4 h. The quartz samples were then rinsed with acetone and IPA. Samples were inspected by scanning electron microscope where the remaining Cr was again used as a conducting layer. Afterwards, the remaining Cr layer was etched away using CR-7. The nanostructures were patterned in arrays of 20 × 20 structures with each chip consisting of 68 arrays. The pitch of the nanostructures within the arrays was 600 nm and the size of each patterned nanostructures was 75 nm in diameter.
(a) Schematic of the nanolithography sequence. (I) Au alignment marks were made by evaporation in a lift-off process. (II) A Cr thin film was evaporated as a conducting layer to avoid charging during e-beam lithography. (III) An e-beam photoresist was applied and the chip was subsequently exposed, developed, and Cr etched as shown in (IV) and (V). (VI) Ti/Au film evaporation. (VII) e-beam resist was removed and the chip was inspected using a scanning electron microscope (SEM). (VIII) Cr layer removal. (b) Top view schematic of the chip after step (VIII) with alignment marks and 20 × 20 nanodot arrays patterned atop the quartz surface.

Optical lithography and reactive-ion-etching of nanopillars
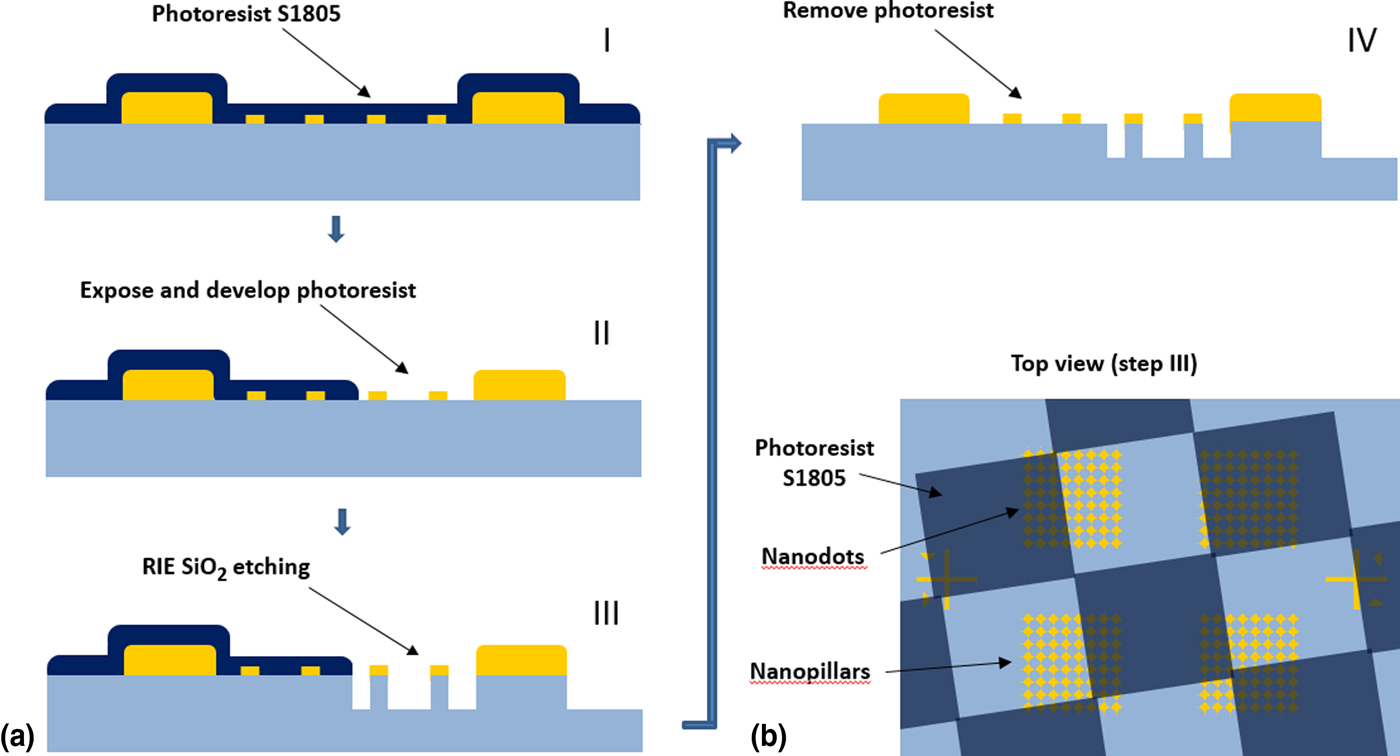
After nanofabrication, localized patches of nanopillars were created by reactive-ion-etching regions of the chip specified by a checkerboard patterned mask (Fig. 2). First, S1805 resist (Shipley) was spin-coated atop the nanodots at 4000 RPM and baked for 120 s at 100 °C. Next, a checkboard pattern with 25 µm × 25 µm squares was exposed using a chromium photomask and SUSS MJB3 aligner and subsequently developed with Shipley MF319 (developing time 20 s), leaving half the squares exposed for reactive-ion-etching while the remaining S1805 squares served as a protective layer against the etching process.
(a) Schematic of nanopillar fabrication steps (I) The entire chip was spin-coated with S1805 resist (dark blue). (II) The resist was exposed in a checkerboard pattern with a standard contact UV aligner and developed. (III) The remaining S1805 protected the chip's covered portions during RIE etching. (IV) The remaining resist was removed with acetone/IPA leaving areas nanopillars and nanodots. (b) Top-view schematic of the chip after step (III): The S1805 covered parts of the arrays in a checkerboard pattern which was offset so that individual arrays consisted of both nanodots and nanopillars.

The S1805-patterned chip was placed on a 4 in diameter silicon carrier wafer and dry etched in a reactive ion etcher (RIE) from AXIC, Inc. with a gas mixture of O2 and CHF3 at flow rates of 30 standard cubic centimeters per minute (sccm) for O2 and 50 sccm for CHF3. The chamber pressure was 40 mTorr and the forward power 100 W, resulting in a gas-mixture ionization voltage of 375 V. The RIE process lasted for 570 s with a quartz etch rate of ~0.35 nm/s. After etching, the chip was removed from the silicon carrier wafer and the remaining resist was removed with acetone and rinsed with isopropanol.
Optical and topographical characterization
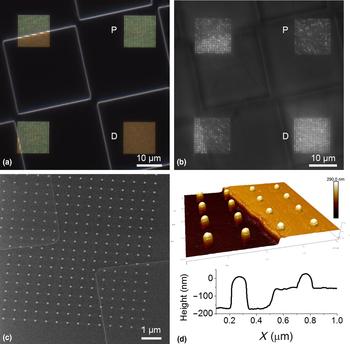
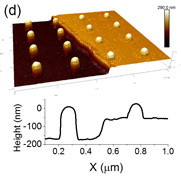
The fabricated chips were characterized optically by dark field microscopy and nanoplasmonic imaging[ Reference Raghu, Christodoulides, Delehanty, Byers and Raphael 41 ] [Figs. 3(a) and 3(b)] to investigate size uniformity and the nanopatterned surfaces’ structural integrity. Dark-field images were captured with a color camera with the nanodots (D) exhibiting a red-shifted nanoplasmonic color versus the yellow nanopillars (P). Similarly, nanoplasmonic imaging [Fig. 3(b)], which is optimized for the red portion of the visible spectrum, showed more intense scattering from the nanodots than the nanopillars. Both of these results are consistent with the expectation that the quartz etching process would also etch the gold to a lesser extent, leaving the nanopillar gold cap's diameter smaller than that of the nanodots. To quantify the etch rates and characterize the sizes and shapes of the nanostructures, the chips were imaged under both helium ion microscopy and atomic force microscopy (AFM) [Figs. 3(c) and 3(d)]. From the helium ion microscopy images, the measured mean nanopillar diameter was 9% smaller than that of the nanodots (68 ± 1 nm versus 75 ± 2 nm, Supporting Material). The mean nanopillar height as measured by AFM was 178.6 ± 2.0 nm, of which approximately 62 nm was gold and 116 nm quartz from the etching process. The AFM-measured mean nanodot height was 84.5 ± 2.3 nm. Based on these values, and approximating the gold shapes as ellipsoidal, the nanodots presented 46% more gold surface area than the nanopillars. In terms of structural integrity, >99.95% of the patterned gold structures were present and withstood repeated vigorous rinses with ethanol, buffer, and DDW without breaking or delaminating. This enabled repeated surface regeneration with hydrogen plasma ashing after each experiment and subsequent biofunctionalization via the application of a two-component, thiol-based self-assembled monolayer (SAM) described below.
(a) Dark field image (color) of nanodot (D) and nanopillar arrays (P) on the finished chip (b) LSPRi image of nanodot and nanopillar arrays on the finished chip. (c) Helium ion microscope image of a combination of nanodots and nanopillars and (d) (top) 3D AFM topography of a 4 × 4 area of dots and pillars showcasing the etched quartz boundary; (bottom) representative cross-section of single nanodots, nanopillar, and etched quartz boundary.

Biofunctionalization
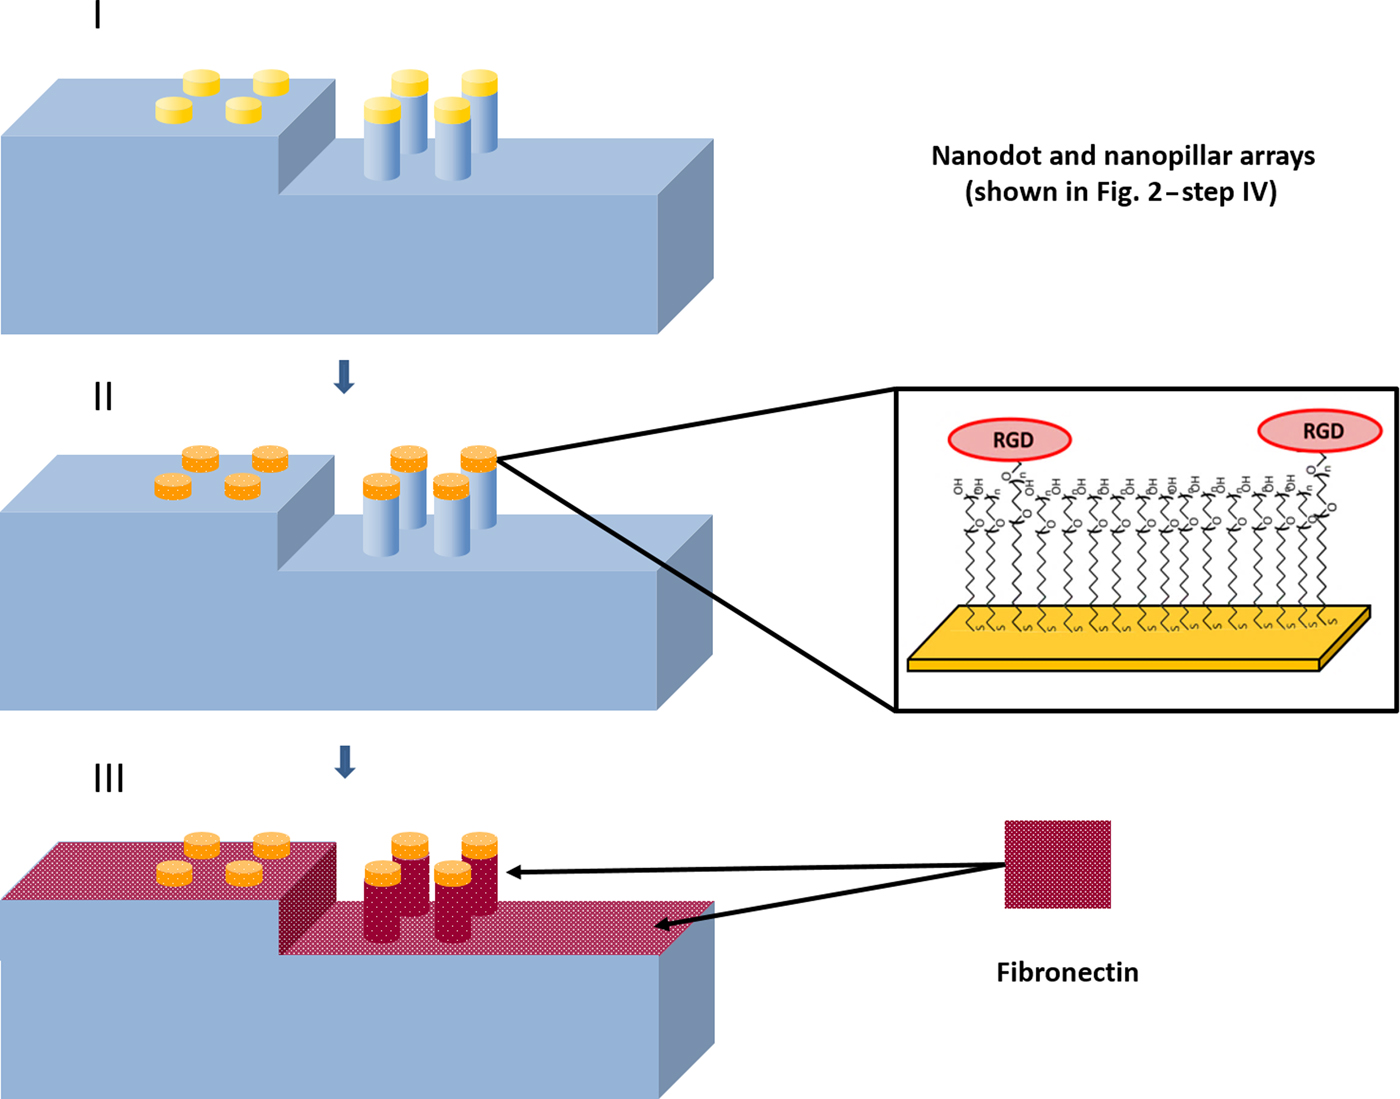
The plasma cleaning and biofunctionalization procedure has been described in detail previously[ Reference Raghu, Christodoulides, Delehanty, Byers and Raphael 41 , Reference Raphael, Christodoulides, Delehanty, Long and Byers 42 ] and is illustrated in Fig. 4. Briefly, RF plasma ashing (40 W) with 300 mTorr of a 5% hydrogen, 95% argon mixture was used to clean the quartz and gold surfaces. The gold nanostructures were then biofunctionalized with a two-component, SAM using an ethanolic-based thiol bath (0.5 mM), consisting of a 5:100 ratio of SH-(CH2)11-EG3-COOH to SH-(CH2)8-EG3-OH (Prochimia) for 18 h, where EG stands for ethylene glycol monomer. After rinsing in EtOH and drying the chip under flowing nitrogen gas, the carboxyl terminus was activated with a 1:1 mixture of 133 mM of 1-Ethyl-3-(3-dimethylaminopropyl) carbodiimide (EDC, Thermo Fisher Scientific) and 33 mM of N-hydroxysuccinimide (NHS, Thermo Fisher Scientific) in DDW for 10 min and then rinsed with 0.1 M phosphate buffered saline (PBS). The activated carboxyl group was then conjugated with 0.5 mg/mL of RGD peptide (Sigma) in PBS for 30 min and rinsed with copious PBS. Finally, the surface was drop coated with 0.1 M ethanolamine in PBS for 10 min as a deactivation step to reduce non-specific binding at the carboxyl sites not conjugated to RGD. To promote adhesion to the quartz substrate, the chip was drop coated with 10 ug/mL of fibronectin (Thermo Fisher Scientific) in PBS for 1 h at room temperature and washed with cell media consisting of Dulbecco's Modified Eagle's Medium (DMEM. Corning) supplemented with 10% fetal bovine serum (ATCC).
Gold nanostructure biofunctionalization procedure. (Top) After plasma ashing to clean the surface, a two-component self-assembled monolayer (SAM) is formed, after which the carboxyl terminus is activated via EDC:NHS chemistry, and then conjugated with RGD peptide (Middle). Fibronectin was then adsorbed to the quartz surface to promote cell surface adhesion (Bottom).

Because surface contaminants adversely impact biofunctionalization by preventing SAM layer formation, positive controls experiments are necessary to ensure the gold surfaces are biologically active as designed. Such contaminates in the forms of proteins, nucleic acids and lipids are common after live cell experiments so we utilized a previously described nanoplasmonic imaging assay to ensure our cleaning and functionalization protocol resulted in chips with reproducible sensitivity to the analyte.[ Reference Raghu, Christodoulides, Delehanty, Byers and Raphael 41 , Reference Raphael, Christodoulides, Delehanty, Long and Byers 42 ] In short, the biofunctionalization procedure described above was used to form a 1:3 two-component SAM of SH-(CH2)11-EG3-COOH to SH-(CH2)8-EG3-OH and the COOH component was then conjugated to pentylamine-biotin (Thermo Fisher Scientific) using the same EDC/NHS crosslinking protocol. The microfluidic injection of 100 nM neutravidin over the biotinylated surface gives a quantifiable shift in the nanoplasmonic resonance peak of the gold nanostructures which results in the brightening of the nanostructures as measured by the CCD camera (Supporting Material). The reproducibility of this shift was utilized to verify successful gold surface regeneration and biofunctionalization.
Cell culture and lifeAct plasmid transfection
Human lung epithelial carcinoma cells, A549 (CCL-185, ATTC), were cultured in plastic flasks or petri dishes containing DMEM supplemented with 10% fetal bovine serum (ATCC) and Penicillin (100 IU)-Streptomycin (100 µg/mL) solution (Corning Cellgro) and placed in an incubator set to 37 °C and 5% CO2. Approximately 1.5 × 10⁵ cells were plated onto each 35 mm plastic petri dish. After 24 h, cells in 80% confluence were then subjected to transfection with lipofectamine 2000 (Thermo Fisher Scientific). For transfection, cells were washed with 2 mL of DMEM without serum 3 times and then kept in 0.5 mL serum-free DMEM until the addition of DNA-lipofectamine complex. To obtain DNA-lipofectamine complexes, 0.2 µg of plasmid DNA, encoding the fusion of actin-binding peptide and green fluorescent protein, was mixed in 125 µL serum-free DMEM at room temperature (RT) for 5 min and then was added into the lipofectamine solution, which had 2.5 µL of lipofectamine 2000 diluted into 122.5 µL of serum-free DMEM. The mixture was incubated at RT for 30 min, before adding to the cells in a 35 mm dish and placed in the CO2 incubator for 5 hrs, followed by the addition of 3 mL complete DMEM with serum. After 24 h, cells were washed 2 times with PBS without Calcium and Magnesium and were trypsinized by adding 1 mL of trypsin-EDTA (ATCC) at 37 °C for 3–4 min before the addition of DMEM with serum. Cells were then spun down at 130 × g for 10 min and the cell pellet was re-suspended in 1 mL of DMEM with serum. Cell numbers were counted (Nexcelome Cellomoter) and the distribution of fluorescent cells was measured by using flow cytometry (Accuri C6) and are tabulated versus control cells in the Supporting Material.
Live cell microscopy
Live cell imaging was performed using transmitted light illumination and a 63X, 1.46 numerical aperture oil-immersion objective. A thermoelectrically-cooled CCD camera (Hamamatsu ORCA R2) was used to capture images in both bright field and LSPRi modes. The fluorescent imagery was taken using a Yokagawa spinning disk confocal microscope with the same objective and coupled to an Andor iXon EMCCD camera. A heated stage and temperature controlled enclosure held the stage temperature at 37.0 ± 0.04 °C (Zeiss). Humidity and CO2 were regulated at 98% and 5%, respectively, by flowing a gas-air mixture through a heated water bottle and into the enclosure. XY plane drift was corrected for with image alignment software (Zeiss Zen Blue) and focus was stabilized using an integrated hardware-based focus correction device (Zeiss Definite Focus).
Approximately 75 cells were drop coated on the chip and incubated for 1 h to provide time for surface adhesion. Time-lapse live-cell imaging was conducted with fluorescence, a bright field and LSPRi images captured at each time point. The exposure times were 1 s, 500 ms, and 150 ms, respectively. Quantitative measurements of the number of nanostructures the cell was in contact with were done by manually measuring the total surface area of a single cell on either nanodots or nanopillars via co-localized bright field/LSPRi images at each time point in ImageJ. The contact area was then divided by the area of a single nanostructure to calculate the number nanodots or nanopillars as a function of time. Each cell area measurement was repeated three times, and error bars represent ± one standard deviation.
Results and conclusions
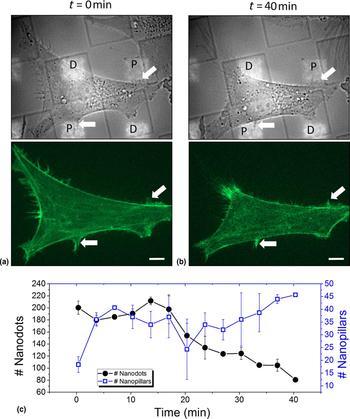
The integration of A549 cells with the lithographically patterned chips enabled imaging and quantitative analysis of individual cell dynamics making simultaneous contact with both nanopillar and nanodot surfaces. A representative experiment in which unfunctionalized Au nanostructures were employed to compare cell adhesion to the nanopillar (P) topography versus that of the nanodots (D) is shown in Fig. 5. At time t = 0 min the cell covered ≈200 nanodots versus ≈15 nanopillars [Fig. 5(a), top panel & 5(c)]. The white arrows highlight filopodia which extended over the nanopillars. Over the course of the experiment the cell contracted preferentially away from the nanodots and by t = 40 min covered only ≈80 nanodots while increasing contact with nanopillars by approximately threefold to ≈45 nanopillars [Fig. 5(b), upper panel & 5(c)]. The corresponding fluorescence imagery (Fig. 5, middle panels) shows high concentrations of GFP-actin persistently colocalized with the same nanopillars (white arrows), consistent with stable focal adhesion and filopodia formation. In contrast, the cell movements over the nanodots were considerably more dynamic (Movies S1 and S2, Supporting Material).
Preferential adhesion to nanopillars with unfunctionalized Au nanostructures (a) A549 cell spread over both nanodot arrays (D) and nanopillar arrays (P) at time t = 0 min. Top: merged brightfield and LSPRi images highlight the cell and nanostructures, respectively. The white arrows point to filopodia spread over the nanopillars. Bottom: corresponding fluorescent image highlighting the location of GFP-actin. The white arrows on the bottom point to areas of high GFP-actin concentration spatially correlated with the same nanopillar-coating filopodia from the top image. (b) The same cell at t = 40 min. The cell remained adhered to the nanopillar locations (white arrows) while exhibiting limited or no adhesion to the nanodot array. This correlates with the GFP-actin fluorescence imagery, which remained high at the nanopillar locations as well (Fig. 5b, lower panel). All images have been contrast-enhanced to highlight the filopodia. The full movies (Movies S1 and S2) can be found in the Supporting Material. Scale bar: 5 µm. (c) The number of nanodots (left, black circles) or nanopillars (right, blue squares) that the A549 cell is in contact with is measured over the course of 40 min. Initially, the cell is in contact with approximately 200 nanodots and about 18 nanopillars. The approximate number of nanostructures the cell is in contact with fluctuates stochastically, but the cell is observed to gradually reduce the number of nanodots in contact and increase the number of nanopillars in contact over the course of 40 min as it pivots towards the nanopillars.

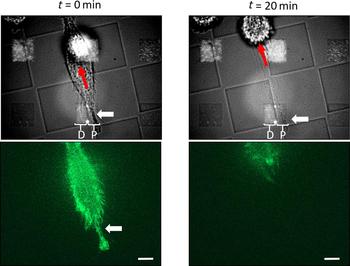
We also observed evidence that adhesion to nanopillars functionalized with RGD peptide was capable of impending cell migration. The cell in Fig. 6 was migrating in the direction of the red arrow and its tail covered an array of 400 nanostructures (white arrow). This array was bisected by the checkerboard etch pattern such that the left-hand side of the array consisted of nanodots (D) and the right nanopillars (P). The cell spread over both the nanodots and nanopillars during the course of the experiment but was preferentially pinned to the nanopillars [Fig. 6(a), top panel]. At time t = 0 the tail remained fixed over the nanopillars (white arrow) causing the cell to stretch (Movies S3 and S4, Supporting Material). At time t = 20 min the cell snapped free, leaving membrane fragments behind in the vicinity of the nanopillars [Fig. 6(b), top panel]. The GFP-actin fluorescence was observed to be highly concentrated and stable over the nanopillars [Fig. 6(a), bottom panel], up until the point when the tail released, indicative of integrin-mediated binding to the RGD peptide.
RGD-functionalized nanopillars impede migration (a) Top: merged brightfield and LSPRi images highlight a cell adhered to an array consisting of both nanodots (D) and nanopillars (P). Bottom: corresponding fluorescent images highlighting the location of GFP-actin. The tail of the migrating A549 cell (white arrow) spread over an array bisected by the checkerboard etch pattern such that the left-hand side of the array consisted of nanodots and the right-hand side of nanopillars. The red arrow in the top image indicates the migration direction. (b) The same cell at t = 20 min. The cell stretched and released from the nanopillars leaving fragments around the nanopillars (top image, white arrow). All images have been contrast-enhanced to highlight the cell membrane and GFP-actin. The full movies (Movies S3 and S4) can be found in the Supporting Material. Scale bar: 5 µm.

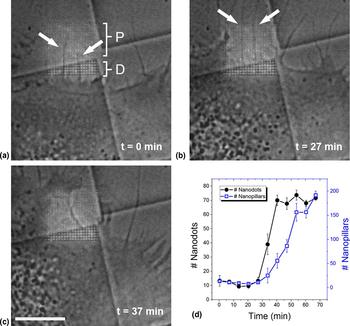
Cells were also observed to migrate in the direction of filopodia which were stable, colocalized to the RGD-functionalized nanopillars. Figure 7(a)–7(c) highlights two such filaments (white arrows) from a single cell stretched over the nanopillar portion of an array and Fig. 7(d) shows the filament contact with nanostructures as it evolves over time. While the other filaments in the image fluctuated stochastically about the quartz substrates, the highlighted filaments remained stable while in contact with approximately constant and equal amounts of nanodots versus nanopillars. At t ≈ 27 min [Fig. 7(b)], the two highlighted filaments mature and the cell begins to migrate in the direction of the nanopillar portion of the array. The number of nanodots is quickly saturated as the cell envelopes and spreads towards the nanopillars [Fig. 7(c) and Movie S5, Supporting Material].
Cell migrates in direction of nanopillar-pinned filopodia. The array was bisected by the checkerboard etch pattern with the brighter, lower portion consisting of nanodots (D) while the majority upper portion consisted of nanopillars (P) (a) Merged brightfield and LSPRi images highlighting the cell and nanostructures, respectively. The white arrows point to two filopodia that remained fixed atop the nanopillars throughout the time-course of the experiment. (b) At t = 27 min the two filopodia remain fixed and the cell has begun to spread over the array. (c) At t = 37 min the cell has engulfed the majority of the array. All images have been contrast-enhanced to highlight the cell membrane. The full movie (Movie S5) can be found in the Supporting Material. Scale bar: 10 µm. (d) The number of nanodots (left, black circles) or nanopillars (right, blue squares) that the A549 cell is in contact with as a function of time. The number of structures in contact with the cell remains approximately constant until t = 27 min, at which point the cell migrates towards the nanopillars. In this case, the number of nanodots quickly saturates to ~70 while the cell continues to envelop the rest of the nanopillar array, eventually encompassing approximately 200 nanopillars.

The live cell studies presented here were enabled by the fabrication of a two-component substrate, consisting of quartz and gold, designed for tuning roughness and chemical biofunctionality, respectively. Unique to this approach is the real-time observation of the live cell co-localized with nanostructures of specified geometry and surface chemistry. The result is an experimental platform capable of decoupling physical and chemical contributions to cell adhesion and migration in a manner that is not possible with single component substrates. Undetermined in this study was the degree to which the pillar topography altered the activity of fibronectin and other adsorbed media components, thereby influencing adhesion. However, the chip architecture allows for such questions to be addressed in future experiments in a straightforward manner by coating the quartz with well-established blocking agents such as BSA or PEG. The biofunctionality of the gold surfaces can also be tuned by varying the ratio of the two thiol components which comprise the self-assembled monolayer.
Within a given culture, cells will exhibit a range of phenotypic behaviors depending upon on where they reside in the cell cycle as well as from local variations in the chemical environment. As a result, a variety of responses will be observed for a given substrate and, in traditional approaches, such variability must be taken into account when investigating surface-dependent adhesion and migration. In our approach, individual cells are able to probe two distinct topographies, ensuring that phenotypic (and genotypic) variations are not confounding factors in interpreting the results.
Our measurements revealed preferential pinning of the cell membrane to nanopillars versus nanodots, with pinned regions correlated to higher concentrations of GFP-actin, validating our nanolithographic approach for exposing single cells to different, tightly controlled topographical cues. The fact that the location, size, and shape of each nanostructure is customizable also enables more complex designs which incorporate noise and gradients within the distribution of nanostructures. The mixture of such designs with those presented in this work, we believe, will become the framework of highly multifunctional chips for quantitative mapping of topographical cues for adhesion and migration. Also, unique to this approach is the addition of biofunctionalized gold nanostructures, which integrates chemical cues that can be lithographically varied and multiplexed. This combination of quasi-3D quartz topography in tandem with lithographically varied biofunctionalized gold nanostructures provides a platform well suited to the quantitative analysis of multi-cue environments and, in our view, has important implications for the engineering of cellular scaffolds.
Supplementary material
The supplementary material for this article can be found at https://doi.org/10.1557/mrc.2018.2
Acknowledgments
This work was supported by the Naval Research Laboratory's Institute for Nanoscience, the Chief of Naval Research (CNR), the Office of the Assistant Secretary of Defense for Research & Engineering (Vannevar Bush Award) and a National Research Council Research Postdoc Associateship Award for Dr. Deepa Raghu and Dr. Michael Robitaille.