Manipulating electoral outcomes is a key way for incumbents to preserve their hold on power. Influencing who runs, who votes and how votes are counted can increase the chances of victory at the ballot box (Birch Reference Birch2011). But how do incumbents decide when (and by which means) to violate electoral integrity? To date, much work has focused on the reasoning behind blatant, illegal electoral fraud, such as buying off voters, stuffing ballot boxes or engaging in voter suppression (Alvarez, Hall and Hyde Reference Alvarez, Hall and Hyde2009; Lehoucq Reference Lehoucq2003). But fraud is just one way to tilt the electoral playing field. Districts can be redrawn to advantage certain parties. Challengers can be repressed.Footnote 1 Independent media outlets can come under pressure, preventing some campaigns from promoting their ideas and candidates to voters. This range of tactics constitutes what some scholars have termed the ‘menu of manipulation’ (Schedler Reference Schedler2002). Strategies carry trade-offs, as incumbents must balance overall effectiveness against the costs of carrying out the manipulation and potentially getting caught.
We know little about how incumbents select options from this menu, if they do at all. To better understand their decision-making process, this article unpacks the technologies and administrative procedures often used to undermine electoral integrity. I argue that electoral malpractice centered on manipulating institutions (such as electoral law) generates lower costs than engaging in overt fraud. Manipulating institutions requires fewer resources to implement and incurs lower risks of public disapproval or criminal prosecution of responsible officials. By capturing legislative processes, incumbents can pass laws that legitimate such manipulation as well as frustrate attempts by rivals and civic activists to put forth legal challenges. Not only does the general public have a difficult time determining whether the law is being applied fairly; there is little recourse to punish those responsible for tilting the playing field. Voters are unable to corroborate whether electoral law is being evenly applied and are more likely to accept the government's actions as justified. Intervening early in the electoral process and under legal cover offers significant advantages over committing electoral fraud.
To demonstrate this empirically, I focus on a common institutional tactic: ‘candidate filtering’ – that is, the selective registration of certain candidacies. This tactic is widespread across countries and political settings, but we lack data about how and why such an early-stage, pre-election intervention is used. I first draw on original survey experiments from Russia to show that respondents express less anger over rejected candidates than two types of electoral fraud. That subdued response translates into a lower likelihood of joining protests and turning out on election day, which represent two ways to punish incumbents who tamper with elections. Without clear-cut evidence that laws are being broken or applied arbitrarily, voters hesitate to designate these institutional manipulations as indicative of fraud and take accordant action.
These lower societal and legal costs then affect how incumbents deploy institutional manipulations vs. choosing to commit overt electoral fraud. I depart from previous studies to show that incumbents are more likely to abuse electoral law and reject candidates in order to tip close, competitive elections in their favor. That is, incumbents worry less about facing ex post punishment, and restrict ballot access precisely when they sense electoral vulnerability and/or the presence of strong challengers. To demonstrate this, I analyze new data on 25,935 mayoral elections in Putin-era Russia from 2005–2019. During this period, 10,231 (9.6 per cent) of 106,236 Russian mayoral candidates had their applications to run for office denied by local election commissions.
The partisan flavor of candidate filtering suggests its explicit use as a tool of electoral malpractice. A startling 68 (0.3 per cent) of 23,144 regime-affiliated candidates were refused the right to run. Instead, rejections are heavily concentrated among independent candidates and members of non-systemic opposition parties, which are both more autonomous from the government and less easily co-opted. These challengers are being strategically prevented from reaching the ballot precisely when the regime fears elections will not go its way. Rejection rates next increase when the incumbent declines to run for re-election. Given the greater uncertainty that open seats generate, governments take extra precautions to shape candidate slates to their own benefit and protect replacement candidates who cannot exploit incumbent advantages.
Using several measures of candidate viability, I then show that strong challengers are more likely to be rejected. Rejection rates are higher among better-educated candidates as well as those who possess financial resources from a past career in the private sector. Most importantly, challengers who have held office previously face substantially higher risks of being refused registration. The governing experience they can use to attract voters creates liabilities for incumbent officials, who intervene to remove them from the ballot and prevent them from attaining higher office. Results reported in the Appendix suggest that filtering out strong challengers is also strongly correlated with more favorable electoral outcomes for regime-affiliated candidates who make it to election day.
These findings make several contributions to the literature on electoral malpractice. Recent work has argued that fraud is common among more popular incumbent regimes (Simpser Reference Simpser2013), and is less likely to occur during competitive elections (Egorov and Sonin Reference Egorov and Sonin2014; Rozenas Reference Rozenas2016). Because fraud can enrage citizens, incumbents may be wary of going too far when elections are tight. Yet the greater the threat to their hold on power, the more powerful the incentives are to undermine electoral integrity in less observable ways. By widening the scope of manipulations studied, this article shows that high levels of uncertainty and political competition drive incumbents to tamper with elections by abusing electoral institutions. I develop a new approach to identify how such manipulations can be targeted at the micro level, while using survey experiments to demonstrate why incumbents have less to fear from filtering out challengers than committing fraud. This disaggregated approach improves our ability to show how ‘harder-to-detect’ manipulations allow incumbents to retain power even when levels of scrutiny are high (Harvey Reference Harvey2016).
This preference for institutional manipulations highlights how legal ambiguity and information asymmetries help governments exploit the law while avoiding societal blowback. Leaders are sensitive to how voters react to their actions to undermine democracy (Birch Reference Birch2011; Van Ham and Lindberg Reference Van Ham and Lindberg2015). By disguising institutional manipulations as normal lawmaking, they make it harder for citizens to detect flaws in the electoral process, while also depriving challengers of legal recourse and focal points for co-ordinating collective action (Tucker Reference Tucker2007). Selectively rejecting challengers also encourages and supports regime loyalists, akin to how the Russian government regulates non-governmental organization activity (Plantan Reference Plantan2019). My argument builds on similar work by Klaas (Reference Klaas2015) and Cheeseman and Klaas (Reference Cheeseman and Klaas2018) to argue that electoral exclusion can help a regime manage reputational risks when tampering with elections. It differs by focusing on the domestic rather than international costs (international election monitors rarely monitor subnational elections), while bringing in survey experiments to differentiate popular perceptions about electoral manipulations. The focus on lower-level elections and public opinion significantly improves our understanding of how incumbents are constrained by domestic political factors, while allowing for a more detailed analysis of which opposition figures are targeted and when this strategy is applied.
This article thus presents the first empirical study of the drivers of candidate rejections. Although scholars have highlighted how opposition candidates in Russia are prevented from running for office (Golosov Reference Golosov2011), no systematic evidence has been gathered on how electoral law is politicized to muffle challengers.Footnote 2 Using detailed data on individual registrations, the analysis reveals the Putin regime manipulates institutions to protect weak incumbents and defend against strong challengers. While related to work connecting electoral exclusion to governance and civil conflict (Klaas Reference Klaas and Cheeseman2018; Simpser and Donno Reference Simpser and Donno2012), this article goes further by modeling the trade-offs incumbents face between pre-election and post-election interventions. Although opposition parties may pay attention to institutional manipulations when deciding to protest election results (Chernykh Reference Chernykh2014), these findings demonstrate that they face an uphill battle in attempts to mobilize public anger over candidate filtering.
Unpacking Electoral Malpractice
Not all types of electoral manipulation are created equal. As Birch (Reference Birch2011) cogently explains, some electoral manipulations are costly to implement and require significant resources. Though seemingly straightforward, successfully organizing ballot box fraud requires extensive organization and the co-optation of local agents (Rundlett and Svolik Reference Rundlett and Svolik2016). Vote buying requires financial allocations and organization to reach pliable voters (Van Ham and Lindberg Reference Van Ham and Lindberg2015). Dense social networks of parties and brokers must monitor political behavior, which may not be always present (Frye, Reuter and Szakonyi Reference Frye, Reuter and Szakonyi2019a; Nichter Reference Nichter2008).
Beyond the tangible costs, incumbents can incur painful consequences if the violations they commit are exposed. First, actors carrying out manipulations face legal punishment if they are caught in the act (Harvey Reference Harvey2019). Intimidating voters requires the use of coercion, which may descend into violence and generate criminal liabilities. Secondly, incumbents may be wary of protests arising from disapproval and anger over the way elections were conducted (Kuntz and Thompson Reference Kuntz and Thompson2009; Tucker Reference Tucker2007). Fraud can lead voters to disengage from politics and stay home on election day, and delegitimize elections in the process (Simpser Reference Simpser2012). Incumbents face strong incentives to conceal the steps they have taken to undermine elections in order to prevent backlash (Beaulieu and Hyde Reference Beaulieu and Hyde2009).
This dual set of implementation and exposure costs varies across different types of electoral malpractice. Few studies have yet disaggregated the broad category of electoral manipulations or outlined the cost structure of the various strategies. Harvey (Reference Harvey2016) argues, for example, that strategies such as vote buying and voter intimidation carry a lower risk of exposure for government agents. Such dispersed tactics rely on societal actors and complicate efforts to monitor and hold agents accountable. The probability of getting caught stuffing ballot boxes may lead incumbents to adopt less detectable strategies (Sjoberg Reference Sjoberg2014).
This article focuses on types of electoral malpractice that rank relatively low in terms of the resources they require to implement and the potential fallout for implicated actors. Manipulating institutions – that is, the legal framework and administration of elections – may be the most cost-efficient, least visible and thus least risky avenue for skewing election outcomes (Birch Reference Birch2011; Norris Reference Norris2013). Examples of institutional manipulations include stocking election commissions with political sympathizers, curbing independent media and advertising, skewing access to public funding to favor certain parties, and selectively registering candidates to shape the options available to voters. Passing laws and handing down such decisions does not require developing clientelist networks and mobilizing large-scale financial resources. Instead, capturing legislative institutions and electoral commissions, which incumbent governments nearly by definition have achieved, is both necessary and sufficient.
Institutional manipulations are generally much less visible, and thus harder for election monitors, opposition activists, and the media to monitor and definitively establish that malpractice had occurred. By passing legislation through codified channels, incumbents can cloak their decisions in legal formalism that deters scrutiny and protects against later prosecutions. As Van Ham and Lindberg (Reference Van Ham and Lindberg2016, 11) write, ‘formal sanctions are no longer effective if oversight institutions are themselves successfully captured’. Governments can more easily persuade observers that their actions strictly adhere to the letter of the law and deserve less scrutiny. The general public may also be more likely to give the incumbents the benefit of the doubt that they are following the law.
This is not to argue that manipulating institutions is completely costless, but rather that it is less sensitive and harder to detect than fraud. Public outrage could result over ridiculously drawn electoral districts or the conspicuous rejection of nationally popular challengers (Klaas Reference Klaas2015). But on average, these types of manipulations are less likely to be clearly connected to malicious abuse of the system and spark protest. And while institutional strategies may lack in perceptibility, they abound in effectiveness. Shaping electoral administration tilts the playing field in favor of incumbents with a much greater degree of certainty (Birch Reference Birch2011; Van Ham and Lindberg Reference Van Ham and Lindberg2016).
The first argument of this article is then that institutional manipulations are less costly for incumbents to commit and draw less undesirable attention from the justice system and the public at large. One empirical implication is that voters should respond differently to incumbents who manipulate institutions rather than engage in overt fraud, such as vote buying or stuffing ballot boxes. Interpreting their actions as blatantly illegal or unreasonable requires more sophisticated examination. Voters are not personally experiencing fraud, nor is there verifiable evidence of fraud being committed, such as videos of ballot box stuffing or statistical analyses of actual vs. official turnout (Smyth and Turovsky Reference Smyth and Turovsky2018). Incumbents should therefore face lower societal costs for committing institutional manipulations in comparison to more blatant types of fraud. The popular appetite for punishing agents involved in manipulating electoral law is lower.
Hypothesis 1: Institutional manipulations will generate lower societal and legal costs for incumbents than overtly engaging in fraud.
Because incumbents are shielded from potential punishment, institutional manipulations can be deployed strategically to prevent challengers from unseating them. Otherwise fearful of the backlash that election fraud would cause, incumbents feel more able to intervene using institutions to ensure their hold on power. We might expect incumbents to manipulate electoral institutions when they sense electoral vulnerability and narrow margins of victory. Fraud that carries a lower risk of detection and liability becomes an attractive strategic option for ensuring victory in tight races. Opposition actors who cry foul about other excessive practices struggle to hold regimes accountable for manipulating institutions.
Secondly, we should expect regimes to use less detectable, attributable forms of fraud to target credible political challengers. Rivals with financial and organizational resources can more easily upend electoral competition and beat incumbents. Deploying blatant electoral fraud against such individuals can incur real risks for the government (such as post-election demonstrations). More nuance and subtlety are needed to handle such political threats. Intervening early and with clear legal authority enables incumbents to sideline challengers deemed capable of beating them in future elections. Voters may observe these candidates being rejected, but not see any wrongdoing in the legal process. Here again political uncertainty drives the use of electoral manipulation.
Hypothesis 2: Given their lower societal and legal costs, institutional manipulations will be more prevalent when regimes face electoral vulnerability and/or credible challengers to their rule.
Neutralizing the biggest threats to the incumbent government long before election day limits voters' options to express their unhappiness with the process. Though some fraud may be needed to ensure an adequate level of turnout for the purposes of legitimacy, skewing the competition through institutional maneuvers may reduce the need to take risks on election day that voters can easily pin on the regime.Footnote 3 This tactical shift gives the impression of cleaner elections without costing the regime. In the next section, I highlight a prominent type of electoral manipulation cloaked in institutional formalism that will be analyzed throughout the article: preventing certain politicians from registering their candidacies.
Candidate Filtering
Of the institutional manipulations listed above, the selective registration of candidates – that is, candidate filtering – is among the most widespread, as well as the most controversial. Governments around the world regularly take steps to impose regulations and manage access to election ballots. For instance, candidates may need to collect signatures from eligible voters, submit financial deposits, court existing parliamentarians, and/or fill out extensive documentation, such as asset disclosure forms and proof of residence.
Some ballot access regulations are normal, justified and essential for healthy democracy. Many people approach running for office less than seriously, submitting improper paperwork or failing to abide by legal requirements. Erecting artificial but reasonable barriers to electoral entry can help reduce voter confusion, attract more experienced candidates and reduce the number of wasted votes.
However, candidate filtering becomes detrimental to electoral integrity when it is used to disqualify the regime's political opponents from running for office. Although the explicit reasons given for refusing to register such candidates may be technical (such as insufficient signatures or incorrect forms), unwanted challengers are disproportionately targeted to keep them off the ballot. Opposition activists around the world frequently cry foul about registration procedures being applied unfairly by government officials to prevent them from winning elections. Suspicions of filtering being used to marginalize oppositionists have arisen in Bahrain, Congo and Venezuela (El Yaakoubi Reference El Yaakoubi2018; Brocchetto Reference Brocchetto2017, Reference Brocchetto2018). Indeed, the use (and potential abuses) of candidate filtering may be familiar to many observers of Russian electoral politics. A particularly illuminating study by Bækken (Reference Bækken2015) drew on interviews with local analysts and politicians to claim that vocal, critical and serious challengers often find themselves on the wrong side of registration rulings. Other work has analyzed rejections at the regional level, finding stark differences in successful registration rates between candidates from different parties (Ross Reference Ross2018).
These anecdotes suggest incumbents use candidate filtering to manipulate elections. But because there are also justifiable reasons for selectively blocking certain candidates, it can often be hard to decipher whether and when a regime is acting appropriately vs. when it is abusing its power to systematically punish viable challengers. Although suspicions abound, we still lack definitive evidence that selective registration is used to repress challengers to incumbents. For example, in Russia, Bækken (Reference Bækken2015, 68) writes that ‘the practice has not been openly restrictive against any particular candidates’.
This ambiguity perfectly illustrates why this method of manipulating elections is so attractive to incumbent regimes and motivates this article's central arguments about institutional manipulations. The fact that opposition candidates are rejected more often can be construed as a matter of relative resource capacity rather than actual violations of electoral law by incumbents. After all, pro-regime candidates enjoy substantial organizational advantages in collecting signatures and correctly filling out registration forms. In Russia, ‘signatures are money’, and the ruling party United Russia can draw on vast legal and mobilization teams to ensure that all of its candidates appear on the ballot (Bækken Reference Bækken2015, 66). Candidates from outside the ruling party may struggle to attract the necessary funds and personnel to collect signatures. By constantly changing the signature requirements, electoral commissions can place additional obstacles to registration, while staying well within the confines of the law (Lyubarev Reference Lyubarev2011).
Even when the commissions' decisions border on the absurd (such as nitpicking signatures or requesting ridiculous documents), the legal veneer surrounding registration makes this manipulation much less risky than committing overt electoral fraud (Birch Reference Birch2011; Ross Reference Ross2018). Incumbents can hide behind the stringent laws they themselves passed, arguing all along that the playing field was still wide open and that many challengers were still able to register. Election officials can claim they were only following the rules as passed by elected legislatures. Many voters may never learn that some candidates were not allowed to run, and even if they did, they would be hard pressed to accurately attribute responsibility for the rejections.
Experimentally Measuring the Costs of Electoral Manipulations
Hypothesis 1 predicts that incumbents face lower societal and legal costs for manipulating institutions, such as regulating ballot access, than they do for other more visible types of fraud. These costs can come in two forms: (1) popular disapproval and anger, potentially leading to protests and voter abstention and (2) legal consequences for the perpetrators of the fraud. I test this claim using survey evidence about how citizens evaluate different types of electoral manipulations. One approach would be to directly ask voters to rank the relative acceptability of various electoral activities. Although informative, in many countries voters feel pressure to disapprove of all types of electoral malpractices. Past surveys have shown that the vast majority of voters come out strongly against all types of electoral manipulation (Reuter and Szakonyi Reference Reuter and Szakonyi2021).
Instead, I adopt an experimental approach that elicits how respondents react to learning that different types of electoral manipulations occurred during a hypothetical election campaign. Russia offers a particularly compelling case for studying differential reactions to electoral malpractice. Elections there over the last decade have been far from free and fair. The Russian government has adopted a wide variety of tactics including institutional manipulations (such as preventing opposition candidates and parties from registering), clientelistic mobilization (pressuring workers and students to vote for the regime) and ballot rigging (stuffing ballot boxes, etc.). Not only are citizens generally aware of these tactics, but the public can still express its disapproval of electoral deficiencies, for instance through social media or protests.Footnote 4 As the 2011–12 wave of protests demonstrated, the regime cannot simply commit fraud in complete disregard of popular opinion. Monitors and analysts carefully track, for example, how votes are counted.
The first survey experiment asks respondents to imagine that mayoral elections in their municipality were to be held later that year. Participants were randomly assigned to a control or one of three treatment groups describing the run-up to the hypothetical election. Each treatment group received extra information about how the election was conducted: (1) an independent candidate (that is, someone not running with a party affiliation) was refused registration, (2) local governments organized voting carousels (that is, they helped citizens vote multiple times) or (3) public sector employees were pressured to vote. Table 1 gives the full question wording.
Experiment wording and treatment assignment

The first treatment describes a common institutional manipulation, and the treatment does not mention that the refusal to register an independent candidate was illegal. This ambiguity over procedural quality is intentional. Rarely are there clear-cut cases of sham rejections, mainly because incumbents prevent voters from finding out how procedural decisions were made. The rejection of opposition candidates during the 2019 Moscow City Duma elections are a good example. The official reason given was fake signatures, and state-controlled media showed interviews and pictures testifying to problems in rejected candidates' petitions. Although independent media and the rejected candidates raised objections, a regular citizen in Moscow would be faced with competing sources of information and would have to come to her own conclusions about the legality of the process. This treatment is designed to succinctly elicit the same uncertainty.
Because the specific actor is not referenced in this rejection decision, respondents could overlook the possibility that the rejection was made for incumbents' benefit. This second source of ambiguity about the actors responsible again maps closer to the reality of the registration process,Footnote 5 but could affect the interpretation of the experimental results. To address this concern, in the next section I discuss a second survey experiment that removes the two sources of ambiguity by including a treatment in which a leading opposition candidate is refused registration (implying the incumbent would benefit, mostly likely unfairly). To preview, this wording change does not alter the rank ordering of electoral manipulations. Excluding candidates in any manner creates ambiguity for voters, regardless of whether the individuals targeted present serious challengers to incumbents.
The first treatment also intentionally references independent candidates. Independents in Russia present significant problems for incumbents, making them attractive targets for refusing registration. Disavowing party affiliation is often a sign of strength, rather than weakness: independents can draw on their own financial resources (particularly time spent in the private sector) to fund their campaigns and personal popularity to win over voters. This enables them to make a stronger argument to the public about their distance from incumbents. In many cases they offer a more credible alternative to voters seeking a change in leadership – one that is not subordinate to national parties.
The second treatment (‘karousels’) captures blatant, illegal electoral fraud. Respondents would be familiar with the practice from media coverage. The third treatment describes voter mobilization in the workplace. This type of clientelism is common during elections to all levels of government (Frye, Reuter and Szakonyi Reference Frye, Reuter and Szakonyi2019b), and voters are generally aware of how the practice occurs.
One potential concern with this type of vignette experiment is that including any description of how an electoral campaign was conducted could shape responses. To account for this possibility, I included a control group in which respondents were given an ostensibly innocuous treatment: that the Central Election Commission would increase the number of electoral precincts. Changing this number is a legal administrative action that happens regularly during election cycles as new population censuses are released. Although smaller precincts may help parties monitor broker effort and thus lead to more vote buying (Rueda Reference Rueda2017), voters for the most part will be unaware of such statistical patterns and not associate precinct size with electoral manipulation.
Respondents were then asked about (1) their emotional reaction to the information about flaws in the electoral process, as measured on a five-point scale with higher values indicating more anger and (2) their behavioral reaction, as measured by their likelihood of participating in a collective action to raise awareness about threats to electoral integrity, such as signing a petition or joining a protest. The ‘emotional’ outcome draws on recent work on American politics arguing that voter fraud can provoke anger and lead to mobilization by certain groups of voters (Valentino and Neuner Reference Valentino and Neuner2017). Respondents were directly asked to express their level of disapproval, if any, of the way these hypothetical elections were conducted. The ‘behavioral’ outcome captures whether respondents were willing to translate that anger and/or frustration into some form of collective action.Footnote 6
The aim is to capture whether incumbents face any public costs from using different types of electoral manipulations. Respondents were assigned to one treatment arm; the two outcome questions were then asked in immediate succession. As an extension, I discuss below a second, similar experiment asking voters about their willingness to vote in a hypothetical election after different types of manipulations had been committed.
The experiment was placed on an omnibus survey conducted by Levada Market Research from 24–29 May 2019 that queried a representative sample of 1,616 Russian adults from fifty-one regions. Appendix Section D presents the Russian version and information on survey design, as well as results from two-sample difference-in-means and Kolmogorov-Smirnov tests that demonstrate the randomization was correctly done. As an additional check, I show regression results below that include confounders in the analysis.
Experimental Results
Figure 1 displays the experimental results. The columns in Panel A depict the mean level of anger (the ‘emotional’ outcome) that respondents expressed in each treatment group; the y-axis gives the five-point scale. Panel B shows the means for the ‘behavioral’ outcome regarding the willingness to join a collective protest, also broken down by treatment group. Although both questions are measured on five-point scales, we should be careful not to directly compare treatment sizes: a one-unit change in one's level of anger may not be the same as a one-unit change in one's willingness to protest.
Survey experimental evidence – plots
Note: Panel A shows the mean level of anger over electoral integrity per control or treatment group (1 = Not at all Angry; 5 = Very Angry). Those who saw the elections as free and fair were coded 0. Panel B shows the mean likelihood of participating in a collective action in protest over electoral integrity (1 = Not Likely to Participate; 5 = Very Likely to Participate).

Panel A shows that all three examples of electoral manipulations elicit greater anger over the quality of the hypothetical elections than the control group. The differences are large and statistically significant. Respondents react most negatively to Workplace Mobilization, which figures an entire point higher on the five-point scale than the Election Commissions control group. Importantly, Candidate Filtering ranks in between. Although respondents express some anger over an independent candidate being refused registration, the level is much lower than the two overt forms of fraud (Carousels and Workplace Mobilization). As hypothesized, this type of institutional manipulation resonates less strongly with Russian citizens.
Panel B looks at how that anger potentially translates into protest activity. It shows a similar pattern to the results on anger, except the differences between the treatments are more noisily estimated. The difference between the outcome in Treatment #1 is statistically different (at the 95 per cent level) from that in Treatment #3: voters who were informed that an independent candidate had been refused registration were less likely to express an interest in protesting that manipulation than those who were told workers had been pressured to vote by their bosses. Interestingly, respondents informed about candidate filtering are not more likely to protest than those told about an increase in the number of precincts. This null finding indicates that candidate filtering does not anger or agitate people enough to take specific collective action, whereas other forms of electoral manipulation appear to have a stronger effect.
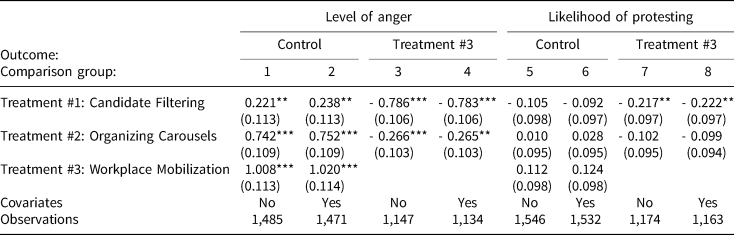
Table 2 reports regression results that statistically confirm the differences shown in Figure 1. Columns 1–4 analyze the emotional outcome, while Columns 5–9 assess the behavioral outcome. The models vary the comparison group: the first two columns in each group compare the three treatments to the control group, while the second two look at differences between the treatments themselves. The even-numbered columns include a standard battery of demographic controls (gender, age, education, economic status, past turnout, town size and employment status).
Survey experimental evidence – regression results

Note: the outcome variable in Columns 1–4 is the level of anger over electoral integrity, while that in Columns 5–8 is the likelihood of participating in a collective action in protest. Column headers denote whether the comparison group is the ‘Control’ (Election Commissions) or ‘Treatment #3’ (Workplace Mobilization). Models use OLS and vary the inclusion of covariates. ***p < 0.01, **p < 0.05, *p < 0.1
The results show that candidate filtering elicits the least negative emotional reaction.Footnote 7 The differences between the treatments are statistically significant at conventional levels (Columns 1–4). In terms of willingness to protest, only the difference between the Candidate Filtering and Workplace Mobilization treatments is large and precisely estimated (Columns 7–8). Respondents assigned to the Candidate Filtering treatment react no differently than those from the control group or those informed about carousels being used. Candidate filtering is less likely to motivate respondents to join a collective action.
Although respondents did not express great interest in joining collective actions, electoral fraud can still generate other changes in political behavior. Voters who do not approve of electoral manipulation can express their dissatisfaction with fraudulent elections by staying away from the polls (Simpser Reference Simpser2012). To test differential effects on voter turnout, I conducted another survey experiment through Levada Market Research from 23–27 March 2018 on a representative sample of 1,612 Russian adults.
The experiment hems very closely to that described in Table 1, but with two key changes that help unpack the mechanism behind the differential responses to electoral manipulations. First, as before, respondents were allocated into control and three treatment groups: Candidate Filtering, Workplace Mobilization and Carousels. But this time, the person being refused registration is described as the ‘main opposition candidate’. This wording explicitly raises the possibility that the selective registration strategy is being used to restrict ballot access for a credible challenger to the regime, rather than the Electoral Commission simply doing its job removing non-serious candidates. Even though the ‘municipal administration’ is not expressly included as the actor responsible for rejecting the candidate, respondents could easily assume that because the candidate was from the opposition, incumbent authorities gained electoral advantages from excluding him or her. The second key change is that the hypothetical election takes place at the national level, allowing us to partially unpack whether respondents view filtering in higher-stakes elections differently. Appendix Section E contains the null question wording and results.
This second experiment confirms that candidate filtering produces less negative reactions among the Russian voting public. Respondents were more likely to vote in elections in which a candidate was refused registration (compared to the control group of elections with an increased number of precincts) than in elections that featured more blatant falsification and ballot rigging tactics. Interestingly, the fact that the rejected candidate was an open and credible challenger to the regime did not change respondents’ voting calculus. Respondents reacted to ambiguity over the way ballot access was managed, rather than the precise wording of the treatments used to describe who the registration refusal targeted. Taken together, the two experiments suggest that voters respond differently to various types of electoral malpractice, and that incumbents face lower societal costs when they intervene earlier in the electoral process to tilt the playing field.Footnote 8
Qualitative Evidence about Societal and Legal Costs
Several high-profile cases in Russia illustrate the challenges of mobilizing popular anger around candidate filtering. Candidates have little recourse to contest rejections, and protests and legal challenges rarely achieve a reversal of the decision, much less punish electoral commissions. Russia has experienced its share of large-scale protests in response to overt electoral fraud, but because registration rejections happen long before election day and without accompanying viral videos, they fail to offer such a visible trigger event to push demonstrators onto the streets.
Take the example of Alexey Navalny, Russia's most prominent oppositionist who built a grassroots campaign to challenge Vladimir Putin in the 2018 presidential elections. The Central Election Commission rejected Navalny's registration even though he had the required 15,000 signatures and 500 endorsements. Five years earlier, he had been convicted of what is widely believed to be a fabricated case of financial fraud, which prevented him from standing for office. After his rejection, Navalny struggled to mobilize nationwide protests to place pressure on the government to reverse its decision. In the end, Putin coasted easily to re-election and no election officials faced any repercussions for disqualifying Navalny's candidacy.Footnote 9
A similar situation unfolded during the 2012 Arkhangelsk mayoral election. Four years prior, popular independent candidate Larisa Bazanova narrowly lost a disputed recount during a race for the same office. In her next bid in 2012, the local election commission rejected her candidacy for having too many invalid signatures (Molchano Reference Molchano2013). Although some expected her to mount protests to challenge the decision (Exo Severa 2012), she ultimately decided to appeal to the district court. Of the four candidates whose candidacies were rejected, only Bazanova filed suit, but in the end, her candidacy was rejected again.
Finally, controversy erupted in summer 2019 over the rejection of nineteen opposition candidates to the Moscow City Duma because of signature irregularities allegedly found on their registration forms. Thousands of protesters took to the streets, demanding the election commission reverse its ruling and admit the candidates. At first glance, these events perhaps run counter to the survey results: Muscovites risked prison terms to protest.
But two important caveats are in order. First, many of the protestors' slogans went far beyond candidate rejections. News coverage highlighted protestors' anger over economic issues, restriction of political freedoms and especially police brutality during the suppression of unsanctioned demonstrations. Violent videos and images of riot police arresting thousands did more to generate widespread anger than discontent over the application of electoral law. Candidate registrations may have sparked the move to the streets, but the tinder was dry. Representative polls also found minority support among Muscovites supporting protestors' calls to reverse the rejections; the majority was either against or indifferent to the protests (RBK 2019). Secondly, incumbent authorities refused to make concessions; several of the rejected candidates appealed, but their cases were denied.
This outcome is tragically common. Using data on disputes over candidate registrations in Russia, Popova (Reference Popova2012) finds little evidence that the legal system protected candidates against incumbents using electoral commissions to constrain the competition. Bækken (Reference Bækken2015) also cites interviews decrying the courts' independence and the chances of rejected candidates overturning the decisions of electoral commissions. There are few, if any, instances of commissions facing criminal punishment for their decisions to reject candidates.
Cross-nationally, high-profile registration refusals handed down to national opposition figures rarely spark widespread outrage. In Iraq, the disqualification of hundreds of candidates led a key Sunni political party to protest by boycotting the 2010 general elections; however, the party changed course and ultimately participated after realizing the ineffectiveness of the protest action (Frankel Reference Frankel2010). Officials in Azerbaijan, Ghana and Cameroon have all used registration refusals to stem opposition ambitions without paying high political costs (LaPorte Reference LaPorte2015; BBC 2012). Some governments do back down and reinstate opposition candidates after initially refusing them, but only after threats of mounting violence in the streets force them to change course (Harish and Toha Reference Harish and Toha2019).
Competitiveness and Electoral Manipulations
Candidate filtering can be a uniquely effective electoral manipulation that insulates incumbents from popular and legal exposure if it is discovered. Hypothesis 2 argues that these traits enable incumbents to strategically deploy filtering to win close, competitive elections. To test this prediction, I collected data from the Russian Central Electoral Commission (CEC) on 106,236 mayoral candidates from 13,616 municipalities in eighty-four Russian regions over 2005–2019. Russian mayors are powerful local politicians with the authority to set budget allocations and policy priorities. Municipal spending accounts for 7 per cent of Russian GDP (Szakonyi Reference Szakonyi2021). Mayors are far from the most prestigious position within the Russian government, but thousands of candidates contest these races because of the real influence the position entails.Footnote 10
To register, mayoral candidates submit some combination of an official statement; documents confirming their citizenship, education, wealth, employment history and party membership; information on campaign finances; and a list of signatures from local citizens supporting their candidacy. These rules vary across regions. Regional governments set their own rules for gubernatorial, mayoral and local elections. Thresholds vary for the total number of signatures needed, the number of incorrect signatures allowed and size of candidate deposits, among other requirements (Lyubarev Reference Lyubarev2011).
To measure whether or not an election commission rejected a municipal candidate, I code a binary indicator for each candidacy based on a field in the data that denotes registration status.Footnote 11 Bækken (Reference Bækken2015) provides anecdotal evidence of the official reasons often given in Russia, noting that most violations appear to fall in one of three categories: signatures found invalid, registration incorrectly filled out or violations of electoral law occurring during the campaign.Footnote 12 As acknowledged above, some of these rejections are completely legitimate and used to prevent non-serious candidates from running. One of this article's central empirical aims is to investigate whether rejections in Russia are systematically being used to repress opposition candidates, and if so, the conditions under which this strategy is deployed.
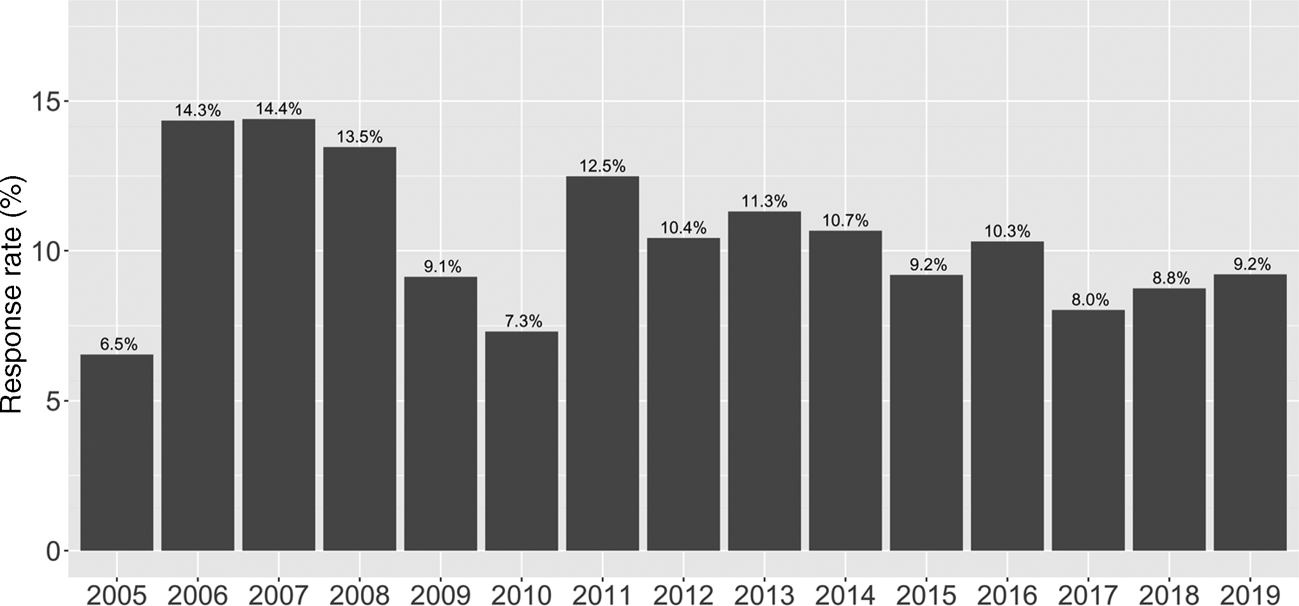
Over the period 2005–2019, election commissions rejected 10 per cent of all candidates. Figure 2 illustrates that rejections spiked in 2006–2007 before gradually trending downwards by 2010. Instructively, this was a time of party consolidation when the ruling-party regime faced few threats to its moves to consolidate power. However, the rate spiked upwards in 2011 just as popular protests swelled, new faces helped resurrect the non-systemic opposition and ruling-party candidates experienced intense political competition on numerous flanks. These over-time dynamics suggest that rejections correlate with broader national political dynamics.
Rejection rate over time
Note: this figure shows the percentage of candidates that were rejected in municipal elections each year from 2005–2019.

To determine whether candidate registration procedures were being used to block opponents from challenging the regime, I first coded whether candidates were members of one of the four main political parties – United Russia (UR, the ruling party), the Communist Party, Liberal Democratic Party of Russia (LDPR), or Just Russia (the systemic opposition) – or whether they ran as an independent without political affiliation or as a member of a smaller political grouping (the residual category). The Russian government has invested considerable resources in developing the ruling party UR, and in co-opting and shaping the development of systemic opposition parties (Reuter and Robertson Reference Reuter and Robertson2015; Reuter and Szakonyi Reference Reuter and Szakonyi2019). Political parties that win seats in the federal State Duma have to collect fewer signatures to register in lower-level elections. These efforts allow the regime to better manage potential challengers and channel their antagonism to the regime within officially sanctioned political organizations that can be bought off or cajoled.
As described above, independents are among the most serious, viable challengers to the ruling party due to their financial resources, education and political experience. Appendix Section B8 compares the viability of candidates with different political affiliations. For those who are allowed to run, independents win greater vote shares and elections at much higher rates than candidates from opposition parties. The threat they constitute may drive the regime to selectively target them during the registration process.
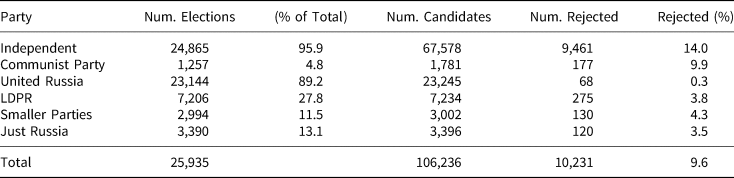
Breaking down rejections by party illuminates these dynamics. Table 3 first shows the number of mayoral candidates running for office across Russia from each of the four national political parties, smaller parties (aggregated) or running as independents. It shows that UR fields candidates in 89 per cent of mayoral elections countrywide, beat out only by independent candidates, who contest 96 per cent of all elections. The other opposition parties, systemic or otherwise, participate at much lower rates. Political parties can field only one candidate per race, while there can be multiple independents in an election.
Rejected candidates, by party

Note: this table shows participation in mayoral elections broken down by party (rows) and registration status. Columns 1 and 2 denote the number (and percentage of total) elections in which a candidate from that party participated. The right-hand columns show the number of candidates that attempted to register and the number (and percentage) that were rejected by election commissions.
More interesting is the rate of rejection, which is much higher for independents. More than one in eight independent mayoral candidates have their registrations refused by election commissions, compared to 0.03 per cent for UR candidates. Only sixty-eight of the over 23,000 UR candidates were rejected during the study period. This difference is staggering. Independents outnumber UR candidates by roughly 3 to 1, but their rejection rate is 465 to 1. Systemic opposition parties experience far fewer rejections. These numbers suggest large, politically motivated discrepancies in the way candidates achieve ballot access.Footnote 13
To test whether rejections are used strategically during competitive elections, I first focus on elections in which the regime feels particularly vulnerable to strong challengers. One measure is whether the sitting incumbent runs for re-election. Open contests without incumbent participation create a more level playing field and may attract stronger candidates. Regimes then go to extra lengths to help their replacement candidate and restrict ballot access for opposition figures. I capture this electoral vulnerability by coding a binary indicator for each mayoral candidacy if the sitting incumbent did not participate in that election, that is, there was no incumbency advantage at work. The variable Open Seat takes a value of 1 if the incumbent did not run for re-election, and 0 otherwise. The absence of an incumbent running could open up the playing field for newcomers and increase the probability that a challenger could win office.Footnote 14
Next, governments may be concerned about viable challengers who can attract greater public support and run stronger campaigns. To determine whether this is the case, I first code the highest level of education that each candidate received. More educated candidates pose a greater threat to the regime, due to their higher competency and organizational ability (Besley, Montalvo and Reynal-Querol Reference Besley, Montalvo and Reynal-Querol2011). Since secondary education is very widespread in Russia (98 per cent of all candidates have finished high school), I code a binary indicator for whether a candidate has a college degree; roughly two-thirds of candidates have this level of education. Surveys suggest that Russian voters rank education near the top in terms of desirable characteristics in their political leaders; more educated candidates may enjoy electoral advantages in convincing voters they will make more competent leaders.Footnote 15
Next, I use information on previous place of work to code whether candidates had private sector experience before running for office. Careers in business offer financial resources and economic autonomy to challenge the regime (Reuter and Szakonyi Reference Reuter and Szakonyi2019). An incumbent government might fear well-heeled challengers who can afford the substantial campaign costs and attract wider support given their outsider status. This coding of businesspeople uses keywords to capture firm directors, individual entrepreneurs and top-level managers who work in private, not state-owned, firms (Szakonyi Reference Szakonyi2020a). Finally, I use data on all municipal, regional and federal elections to identify whether mayoral candidates had ever previously won election to a different government position. I match individual candidates to previous elections using their full name, birth year and region. For each candidate, I create a count of the elections they previously won, as well as the office pursued. In all, the three measures capture the campaign advantages enjoyed by certain candidates.
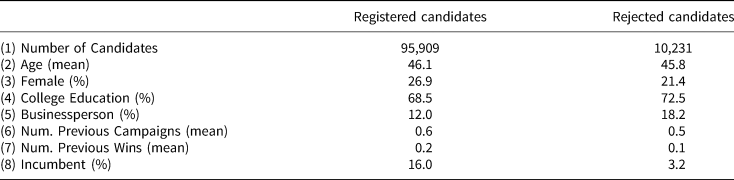
Though detailed polls and actual popularity measures are not available, on average, candidates with governing experience and more money to spend tend to attract more followers. The data on electoral experience can also be used to test the alternate hypothesis that rejections are being correctly handed down to individuals who are not complying with electoral law. For example, some candidates may not have the resources to collect correct signatures or a proper understanding of electoral law. I count the number of past successful campaigns each candidate had conducted previously to differentiate between serious and non-serious candidates. Table 4 shows descriptive statistics comparing registered vs. rejected candidates, which I next explore in more detail using regressions.
Candidate descriptive statistics

Note: this table gives basic descriptive statistics about the individual candidates who either successfully registered (left column) or were rejected by the election commission (right column).
Empirical Results
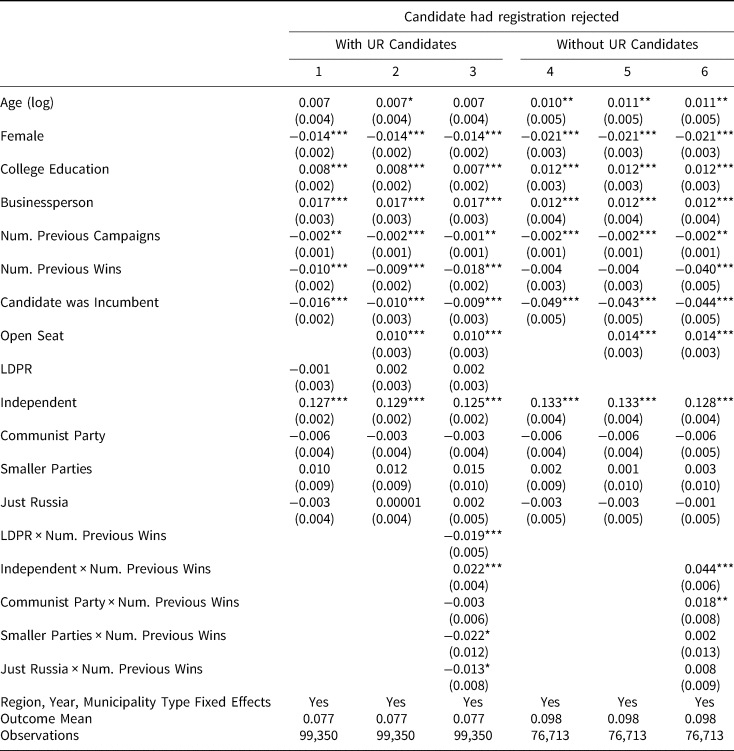
Hypothesis 2 holds that rejections will be more likely when the incumbent government senses electoral vulnerability or the presence of credible challengers. To test this prediction, I show a series of regressions in which the outcome variable is a binary indicator for whether the election commission rejects a candidacy during the registration process. The unit of analysis is the individual candidacy.Footnote 16 To ease explication, I employ linear probability models; the results are robust to using logit models in Appendix Table B7.
Institutional features strongly suggest the need for a fixed effect approach to capture variation across regions, years and municipality types. Regions differ over whether they use elections to select municipal chief executives and the specific procedures required to run for office. Russia also experienced political and economic shocks nationwide (financial crisis, popular protests, etc.) that could affect local commissions’ willingness and capacity to block candidacies. Finally, Russian municipalities fall into four subcategories based on population size: municipal rayons and city okrugs (upper tier) and rural and urban settlements (lower tier). Standard errors are clustered on the election level.
Table 5 shows two sets of regressions. In Columns 1–3, the full sample of candidacies is used. The reference category for the party membership variable is affiliation with UR. In Columns 4–6, I restrict the analysis to only opposition and independent (non-regime) candidates. Since UR retained majority control of subnational governments and electoral commissions across Russia during the study period, we are potentially most interested in understanding how this regime decides which candidates should be prevented from accessing the ballot and contesting its hold on power. Analyzing just this pool of challengers, do candidate viability and electoral vulnerability still predict registration refusals? For these models, the party reference category is LDPR, a systemic opposition party that occupies a median position with regards to ideology and viability.
Candidate rejections

Note: the outcome variable is a binary indicator for whether a candidate was rejected by an election commission. Columns 1–3 include the entire sample of candidates that attempted to register and run for mayor in their municipality. Columns 4–6 exclude all UR candidates. All models include region, year and municipality type fixed effects and cluster standard errors on election. ***p < 0.01, **p < 0.05, *p < 0.1
The regressions yield three interesting findings. First, rejections are more likely to occur when an incumbent declines to seek re-election. This ‘open seat’ signals a more competitive playing field in which the incumbent government's advantages are diminished. Institutional manipulations such as candidate filtering help the regime ensure that replacement candidates can protect its hold on power. Robustness checks in Appendix Table B6 confirm that elections with weaker incumbents, as measured by vote share in the previous election, are more likely to have candidates repressed.
Secondly, more viable candidates experience more registration rejections. Those who have a college degree (signaling competence), worked in an upper-level management position in the private sector (signaling financial resources) or declined party affiliation (signaling autonomy) are all more likely to be rejected. These point estimates are all statistically significant and substantively large. For example, businesspeople experience a 24 per cent higher rate of rejection relative to the benchmark mean. Independent candidates are rejected more than twice as often.Footnote 17
Finally, the effect of having served in elected office prior to running for mayor is particularly important. Incumbent candidates are far less likely to be rejected. This is intuitive: these politicians have direct influence over the composition and behavior of electoral commissions, and can ensure that their applications sail through. But rejection rates increase dramatically for independent candidates who have won elections previously at the municipal or regional level (see Appendix Table B4 for an analysis of different political records). The interactions in Columns 3 and 6 between being an independent and having won office before are both statistically significant and large in magnitude. Each additional previous win increases the probability of rejection among independents by roughly 20 per cent (4 percentage points). Regimes go to considerable lengths to prevent independent candidates from running who have demonstrated records of successful political campaigns and governing experience.
Yet systemic opposition candidates who have won elections before are not more likely to be disqualified. One explanation is that the regime can rely on other methods to co-opt members of the systemic opposition, defanging the threat they could pose to the regime. The ruling party in Russia needs opponents to ensure the legitimacy of its electoral victories. Voters may refuse to turn out if they do not see even superficial alternatives to the regime. Smyth and Turovsky (Reference Smyth and Turovsky2018, 196) argue that systemic opposition parties ‘create the illusion of authentic representation of different political interests and procedural fairness’. Independent candidates are not bound to party structures and may be more likely to rebuff the regime's attempts to dictate their political role.
In the Appendix, I show modeling approaches that vary both regressors and samples. First, Appendix Section B1 shows that the results are robust to including a count of past rejections, some of which are due to real legal reasons and thus capture candidate seriousness. The effects on independents and previous experience are not being driven by incompetent candidates who constantly file low-quality registration attempts. It strains reason that strong, well-funded and politically experienced candidates experience difficulty with electoral forms on a systematic basis across regions and years. Next, restricting the analysis to only independents shows that the main measures of candidate viability and regime vulnerability still predict rejections (Appendix Section B8). The results are also robust to including municipality covariates (Appendix Section B3). Overall, there is strong evidence that Russian officials abuse the registration process to filter out threatening candidates, particularly when their chances of losing power are the greatest.
Finally, I examine whether candidate filtering affects how elections are decided. Election-level regressions in Appendix Section C examine three outcome variables: turnout, UR candidate victory and UR candidate's vote share. The main predictor is a count of rejected independents who had won office previously. The additional focus on more credible challengers running in competitive elections is intended to capture manipulations designed specifically to improve the ruling party's electoral chances. For each election, I also include a count of the total number of (rejected and accepted) independent candidates to control for the pool of potential such candidates that could have been rejected.Footnote 18 All models include controls for municipality size, total number of candidates, number of precincts in the election, the standard deviation in precinct population size within each election, and region, year and municipality type fixed effects.
Rejecting strong candidates helps the ruling party win elections. When such credible candidates are rejected, ruling-party candidates earn larger vote shares and are more likely to win election. However, turnout drops, potentially an indicator that voters stay home because the elections results are pre-ordained. Taken together, these results suggest institutional manipulations are a way for incumbents to maintain real electoral advantages. Filtering out strong candidacies gives voters less choice, and although some respond by abstaining, those costs are not significant enough to jeopardize incumbents' hold on power.
Conclusion
This article demonstrates that certain types of electoral malpractice are more appealing to incumbents than others. Voters react less negatively to candidate filtering than they do to fraud, and there is little evidence that incumbents later face a high legal price. This lack of constraints partly frees incumbents to strategically use filtering during races if they sense electoral vulnerability or are challenged by well-resourced, experienced rivals. Even when elections are competitive and political outcomes uncertain, incumbents need not shy away from committing electoral malpractice, particularly if it involves manipulating institutions. Much of this damage can be inflicted long before election day, which then handicaps rivals' ability to mobilize supporters around a verifiable electoral injustice. Filtering thus allows regimes to pre-empt the emergence of strong foes by preventing them from winning lower-level elections and building upwards momentum.Footnote 19
If the costs are relatively low, why don't incumbents rely exclusively on hard-to-detect strategies, such as candidate filtering, to tip elections in their favor? Ordering only one item off the menu of manipulation may have its own drawbacks. For instance, many citizens, even in autocracies, come to expect at least some degree of competitiveness during elections and a superficial commitment to democratic principles (Letsa and Wilfahrt Reference Letsa and Wilfahrt2018; Norris Reference Norris1999). Filtering out all unwanted candidates severely constrains voters' choices and produces blowback if elections are too stage managed. The analysis suggests turnout falls when competition is restricted. Regimes may be concerned that tampering too much will delegitimize elections to the point that no one participates. Expanding the definition of electoral malpractice to comprise less detectable forms of manipulation opens up new questions about how incumbents can rig elections and prevent alternation in power without paying high political costs (Reuter and Szakonyi Reference Reuter and Szakonyi2021).
Further analysis at the cross-national level should investigate whether the same patterns hold for competitive national elections. Russia is just one of many non-democracies where political pressure is regularly exerted on election management bodies (Norris and Nai Reference Norris and Nai2017). Candidate filtering should be especially prominent in countries where judicial independence is under threat, since regimes can more easily rely on the co-opted courts to enforce these biased registration decisions. Over the last 20 years, Russian authoritarianism has been greatly consolidated: the UR party has asserted a dominant grip on political institutions, some international electoral monitors have been curbed, and though the 2011–2012 election cycle sparked nationwide protests, other problematic contests did not generate such outrage. By decreasing the opportunities citizens have to publicly express their discontent over electoral fraud, rising authoritarianism changes the incentives for incumbents to manipulate elections.
When the lens is shifted to subnational politics, Russia shares more similarities with other competitive authoritarian countries, which increases the generalizability of the current findings. Russian voters are more able to choose mayoral alternatives to UR; independent, non-regime-affiliated candidates won 28 per cent of elections at this level of government. The ruling party cannot indiscriminately co-opt the electoral process because it can be voted out. In addition, international election monitors are less active during subnational elections in countries around the world, which makes Russia less of an outlier in having sidelined them during national contests. Instead, the main constraints on engaging in subnational electoral fraud are domestic: public opinion, opposition parties, local monitors and judicial bodies. Social media has improved the coverage of electoral malfeasance (Reuter and Szakonyi Reference Reuter and Szakonyi2015), while political protests in Russia's regions occur with some regularity (Lankina and Voznaya Reference Lankina and Voznaya2015). Perhaps because of these similarities, the use of candidate filtering at the mayoral level in Russia occurs at a similar rate to national elections worldwide.Footnote 20
One scope condition bounding the subnational analysis's relevance for national contests relates to the salience and polarization surrounding the electoral contest. The survey experiments show that citizens do express anger over candidate filtering; the intensity of this disapproval simply lags that elicited by other strategies. Incumbents who consistently abuse registration procedures risk citizens updating and learning that institutions are transparently crooked. The more well-known and oppositionist a challenger is, the more difficult it will be for incumbents to sideline him or her and prevent the mobilization of a principled, angry movement calling for greater electoral integrity. It therefore should be kept in mind that this article analyzes candidate filtering at the city level. Smaller-stakes elections not only feature lower-profile politicians; they can sometimes result in local power struggles rather than open ideological conflict and calls to oust regimes. We should expect candidate filtering to cause even less outrage in society when the rivals targeted are ideologically aligned with the government overseeing the registration process.
Because citizens might not be aware of the abuses of power occurring during the electoral process, strengthening independent media would help raise awareness that the facade of institutional integrity is being undermined. In some countries, there may be a disconnect between the general public's understanding of elections and the reality behind the scenes. Newer forms of authoritarianism rely on controlling information rather than outright violent repression (Treisman Reference Treisman2018). Candidate filtering may be akin to gerrymandering: a significant body of research and coverage is necessary to expose the problem. Beyond judicial reform and increasing information, professionalizing electoral commissions would place autonomous bureaucrats on registration front lines, and perhaps lead to less politically motivated decisions (Herron, Boyko and Thunberg Reference Herron, Boyko and Thunberg2017; Hyde and Pallister Reference Hyde and Pallister2015).
Supplementary material
Supplementary material for this article can be found at https://doi.org/10.1017/S0007123420000836.
Data availability statement
Replication data for this article can be found in Harvard Dataverse at: https://doi.org/10.7910/DVN/RR6BRU
Acknowledgements
I thank Noah Buckley, Haakon Gjerlow, Marko Klasnja, Andrew Little, Jack Paine, Elizabeth Plantan, audiences at SPSA, EPSA, GWU and CEU, as well as three anonymous reviewers for valuable comments. Chris Jarmas provided excellent research assistance.
Financial support
The article was prepared within the framework of the Basic Research Program at the National Research University Higher School of Economics and supported within the framework of a subsidy by the Russian Academic Excellence Project ‘5–100’.
Conflicts of interest
None.
Ethical standards
The research was conducted in accordance with protocols approved by George Washington University (IRB# NCR191272).