


1 Introduction
Information Technology (IT) has come to occupy an important place in the US economy. Innovation in IT played a central role in driving labor productivity and output growth in the US economy during the 1990s. However, with the exception of the 1990s, the average rate of innovation in IT has decreased over time. Two commonly used measures of the rate of innovation are shown in Figure 1, the decline in quality-adjusted price index for computers and peripherals (Panel a), and the growth in performance of microprocessors used in desktop computers (Panel b). The average growth rate of both these measures has reduced over every decade except the1990s.
Slowdown in rate of innovation in IT : (a) Decline in Quality-Adjusted Prices for Computers and Peripherals. (b) Growth in Performance of leading Intel Microprocessors (CPUs).
Notes: The graphs above show the evolution of two commonly used measures of rate of innovation in IT. Panel (a) shows the price index of private fixed investment in Computer and Peripherals and is taken from the Bureau of Economic Analysis (BEA). Panel (b) shows the performance of leading microprocessors, or CPUS, made by Intel Corporation for use in desktop computers (see Pillai (Reference Pillai2013) for more information on measurement of performance). The decadal average of both these measures of innovation has reduced over each decade, except for 1990–2000.
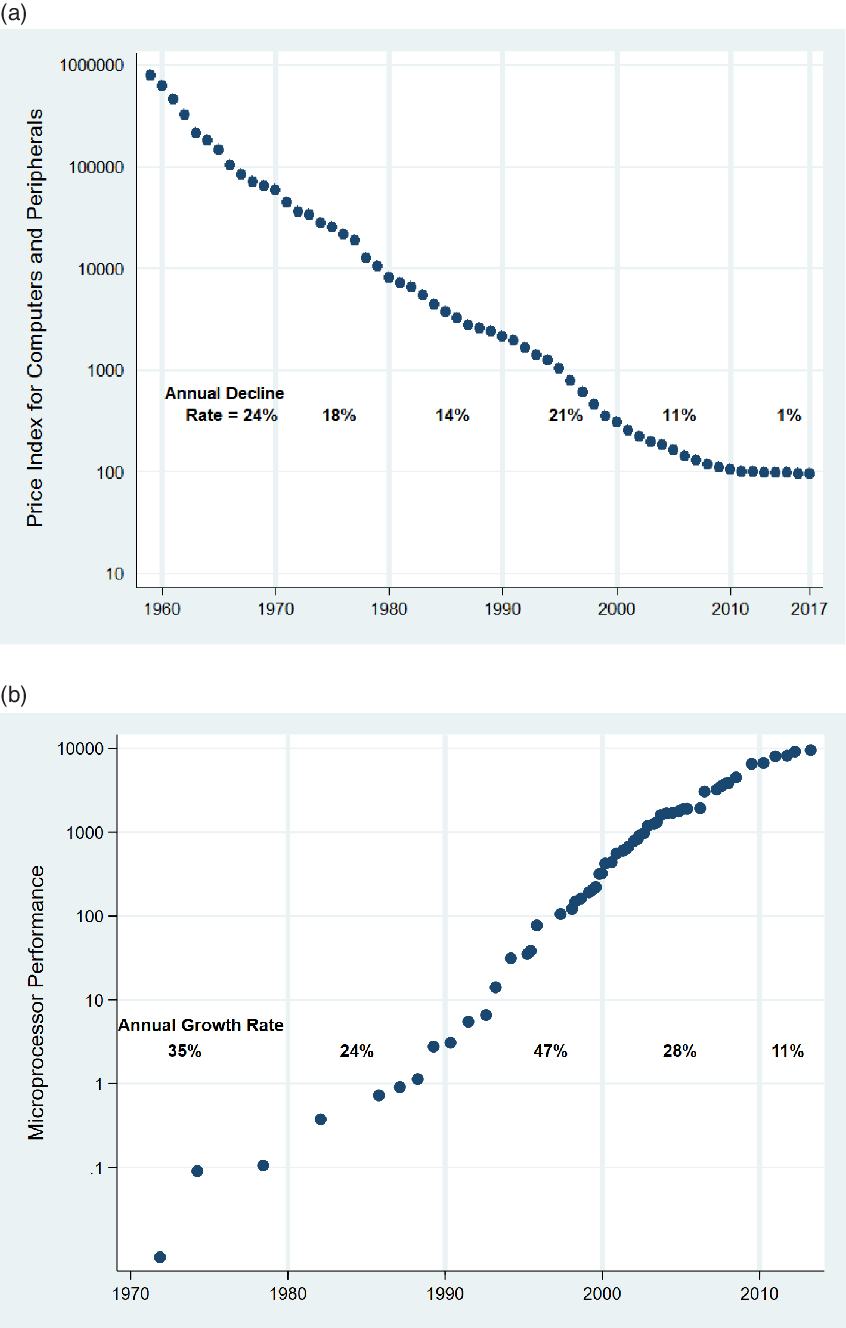
The slowdown in both measures has been sharper since 2000, and this has raised a concern that slowing innovation in IT has been contributing to the slowdown in US labor productivity growth [see Gordon (Reference Gordon2015)]. The concern poses the question of whether slowing down of innovation in IT will necessarily lead to a slowdown in labor productivity and output growth. The model developed in this paper shows that if the IT–labor elasticity of substitution in final goods production is greater than 1, then not only will rate of innovation in IT slow down over time as seen in Figure 1, but also that the falling rate of innovation can result in sustained labor productivity and output growth in firms and sectors that use IT.
Slowing innovation and sustained growth in the model in this paper are both driven by an IT–labor elasticity of substitution that is greater than 1, which in turn is consistent with the observation in Byrne and Corrado (Reference Byrne and Corrado2017) that the share of factor payments to IT inputs in the US GDP has increased over time. Footnote 1 The mechanism that delivers these results is the following. R&D in the IT-producing sector leads to improvements in the quality of IT, and decline in the quality-adjusted price of IT relative to labor. Final goods firms with IT–labor elasticity of substitution greater than 1 respond to the decrease in the relative IT price by increasing the IT share of production cost and reducing the labor share. The rate of increase of IT share, however, has to slow down over time, which in turn reduces the benefit to the IT-producing sector of innovating, resulting in a continuously slowing rate of innovation in IT. The increasing share of IT in final goods production, however, tempers the effect of the slowing innovation on labor productivity and output growth in final goods production. For a particular set of assumptions on the R&D cost of innovation in IT, the effect of the falling rate of innovation in IT and the countervailing effect of increasing IT share exactly balance each other so that labor productivity and output grow at a constant rate. The connection of the particular R&D cost function to the role of IT as an automating technology that can substitute for labor is examined in the paper. Footnote 2
This paper contributes to two strands in the literature. First, the paper contributes to the literature on technological change in IT, and its impact on labor productivity and output growth. The acceleration in quality-adjusted prices of IT inputs in the 1990s, the subsequent slowdown, and its role in changes to US labor productivity and output growth has been clearly documented in Oliner and Sichel (Reference Oliner and Sichel2000), Jorgenson (Reference Jorgenson2001), Aizcorbe (Reference Aizcorbe2006), Fernald (Reference Fernald2014), Byrne et al. (Reference Byrne, Oliner and Sichel2017), Schmalensee (Reference Schmalensee2018), and Gordon and Sayed (Reference Gordon and Sayed2020). Footnote 3 This literature uses growth accounting models to infer, and to predict, the impact of IT on labor productivity and output growth. Models in this literature rely on guesses and extrapolations about the future rate of innovation in the IT sector, the rate of IT price declines, and the IT and labor share in final goods production [see Jorgenson et al. (Reference Jorgenson, Ho and Stiroh2008) and Byrne et al. (Reference Byrne, Oliner and Sichel2017)]. The paper contributes to this literature by providing a model that incorporates a mechanism that leads to a falling equilibrium rate of innovation and IT price declines seen in the data (see Figure 1) and by providing insight into how the different parameters that are key to the falling rate of innovation affect labor productivity and output growth.
The mechanism that generates the falling equilibrium rate of innovation is, in turn, related to the findings in Bloom et al. (Reference Bloom, Jones, Van Reenen and Webb2020), who provide data to show that it has become harder to generate innovations in the semiconductor chip industry. Their observation from the semiconductor chip industry is pertinent to this paper, since Jorgenson (Reference Jorgenson2001) and Aizcorbe et al. (Reference Aizcorbe, Flamm, Khurshid, Berndt and Hulten2002) have shown that it is technological progress in the semiconductor industry, often called Moore’s law, that has been responsible for most of the price declines in IT equipment seen in Figure 1. Footnote 4 A contribution of the paper to this literature is to show that a continuously decreasing rate of innovation does not necessarily imply slower labor productivity and output growth in the IT using sector of the economy.
Second, the paper contributes to the literature on the modeling of automation and the impact of automation on employment. There are two broad approaches to modeling automation in the literature. One approach models automation as the outcome of factor-augmenting technological change and has been followed in Sachs and Kotlikoff (Reference Sachs and Kotlikoff2012) and Nordhaus (2015). An alternative approach models automation as the full replacement of labor with capital in an increasing number of tasks or sectors in the economy, exemplified in Zeira (Reference Zeira1998), Aghion et al. (Reference Aghion, Jones and Jones2017), and Acemoglu and Restrepo (Reference Acemoglu and Restrepo2018b). Footnote 5 Acemoglu and Restrepo (Reference Acemoglu and Restrepo2018a) espouse the latter approach over the former by pointing out that the labor share of income has been falling in the US economy, and falling share of labor can happen in factor-augmenting models only if the capital–labor elasticity of substitution is greater than 1. They argue that the accumulated empirical evidence points to a capital–labor elasticity of substitution that is less than 1. However, it is quite possible that the elasticity of substitution between labor and IT may well be greater than 1, even if the elasticity of substitution between labor and the broad definition of capital is less than 1. Eden and Gaggl (Reference Eden and Gaggl2018) estimate an IT–labor elasticity of substitution that is greater than 1. Footnote 6 The contribution of the paper to this literature is to provide a firm-level model with factor-augmenting technological change that draws out the implications to labor productivity, employment, and output when the IT–labor elasticity of substitution is greater than 1.
The automation enabled by technological change in IT has led to concerns about the relentless decrease in employment opportunities at IT using firms. Footnote 7 The model in this paper shows that even as the labor used at each firm falls continuously in equilibrium, employment in the IT using sector of the economy can still go up over time. This is because a decrease in the quality-adjusted price of IT reduces overall production costs and makes it profitable for firms to produce new goods. The key question that bears on employment is whether the rate at which labor is demanded in the production of new goods is greater than the rate at which labor is reduced in the production of existing goods. The model delivers a simple intuitive condition that highlights the role of two key parameters, the IT–labor elasticity of substitution and the price elasticity of demand for IT-enabled consumption goods, in answering that question.
The stark results in this paper are achieved by making some simplifying assumptions. To focus on the role of IT in production, I simplify the consumer side of the economy by ignoring income effects in the purchase of IT-enabled final goods. To focus on the role of technological change in driving productivity growth, I treat IT as a capital input that depreciates instantaneously, ignoring the relevance of savings and capital accumulation in driving labor productivity and output growth. Finally, R&D in the model does not lead to accumulation of a stock of knowledge, instead current R&D simply results in a a new version of the IT input with a higher quality. Relaxing these assumptions, and introducing the dynamics associated with capital accumulation and R&D, remains a topic for future research. In the next section, I present a simplified version of the full model to clearly illustrate the basic economic mechanism at work in the model and follow with the full model in Section 3.
2 A simple model
Consider a firm that uses two inputs, say labor and capital, to produce output using a constant elasticity of substitution production (CES) function,
 \begin{equation} y = \left(\ell^{\frac{\lambda-1}{\lambda}} + k^{\frac{\lambda-1}{\lambda}}\right)^{\frac{\lambda}{\lambda-1}},\end{equation}
where y is the output,
 $\ell$
is the labor used, k is the capital used, and
 $\lambda$
is the elasticity of substitution between capital and labor. Assume that the firm takes the wage rate, w, and the rental rate of capital, r, as given, and chooses the quantity of labor and capital to maximize its profit. No matter what the demand function facing the firm is, or the structure of the market that the the firm is in, a profit-maximizing firm will choose capital and labor so that that the marginal rate of technical substitution (MRTS),
 $\frac{\partial y}{\partial k}/{\frac{\partial y}{\partial \ell}}$
, is equal to the input price ratio,
 $r/w$
. The MRTS for the CES production function above is
 $\frac{\partial y}{\partial k}/{\frac{\partial y}{\partial \ell}}=\left(\frac{k}{\ell}\right)^{-\frac{1}{\lambda}}$
, and hence profit maximization implies
 $\left(\frac{k}{\ell}\right)^{-\frac{1}{\lambda}} = \frac{r}{w}$
. Hence, the optimal capital–labor ratio used by the firm, under any kind of demand or market structure, is
 \begin{equation} \frac{k}{\ell} = \left(\frac{r}{w}\right)^{-\lambda}.\end{equation}
The share of capital in final production cost is then,
 \begin{equation} s_k = \frac{rk}{rk+wl} = \frac{1}{1+\frac{w}{r}\frac{\ell}{k}} = \frac{1}{1+\left(\frac{r}{w}\right)^{\lambda-1}}.\end{equation}
Note from the above equation that innovations that reduce the price of capital relative to labor will lead to an increase in the capital share of production cost if
 $\lambda > 1$
and a decrease in the capital share if
 $\lambda < 1$
.
Footnote 8
Substituting the optimal capital–labor ratio into the production function gives the labor productivity
 $\displaystyle y/\ell$
:
 \begin{equation*} \frac{y}{\ell} = \left(1+\left(\frac{k}{\ell}\right)^{\frac{\lambda-1}{\lambda}}\right)^{\frac{\lambda}{\lambda-1}} = \left(1+\left(\frac{r}{w}\right)^{1-\lambda}\right)^{\frac{\lambda}{\lambda-1}}.\end{equation*}
Taking logs and differentiating both sides of the above equation with respect to time gives the growth rate of labor productivity:
 \begin{equation*}\frac{\dot{y/\ell}}{y/\ell} = -\lambda \frac{1}{1+\left(\frac{r}{w}\right)^{\lambda-1}}\frac{\dot{r/w}}{r/w},\end{equation*}
where
 $\dot{y/\ell}$
is the derivative of
 $y/\ell$
with respect to time. Noting from equation (3) that
 $\displaystyle\frac{1}{1+\left(\frac{r}{w}\right)^{\lambda-1}}$
is the capital share
 $s_k$
, the growth rate of labor productivity above can be written as:
 \begin{equation}\frac{\dot{y/\ell}}{y/\ell} = -\lambda s_k \frac{\dot{r/w}}{r/w}.\end{equation}
Thus, the impact of relative input price decline,
 $\frac{\dot{r/w}}{r/w}$
, on labor productivity growth depends on the capital share of production,
 $s_k$
. Now consider a situation where innovation in capital equipment reduces the relative price of IT,
 $r/w$
, but innovation is slowing down over time so that
 $\frac{\dot{r/w}}{r/w}$
is also decreasing over time. As can be seen from equation (3), a reduction in
 $r/w$
leads to an increase in
 $s_k$
if
 $\lambda > 1$
. If
 $s_k$
increases in inverse proportion to
 $\frac{\dot{r/w}}{r/w}$
, then the effect of increasing capital share will offset the effect of slowing innovation, and labor productivity will grow at a constant rate even in the face of slowing innovation in capital equipment. For the above mechanism to work, it is necessary that the input elasticity of substitution is greater than 1.
Footnote 9
In the next section, I develop a full model with labor and IT as the two inputs to production. In the full model, I provide a theory of why an IT–labor elasticity of substitution that is greater than 1 will lead to slowing down of innovation in the IT input, and to slowing down of the rate of decline in IT price over time, as seen in Figure (1). The full model also incorporates entry of new products into the market, which has been a defining characteristic of the IT revolution. In the full model, I also characterize how employment would behave in such an environment with slowing innovation, increasing capital share (and decreasing labor share), and sustained labor productivity growth.
3 Model
Consider an economy with three sectors. The primary sector produces a consumption good, using labor as the only input. A digital sector produces the second consumption good, which is a differentiated good, using labor and IT as inputs. Footnote 10 The third intermediate sector, the IT sector, produces the IT input used by firms in the digital sector. Footnote 11
The primary sector is perfectly competitive, and it takes one unit of labor to produce one unit of output in this sector. I set labor as the numeraire. Hence, the price of the primary consumption good is equal to 1, and the wage rate is also equal to 1 as long as the primary good is produced in equilibrium. Footnote 12 The focus of this paper is on labor productivity growth, output growth, and employment in firms in the digital sector, and for the digital sector as a whole.
The model is in continuous time. The dynamic equilibrium in the model is a series of static equilibria. Hence, I characterize the equilibrium of the static model first and ignore the time variable in the initial part of the model description.
3.1 Demand
Consumers in the economy have identical quasilinear preferences over the two consumption goods. The demand for the consumption goods can be derived from the choices made by a representative consumer. The representative consumer’s utility maximization problem is
 \begin{eqnarray*} \max_{C, y(i)} U(C, Y) &=& C + \frac{\alpha}{\alpha-1} Y^{\frac{\alpha-1}{\alpha}}, \:\:\:\:\:\: \alpha > 1 \\ s.t \:\:\: C &+& \int_{i=0}^{N}p(i)y(i) di = L + \Pi, \\ Y &=& \left(\int_{i=0}^{N}y(i)^{\frac{\eta-1}{\eta}}di\right)^{\frac{\eta}{\eta-1}}, \:\:\:\:\:\: \eta > 1 \\ C &>=0,&\:\: Y >= 0,\end{eqnarray*}
where C is the quantity of the primary good, y(i) is the quantity of variety i digital good, N is the measure of digital goods in the market, L is the total labor supplied, and
 $\Pi$
is the total profits made by all the firms in the economy. The solution to the consumer’s problem gives the demand functions for the consumption goods:
 \begin{eqnarray} C &=& L + \Pi - P^{1-\alpha}, \end{eqnarray}
 \begin{eqnarray} Y &=& P^{-\alpha}, \end{eqnarray}
 \begin{eqnarray} y(i) &=& Y\left(\frac{p(i)}{P}\right)^{-\eta} = p(i)^{-\eta}P^{\eta-\alpha}, \end{eqnarray}
where P is the aggregate price index given by:
 \begin{equation}P = \left(\int\limits_{0}^{N} {p(i)^{1-\eta}di}\right)^{\frac{1}{1-\eta}}.\end{equation}
As is well known for the CES aggregator, the consumer expenditure on digital goods is
 \begin{equation} \int_{i=0}^Np(i)y(i) di = P Y = P^{1-\alpha}.\end{equation}
Note that the expenditure on the aggregate digital good depends only on the price index, P. The fact that there is no income effect in the purchase of digital goods is a direct consequence of the assumption of quasilinear consumer preferences. The income that is not spend on the digital good,
 $L +\Pi - P^{1-\alpha}$
, is spent on the primary good (see equation (5)).
Footnote 13
The parameter
 $\alpha$
is the price elasticity of aggregate demand for digital consumption goods, and
 $\eta$
is the price elasticity of demand for an individual digital good. I will impose the condition that
 $\eta > \alpha$
. Next, I describe the digital sector of the economy.
3.2 Digital sector
The digital sector in the model stands for the sector of the economy which produces goods and services that use IT as an input in production. The IT input is assumed to be a composite of all IT hardware, software, and IT services used by firms, and I take any firm that uses any of these to be included in the digital sector of the economy. Footnote 14 I assume monopolistic competition in the digital sector, with firms in the sector-making products that are varieties of a differentiated good. I assume that all firms in the digital sector are identical, which helps to bring out the economic mechanisms in the model with clarity. Footnote 15
3.2.1 Production technology
All digital products are made with the same CES production technology:
 \begin{equation} y = \left(\ell^{\frac{\lambda-1}{\lambda}} + (q x)^{\frac{\lambda-1}{\lambda}}\right),\end{equation}
where y is the output produced,
 $\ell$
is the labor input used, and x is the number of physical units of the IT input used. Each unit of the IT input has quality q so that the total quality units of the IT input used is qx. The IT–labor elasticity of substitution for the production function above is
 $\lambda$
. To focus on the role of technological change in driving productivity growth, I treat the IT input as a capital input that depreciates instantaneously, thus ignoring the role of capital accumulation in IT toward productivity growth.
Footnote 16
The next section sets up the profit maximization problem of a firm in the digital sector and derives the firm’s demand for IT and labor.
3.2.2 Digital firm’s profit maximization problem
Each firm in the digital sector purchases the IT input from a supplier and makes its pricing and production decisions to maximize its profits. The profit of a firm in the digital sector depends on the prices set by the competitors, as captured in the price index P, as well as on the quality, q, and price, r, of the purchased IT input. However, since there is a continuum of firms in the digital sector, each firm assumes that its choices do not affect P, q, or r. For every product that a firm sells, the firm faces the problem:
 \begin{eqnarray*}\max_{p, \ell, x} &\;&p y- r qx - \ell\\[3pt] s.t \:\:&\;& y = p^{-\eta}P^{\eta-\alpha}, \\[3pt] \:\:&\;& y = \left(\ell^{\frac{\lambda-1}{\lambda}} + (q x)^{\frac{\lambda-1}{\lambda}}\right)^{\frac{\lambda}{\lambda-1}},\end{eqnarray*}
where the constraints represent the restrictions imposed by demand and production technology, as given in equations (7) and (10), respectively. The optimal choices of
 $\ell$
and x give the familiar condition that requires the the MRTS of the inputs to be equal to the input price ratio. The MRTS for the production function is
 $\frac{\partial y}{\partial x}/{\frac{\partial y}{\partial \ell}} = {q^{\frac{\lambda-1}{\lambda}}}\left(\frac{x}{\ell}\right)^{-\frac{1}{\lambda}}$
, and the price ratio is simply rq since the wage rate is equal to 1. Hence,
 $ q^{\frac{\lambda-1}{\lambda}}\left(\frac{x}{\ell}\right)^{-\frac{1}{\lambda}} = rq $
. The optimality condition can be written in a more intuitive form in terms of the IT–labor ratio, similar to equation (2) in the simple model inSection 2:
 \begin{equation} \frac{qx}{\ell}=r^{-\lambda}.\end{equation}
Using equation (11) in the production function in equation (10) gives the labor and IT demanded by the firm:
 \begin{eqnarray} \ell &=& y \left(\frac{1}{(1+r^{1-\lambda})^{\frac{1}{1-\lambda}}}\right)^{-\lambda}, \end{eqnarray}
 \begin{eqnarray} qx &=& y \left(\frac{r}{(1+r^{1-\lambda})^{\frac{1}{1-\lambda}}}\right)^{-\lambda}. \end{eqnarray}
Further, the first-order condition for the choice of price p gives the familiar markup equation for price with constant elasticity demand:
 \begin{equation} p = \frac{\eta}{\eta-1}(1+r^{1-\lambda})^{\frac{1}{1-\lambda}}.\end{equation}
Note that the second term on the right-hand side,
 $(1+r^{1-\lambda})^{\frac{1}{1-\lambda}}$
, is the familiar unit cost of production for the CES production function, with the wage rate being set equal to 1. Using equations (12), (13), and (14), the profit made by a firm on each product it sells is
 \begin{equation} \pi = py-\ell - rqx = \frac{1}{\eta-1}(1+r^{1-\lambda})^{\frac{1}{1-\lambda}}y.\end{equation}
The next section uses the equation for gross profit above and describes the restriction imposed on profit by the entry of new firms in the digital sector.
3.2.3 Entry in the digital sector
The manufacture and sale of any product requires employees in some key roles, independent of the scale of production. Footnote 17 I incorporate this by assuming that each firm incurs a recurring fixed cost of F units of labor for every product that it sells. Firms will launch new products until the gross profit from each product is just enough to cover the fixed cost F. Footnote 18 This fixes the profit that a firm gets from each product:
 \begin{equation} \pi=F.\end{equation}
Combining the expression for profit in equation (15) above with entry condition in equation (16) gives the optimal quantity of each product:
 \begin{equation} y = (\eta-1)F (1+r^{1-\lambda})^{\frac{1}{\lambda-1}}.\end{equation}
Substituting the expression for y from equation (17) into equation (13) gives the expenditure on IT by each firm:
 \begin{equation} r qx = \frac{r^{1-\lambda}}{1+r^{1-\lambda}}(\eta-1)F,\end{equation}
and the demand for IT input from downstream firms:
 \begin{equation} x = \frac{1}{rq} \frac{r^{1-\lambda}}{1+r^{1-\lambda}}(\eta-1)F.\end{equation}
Armed with the demand function for IT input above, I now describe the profit maximization problem faced by the supplier of IT input.
3.3 IT-producing sector
The IT supplier chooses its pricing, production, and R&D investment decisions to maximize profits. The supplier has two choice variables to maximize profits. First, the supplier must choose the quality of the IT input, q, which in turn determines the amount of R&D investment that the supplier has to make. Second, the supplier must decide the price, r, to charge for each quality unit of the IT input. I approach the supplier’s problem by first solving for the optimal price r in terms of q and then solving for the q that maximizes the profit net of the R&D investment.
Since the supplier is a monopolist, a possible candidate for r is the one that maximizes the monopoly profit. Although most IT-producing software and hardware sectors have a market leader, in most cases the leader face some competitive pressure from smaller firms. Footnote 19 I incorporate this by assuming that the supplier faces competition from an outside firm that can make the IT input.
The incumbent supplier can produce one physical unit of the IT input, of any quality, using h units of labor. The outside competitor can produce one physical unit of IT with one unit of labor. I assume
 $h<1$
so that the supplier has a cost advantage over the outside competitor. The supplier and the competitor engage in Bertrand competition. The supplier will capture the entire market if it sets a price infinitesimally lower than the cost of the competitor (equal to 1). The supplier has no incentive to increase the price because it will then lose the market entirely to its competitor. The supplier might however wish to reduce its price, if the profit-maximizing monopoly price is below the unit cost of the competitor. Let
 $r_m$
be the monopoly price of the supplier, that is,
 $r_m$
solves the problem:
 \begin{eqnarray*} \max_{r} &\;& \pi_s = (rq-h)Nx \\[3pt] s.t \;\:\: x &=& \frac{1}{rq} \frac{r^{1-\lambda}}{1+r^{1-\lambda}}(\eta-1)F,\end{eqnarray*}
where
 $\pi_s$
is the gross profit of the supplier, and the constraint is the demand function for IT derived in equation (19). The optimal price of the supplier per unit of the IT input is then the minimum of the monopoly price or the competitor’s cost, equal to 1, that is,
 $Min (r_m q, 1)$
.
Next, given the optimal choice of r, the supplier chooses q to maximize the profit net of the R&D investment.
Footnote 20
The R&D cost of developing an IT input of a given quality depends on the current state of scientific knowledge, denoted by z.
Footnote 21
Specifically, I assume that the R&D cost for developing an IT input of quality q is given by
 $\displaystyle\frac{R(q)}{z}$
, where z is the state of basic scientific knowledge. The function R(q) includes all the R&D needed on IT hardware and software to develop quality q IT input. As the state of scientific knowledge z increases, the R&D investment needed to develop the IT input of any quality decreases. The changes in z are motivated by concerns outside of the model, and hence exogenous to the IT-producing sector. The supplier’s innovation problem is then,
 \begin{eqnarray*}\max_{q} V_s&=& \pi_s - \frac{R(q)}{z},\end{eqnarray*}
where
 $V_s$
is the net profit of the supplier and
 $\pi_s$
is the gross profit obtained by solving the pricing problem above. As noted in the introduction, R&D in the model does not result in any accumulation of a stock of knowledge and simply results in a new version of the IT input with a higher quality, hence making the R&D investment decision a static problem.
Footnote 22
In the next section, I derive the remaining conditions necessary to define and characterize the equilibrium, namely the market-clearing condition for the digital sector and the labor market.
3.4 Market clearing
3.4.1 Market clearing in the digital sector
The total revenue of all digital products must equal the consumer expenditure on digital goods. From equations (14) and (17), it can be seen that the revenue for each product is
 $py = \eta F$
. Hence, the total revenue of all firms in the digital sector is
 $N\eta F$
. The total consumer expenditure on goods produced in the digital sector was derived in equation (9) to be
 $P^{1-\alpha}$
. Hence, for market in the digital sector to clear, it must be that,
 \begin{equation} N\eta F = P^{1-\alpha}.\end{equation}
I rewrite the condition in a form that gives the number of firms that can exist in the digital sector for any given IT price r. Since each firm charges the same price p, the price index is
 $P = \left(\int_{i=0}^N p(i)^{1-\eta}\right)^{1-\eta} = N^{\frac{1}{1-\eta}}p $
. Hence, the above market-clearing condition reduces to
 $N\eta F = \left(N^{\frac{1}{1-\eta}}p\right)^{1-\alpha}$
. Using the expression for p in equation (14), the condition can be written as:
 \begin{equation*} N = \frac{(1+r^{1-\lambda})^{\frac{1}{\lambda-1}\frac{(\alpha-1)(\eta-1)}{\eta-\alpha}}}{(\eta^\alpha (\eta-1)^{1-\alpha} F)^{\frac{\eta-1}{\eta-\alpha}}}.\end{equation*}
The exponent
 $\frac{1}{\lambda-1}\frac{(\alpha-1)(\eta-1)}{\eta-\alpha}$
plays a key role in the results on innovation, productivity, and employment, and hence I denote it with the a new symbol,
 $\varphi$
. Hence, the market clearing in the digital sector can be written as:
 \begin{eqnarray} N &=& \frac{(1+r^{1-\lambda})^\varphi}{(\eta^\alpha (\eta-1)^{1-\alpha} F)^{\frac{\eta-1}{\eta-\alpha}}} , \end{eqnarray}
where
 \begin{equation} \varphi = \frac{1}{\lambda-1}\frac{(\alpha-1)(\eta-1)}{\eta-\alpha}. \end{equation}
Finally, I state the labor market-clearing condition in the next section.
3.4.2 Labor market clearing
Labor is employed for production, fixed costs, and R&D in the model. C units of labor are employed in the primary sector to produce C units of the primary consumption good. In the digital sector,
 $N\ell$
units of labor are employed in production of the N different varieties of the digital good, and NF units of labor in fixed costs. In the IT-producing sector, hNx units of labor are employed in production and R units of labor in R&D. Hence, the labor market-clearing condition requires
 \begin{equation} C+ N\ell + NF + h Nx + R = L,\end{equation}
where L is the labor supply. Note that because of our assumption of quasilinear consumer preferences, the output of digital sector will be independent of the total consumer income (see equation (6)). Hence, labor used in the digital sector will not depend on the total labor supply, L. Instead, consumption in the primary sector will adjust so that output of primary good is simply what is possible by the labor left over after all the requirements in the digital sector have been met. Footnote 23 In the next section, I describe the equilibrium for the environment described above.
3.5 Equilibrium
There are no intertemporal relationships in the model, and any change in the values of any of the variables in the model is triggered by changes in the state of scientific knowledge, z. Hence, it is sufficient to derive the equilibrium variables at any given point in time (or for any value of z) to understand the dynamics of the model as z changes.
An equilibrium of the model is set of price for each digital good (p), price for the IT input (r), quantities for the consumption goods
 $\{C, y(i)\}$
, labor and IT input usage of each firm in the digital sector,
 $\{\ell, x\}$
, quality of the IT input q, and measure of firms in the digital sector (N), such that,
-
 $\{C, y(i)\}$
solves the consumer’s utility maximization problem,
-
$\{p, \ell, x\}$
solves profit maximization problem of each firm in the digital sector,
-
$\{r, q\}$
solves the profit maximization problem of the IT supplier, given N and z,
-
Market-clearing condition in the digital sector is satisfied,
-
Labor market-clearing condition is satisfied. Footnote 24


I show the existence of the equilibrium and characterize the key properties of the equilibrium in the propositions below, adding on the assumptions necessary to derive each proposition.
Assumption 1
 $ \lambda > 1. $
Assumption 2
 $h > \frac{\lambda-1}{\lambda}$
.
Proposition 1 Under Assumptions 1 and 2, for every q, the optimal policy of the supplier is to set the limit price of
 $rq = 1$
.
Proof. See Appendix.

Assumption 2 puts a lower threshold on the unit production cost of the supplier, which ensures that the supplier’s monopoly price will be greater than the unit cost of the potential competitor. Note that for plausible values of
 $\lambda$
, the condition allows for a realistic range of values of the cost difference between the supplier and the competitor.
Footnote 25
The limit pricing policy gives thevalue of r:
 \begin{equation} r = \frac{1}{q}.\end{equation}
The above limit pricing policy implies that the two measures of innovation that are used in the literature, the rate of decline in price
 $\left(\frac{\dot{r}}{r}\right)$
and the rate of increase in quality
 $\left(\frac{\dot{q}}{q}\right)$
, are equal in magnitude in the model. The reason for this result is that the supplier’s pricing policy is focused toward warding of competition; hence, the pricing policy is driven by cost considerations alone and excludes demand considerations. The rest of the paper will use the above limit pricing policy to recast the model in terms of q. In the discussions below, I refer to the rate of innovation as being the rate of quality improvement,
 $\frac{\dot{q}}{q}$
, but note that this is also equal in magnitude to the rate of IT price decline,
 $\frac{\dot{r}}{r}$
.
Footnote 26
Assumption 3 R(q) is increasing in q,
 $\frac{qR''(q)}{R'(q)}$
is nondecreasing in q, and
 $\lim_{q\rightarrow 0} \frac{q R''(q)}{R'(q)} \geq \lambda-2$
.
Assumption 4
 $\varphi <2$
, or equivalently
 $\lambda > 1 + \displaystyle\frac{1}{2}\frac{(\alpha-1)(\eta-1)}{\eta-\alpha}$
.
Proposition 2 Under Assumptions 2–4, there exists (q, N) such that q solves the supplier’s R&D problem given N, and N clears the market in the digital sector given q, hence guaranteeing the existence of equilibrium.
Proof. Substituting
 $r=\frac{1}{q}$
, the digital sector market-clearing condition in equation (21) becomes
 \begin{equation} N = \frac{(1+q^{\lambda-1})^\varphi}{(\eta^\alpha (\eta-1)^{1-\alpha} F)^{\frac{\eta-1}{\eta-\alpha}}}. \end{equation}
Similarly, substituting
 $r = \frac{1}{q}$
, the supplier’s innovation problem becomes
 \begin{eqnarray*} \max_{q} V_s &=& (1-h)N x - \frac{R(q)}{z}, \\ s.t \: x &=& \frac{q^{\lambda-1}}{1+q^{\lambda-1}}(\eta-1)F. \end{eqnarray*}
Substituting the constraint in the objective function and taking the derivative with respect to q gives the first-order condition:
 \begin{equation} \frac{d V_s}{dq} = N(1-h)(\eta-1)F (\lambda-1) \frac{q^{\lambda-2}}{(1+q^{\lambda-1})^2} - \frac{R'(q)}{z} = 0. \end{equation}
Equations (25) and (26) provide two equations in N and q. However, one needs to ensure that the second-order condition for the supplier’s problem is satisfied. Substituting for N from equation (25) into equation (26) gives
 \begin{equation} \frac{d V_s}{dq} = \frac{(1-h)(\lambda-1)(\eta-1)F}{(\eta^\alpha (\eta-1)^{1-\alpha} F)^{\frac{\eta-1}{\eta-\alpha}}} \frac{q^{\lambda-2}}{(1+q^{\lambda-1})^2} - \frac{R'(q)}{z} = 0. \end{equation}
Taking the derivative with respect to q and using equation above, it can be seen that the second-order condition is
 \begin{equation} \frac{qR''(q)}{R'(q)} > \lambda-2 - (2-\varphi)(\lambda-1)\frac{q^{\lambda-1}}{1+q^{\lambda-1}}. \end{equation}
Since
 $\frac{q^{\lambda-1}}{1+q^{\lambda-1}}$
is an increasing function of q, Assumptions 3 and 4 ensure that the second-order condition above is satisfied for all
 $q>0$
, and a solution to the supplier’s problem exists. Hence, for any R&D cost function that satisfies Assumption 3, equations (25) and (26) can be solved to obtain N and q in terms of z, and the rest of the model variables can be solved for interms of z.
Footnote 27
The next result in Proposition 3 shows how the labor and IT share of production cost changes with q in equilibrium, leading to Proposition 4 which shows why the equilibrium growth rate of q itself will slow down over time. Denote the labor and IT share of production costs by
 $s_\ell(q)$
and
 $s_x(q)$
, respectively.
Proposition 3 Under Assumptions 2–4,
-
(i) The IT share of production cost,
$s_x(q)$
, is increasing in q, and the labor share,
$s_\ell(q)$
, is decreasing in q. -
(ii) The elasticity of the rate of increase of IT share with q
$\left(\textrm{i.e.}\ \displaystyle \frac{qs_x^{\prime\prime}(q)}{s_x^{\prime}(q)}\right)$
is decreasing with q.


Proof. Substituting
 $\displaystyle r=\frac{1}{q}$
into equation (11), one can express the optimal IT–labor ratio chosen by the supplier in terms of q:
 \begin{equation} \frac{x}{\ell} = q^{\lambda-1}.\end{equation}
Using the optimal IT–labor ratio, the labor and IT shares in the production cost of each firm in the digital sector can be expressed in terms of q:
 \begin{eqnarray} s_\ell(q) &=& \frac{\ell}{\ell + rq x} = \frac{1}{1+ \frac{x}{\ell}} = \frac{1}{1+q^{\lambda-1}}, \end{eqnarray}
 \begin{eqnarray} s_x (q) &=& \frac{rqx}{ \ell + rq x} = \frac{q^{\lambda-1}}{1+q^{\lambda-1}}. \end{eqnarray}
From the expressions for
 $s_\ell(q)$
and
 $s_x(q)$
above, it can be seen that,
 \begin{eqnarray} s_\ell^{\prime}(q) &=& -(\lambda-1)\frac{q^{\lambda-2}}{(1+q^{\lambda-1})^2}, \end{eqnarray}
 \begin{eqnarray} s_x^{\prime}(q) &=& (\lambda-1)\frac{q^{\lambda-2}}{(1+q^{\lambda-1})^2}, \end{eqnarray}
 \begin{eqnarray} \frac{q s_x^{\prime\prime}(q)}{s_x^{\prime}(q)} &=& (\lambda-2) - 2(\lambda-1)\frac{q^{\lambda-1}}{1+q^{\lambda-1}}. \end{eqnarray}
From the above expressions, it can be seen that the results
 $s_\ell^{\prime}(q)<0$
and
 $s_x^{\prime}(q)>0$
simply follow from Assumption (1) that
 $\lambda>1$
. For the result that
 $ \displaystyle \frac{qs_x^{\prime\prime}(q)}{s_x^{\prime}(q)}$
is decreasing in q, note that the term
 $\displaystyle\frac{q^{\lambda-1}}{1+q^{\lambda-1}}$
is increasing in q, and hence the elasticity
 $\displaystyle\frac{qs_x^{\prime\prime}(q)}{s_x^{\prime}(q)}$
is decreasing in q, under Assumption 1 that
 $\lambda>1$
.
The fact that equal percentage increases in q result in smaller and smaller percentage increases in
 $s_x^{\prime}(q)$
is central to understanding why the rate of innovation in IT is slowing down over time, which I tackle in the next result. Since the remaining results move on to examining the dynamics of the model when scientific advances reduce the cost of innovation to the IT supplier, I start by denoting the rate of scientific advance by g(t), where
 $g(t)\equiv \displaystyle\frac{\dot{z}(t)}{z(t)}$
.
4 Slowing of innovation in IT
Assumption 5 Science is advancing at each point in time, but the rate of advance is not increasing over time, that is,
 $g(t)>0$
and
 $g'(t)<=0$
for all t, where
 $g(t)\equiv \displaystyle\frac{\dot{z}(t)}{z(t)}$
.
Proposition 4 Under Assumptions 2–5,
-
(i) the equilibrium value of q will increase over time,
$\dot{q} > 0,$
-
(ii) the equilibrium rate of innovation,
$\displaystyle\frac{\dot{q}}{q}$
, will decrease over time.


Proof. (i) The growth rate of of q can be obtained from the supplier’s first-order condition in equation (27). Taking the term R
 $^{\prime}$
(q) to the right-hand side of the equation, taking logs on both sides, differentiating with respect to time, and re-arranging gives
 \begin{equation} \frac{\dot{q}}{q} = \frac{g(t)}{\left(\displaystyle\frac{qR''(q)}{R'(q)} - (\lambda-2 - (\lambda-1)(2-\varphi)\frac{q^{\lambda-1}}{1+q^{\lambda-1}})\right)}.\end{equation}
Since
 $g(t)>0$
by Assumption 5, and since the term in the brackets is greater than 0 by the second-order condition in equation (28) which is satisfied under Assumptions 2–5, it followsthat
 $\frac{\dot{q}}{q}>0$
.
(ii) To see that
 $\frac{\dot{q}}{q}$
is decreasing over time, first note that the numerator g(t) is either constant or decreasing over time from Assumption 5. In the denominator, the term
 $q\frac{R''(q)}{R'(q)}$
is nondecreasing over time because
 $q\frac{R''(q)}{R'(q)}$
is nondecreasing in q by Assumption 3, and q is increasing over time by the result (i) in this proposition. Since
 $\lambda>1$
and
 $2>\varphi$
by Assumption 4, and since
 $\frac{q^{\lambda-1}}{1+q^{\lambda-1}}$
is increasing in q, it follows that
 $(\lambda-1)(2-\varphi)\frac{q^{\lambda-1}}{1+q^{\lambda-1}}$
is increasing in q. Putting together the fact that
 $q\frac{R''(q)}{R'(q)}$
is nondecreasing over time and
 $(\lambda-1)(2-\varphi)\frac{q^{\lambda-1}}{1+q^{\lambda-1}}$
is increasing over time, it follows that the denominator in equation (35) is increasing over time, and hence
 $\frac{\dot{q}}{q}$
is decreasing over time.
Discussion: The key driver of the slowing of innovation is Assumption 1 that the IT–labor elasticity of substitution,
 $\lambda$
, is greater than 1. This assumption means that the share of IT in total production cost increases as increase in quality continuously drives down the price of IT relative to labor. But as Proposition 3 shows, the rate of increase of IT share will also continually slow down, reducing the supplier’s incentive to innovate and hence slowing down the rate of quality improvement. The above reasoning can be clearly seen by recasting the supplier’s problem in terms of the IT share of production. Using the expressions for r and
 $s_x$
in terms of q from equations (24) and (31), the supplier’s innovation problem can be written as:
 \begin{equation*}\max_{q} N(1-h)s_x(q) (\eta-1)F - \frac{R(q)}{z}, \\\end{equation*}
and the first-order condition in equation (26) is equivalent to,
 \begin{equation} N(1-h)(\eta-1)Fs_x^{\prime}(q) - \frac{R'(q)}{z} = 0.\end{equation}
The first term on the left-hand side of the equation,
 $N(1-h)(\eta-1)Fs_x^{\prime}(q)$
, is the increase in gross profit of the supplier from a small increase in q, and the second term,
 $\frac{R'(q)}{z}$
, is the corresponding increase in R&D cost necessary to achieve that increase in quality. The equation above can be expressed in terms of growth rates by taking the term
 $\displaystyle\frac{R'(q)}{z}$
to the right-hand side, taking logs on both sides of the resulting equation and then differentiating with respect to time. This gives
 \begin{equation} \frac{qs_x^{\prime\prime}(q)}{s_x^{\prime}(q)}\frac{\dot{q}}{q} + \frac{\dot{N}}{N} = \frac{\dot{q}}{q}\frac{qR''(q)}{R'(q)} - g(t).\end{equation}
As can be seen from the left-hand side of the equation, increasing q affects the supplier’s gross profits through an intensive margin and an extensive margin. The first term on the left,
 $\displaystyle\frac{qs_x^{\prime\prime}(q)}{s_x^{\prime}(q)}\displaystyle\frac{\dot{q}}{q}$
, is the intensive margin and represents percentage increase in the gross profits of the supplier that results from each downstream firm increasing its share of IT in production. The second term,
 $\displaystyle\frac{\dot{N}}{N}$
, is the extensive margin and represents the percentage increase in gross profits arising from supplier’s sales to new firms that enter the market in response to decrease in the IT price that results from an increase in q. To see the role of
 $\lambda$
in slowing innovation, suppose there is no possibility of entry and the supplier only has the intensive margin,
 $\displaystyle\frac{qs_x^{\prime\prime}(q)}{s_x^{\prime}(q)}$
. The rate of innovation in this case can be obtained by putting
 $\frac{\dot{N}}{N}=0$
in equation (37):
Footnote 28
 \begin{equation*} \frac{\dot{q}}{q} = \frac{g(t)}{\left(\displaystyle\frac{qR''(q)}{R'(q)} - \displaystyle\frac{qs''(q)}{s'(q)}\right)}.\end{equation*}
The term g(t) is not increasing in t from Assumption 5, and from Assumption 3,
 $\displaystyle \frac{qR''(q)}{R'(q)}$
is not decreasing with q. Hence,
 $\displaystyle\frac{\dot{q}}{q}$
will reduce over time if
 $\displaystyle\frac{qs_x^{\prime\prime}(q)}{s_x^{\prime}(q)}$
is decreasing in q, and this is exactly what
 $\lambda>1$
assumption provides, as shown in Proposition 3.
If entry of new products is possible, then the supplier has the additional extensive margin from innovation. For the rate of innovation to slow down, the benefit that the supplier gets from entry should not be too high, which leads to the
 $\varphi < 2$
condition in Assumption 4.
Footnote 29
Note that
 $\varphi < 2$
can be written as,
 $\lambda > 1 + \displaystyle\frac{1}{2}\frac{(\alpha-1)(\eta-1)}{\eta-\alpha}$
, which embeds the assumption that
 $\lambda > 1$
.
5 Labor productivity and output growth in the digital sector
In the next section, I show that the rate of labor productivity growth at each firm can remain constant, even when the innovation that drives the growth slows down over time.
Assumption 6 The R&D cost for developing IT input of quality q is given by
 $R(q) = Aq^{\lambda-1}$
, where A is a constant.
Assumption 7 Scientific knowledge advances at a constant rate,
 $g(t)\equiv\frac{\dot{z}(t)}{z(t)} = g$
.
Proposition 5 Under Assumptions 2–7, the growth rate of IT quality,
 $\frac{\dot{q}}{q}$
, and decline rate of IT price,
 $\frac{\dot{r}}{r}$
, slows down over time, but labor productivity and output at each firm grows at a constant rate.
Proof. With
 $R=A q^{\lambda-1}$
, we have
 \begin{equation}\frac{qR''(q)}{R'(q)} = \lambda-2.\end{equation}
Substituting
 $\frac{qR''(q)}{R'(q)} = \lambda-2$
and
 $g(t)=g$
into equation (35) gives
 \begin{equation} \frac{\dot{q}}{q} = \frac{g}{(\lambda-1)(2-\varphi)\frac{q^{\lambda-1}}{1+q^{\lambda-1}}}.\end{equation}
Hence as q increases over time,
 $\frac{q^{\lambda-1}}{1+q^{\lambda-1}}$
increases, and hence
 $\frac{\dot{q}}{q}$
decreases, tending asymptotically to
 $\displaystyle \frac{g}{\displaystyle (\lambda-1)(2-\varphi)}$
.
To show that labor productivity growth is constant, substitute
 $r=\frac{1}{q}$
from equation (24) into the labor demand function in equation (12) to get the labor productivity of each firm as:
 \begin{equation} \frac{y}{\ell} = (1+q^{\lambda-1})^{\frac{\lambda}{\lambda-1}}.\end{equation}
Taking logs on both sides of the equation and differentiating with respect to time gives
 \begin{equation} \frac{\dot{y/\ell}}{y/\ell} = \lambda \frac{q^{\lambda-1}}{1+\lambda-1}\frac{\dot{q}}{q}.\end{equation}
Noting from equation (40) that
 $\displaystyle\frac{\dot{q}}{q}\frac{q^{\lambda-1}}{1+q^{\lambda-1}}=\displaystyle\frac{g}{(\lambda-1)(2-\varphi)}$
, one can see that labor productivity grows at a constant rate given by:
 \begin{equation} \frac{\dot{y/\ell}}{y/\ell} = \frac{\lambda}{\lambda-1}\frac{g}{2-\varphi}.\end{equation}
Finally, it can be seen from equation (17) that output of each firm also grows at a constant rate, given by:
 \begin{align} \frac{\dot{y}}{y} = \frac{q^{\lambda-1}}{1+q^{\lambda-1}} \frac{\dot{q}}{q} = \frac{g}{(\lambda-1)(2-\varphi)}.\\[-20pt]\nonumber\end{align}
Discussion : In keeping with the argument in the simple model in Section 2, the reason that labor productivity grows at a constant rate is that the share of IT in production cost increases in inverse proportion to the rate of relative input price decline. Noting from equation (31) that
 $\displaystyle\frac{q^{\lambda-1}}{1+q^{\lambda-1}} = s_x(q)$
, equation (42) can be written as,
 $\displaystyle\frac{\dot{y/\ell}}{y/\ell} = \lambda s_x(q) \displaystyle\frac{\dot{q}}{q}$
.
Footnote 30
Hence, if
 $s_x(q)$
increases in inverse proportion to
 $\displaystyle{\frac{\dot{q}}{q}}$
, the labor productivity will grow at a constant rate. This will be the case if Assumption 6 is satisfied, since substituting
 $\displaystyle\frac{q^{\lambda-1}}{1+q^{\lambda-1}} = s_x(q)$
in equation (40) gives
 \begin{equation} s_x(q)\frac{\dot{q}}{q} = \frac{g}{\displaystyle (\lambda-1)(2-\varphi)}.\end{equation}
Although the above paragraph provides an explanation of why labor productivity grows at a constant rate, it does not provide an understanding of the role played by the particular form of the R&D cost function in Assumption 6. To get a better understanding, I recast the supplier’s innovation problem as one of choosing the IT–labor ratio,
 $x/\ell$
, of firms in the downstream digital sector. While choosing q, the supplier is indirectly choosing
 $x/\ell$
, since equation (29) tells us that downstream firm’s optimal IT–labor ratio is
 $x/\ell = q^{\lambda-1}$
. The supplier’s marginal benefit and marginal cost of innovation, as well as the resulting equilibrium labor productivity, can all be written in terms of
 $x/\ell$
, as I show below.
I first obtain the labor productivity of downstream firms in terms of
 $x/\ell$
by substituting
 $q^{\lambda-1} = x/\ell$
in equation (40) to get
 \begin{equation} \frac{y}{\ell} = (1+x/\ell)^{\frac{\lambda}{\lambda-1}}.\end{equation}
Next, I express the supplier’s marginal benefit and marginal cost of innovation of in terms of
 $x/\ell$
. Noting that
 $s_x(q)=\frac{q^{\lambda-1}}{1+q^{\lambda-1}}=\frac{x/\ell}{1+x/\ell}$
, the suppliers gross profit can be written as,
 $\pi_s = N(1-h)(\eta-1)F\frac{x/\ell}{1+x/\ell}$
. Hence, the marginal benefit that the supplier gets by increasing q to induce a small change in the
 $x/\ell$
of downstream firms is
 \begin{equation} MB = \frac{d \pi_s}{d \frac{x}{\ell}} = N(1-h)(\eta-1)F\frac{1}{(1+x/\ell)^2} = D\:\left(\frac{1}{1+x/\ell}\right)^{2-\varphi},\end{equation}
where I have substituted for N in terms of
 $x/\ell$
using equations (25) and (29), and D is a constant.
Footnote 31
Equation (45) shows that labor productivity
 $y/\ell$
will grow at a constant rate if
 $(1+x/\ell)$
grows at a constant rate, and equation (46) shows that
 $(1+x/\ell)$
will grow at constant rate if the marginal benefit to the supplier grows at a constant rate. Since in equilibrium, the supplier chooses marginal benefit of innovation to be equal to the marginal cost of innovation, if the marginal cost of innovation were to increase at a constant rate, then marginal benefit would too. Assumption 6 on the R&D cost function achieves just that and ensures that the supplier’s marginal R&D cost to increasing downstream
 $x/\ell$
grows at a constant rate.
Constant growth of labor productivity.
Notes: The intersection of the logMB (log of marginal benefit to the supplier, given in equation (46)) and logMC (log of marginal cost to the supplier, given in equation (47)) gives the equilibrium value of
 $log(1+x/\ell)$
on the x-axis. Three lines for log(MC) are shown, corresponding to three value of z(t) separated by unit intervals of time. Since z grows at a constant rate g, the the vertical distance between the three horizontal log(MC) lines are equal to g. As the marginal cost comes down the equilibrium value of
 $log(1+x/\ell)$
increases. Since log(MB) varies linearly with
 $log (1+x/\ell)$
and logMC does not change with
 $x/\ell$
for a given z, equal decreases in logMC would lead to equal increases in
 $log(1+x/\ell)$
, indicating that
 $1+x/\ell$
grows at a constant rate in equilibrium. The upward sloping line is the log of labor productivity,
 $log (y/\ell)$
, which varies linearly with
 $log(1+x/\ell)$
as indicated in equation (45). Since
 $log(y/\ell)$
increases linearly with
 $log(1+x/\ell)$
, equal increases in
 $log(1+x/\ell)$
leads to equal increases in
 $log (y/\ell)$
values in equilibrium, indicating constant growth in labor productivity. The particular form of R&D cost function in Assumption 6 ensures that the logMC lines are horizontal.

This is easily seen by recasting the R&D cost function from the domain of q to that of
 $x/\ell$
. If the R&D cost is
 $R(q)=Aq^{\lambda-1}$
as in Assumption 6, then this means that the R&D cost to induce a downstream IT–labor ratio of
 $x/\ell$
is equal to
 $\displaystyle\frac{Ax/\ell}{z}$
. Hence, the marginal cost to the supplier of inducing the downstream firms to operate at a slightly higher
 $x/\ell$
is
 \begin{equation} MC = \frac{d \frac{A x/\ell}{z}}{d x/\ell} = \frac{A}{z}.\end{equation}
With z increasing at a constant rate from Assumption 7, the marginal cost of innovation (in terms of
 $x/\ell$
) to the supplier declines at a constant rate, ensuring that in equilibrium the marginal benefit, given in equation (46), would also decline at a constant rate, which in turn makes the labor productivity increase at a constant rate.
Footnote 32
These points can be succinctly captured using Figure 2, which shows how
 $1+x/\ell$
and
 $y/\ell$
grows by constant factors as changes in z drives down the marginal cost of innovation to the supplier.
The presence of the IT–labor elasticity of substitution,
 $\lambda$
, is what is distinctive about the R&D cost function R(q) when compared with traditional R&D cost functions for improving quality. What makes the presence of
 $\lambda$
sensible is the fact that IT is an automation technology, in the sense that increases in quality of IT affects its substitutability with labor, as was implicitly assumed in the production function.
Footnote 33
For such automation technologies, it is natural that the R&D difficulty in increasing quality should be connected to the technology’s ability to substitute for labor. Suppose there is an input based on another automation technology, say steam engines. Assume that the steam engine–labor elasticity of substitution is lower than the IT–labor elasticity of substitution. Then the R&D cost function above would imply that it takes less R&D investment to make a 1% increase in quality of steam engines than to make a 1% increase in quality of IT systems.
Next, I show that labor productivity and output of the whole digital sector also grows at a constant rate.
Proposition 6 Under Assumptions 2–7, labor productivity, output, and revenue of the digital sector all grow at constant rates, even as the rate of innovation in IT decreases over time.
Proof. Denote by
 $L_Y$
the total labor employed in production in the digital sector. Each digital firm employs
 $\ell$
units of labor in the manufacture of every product, hence
 $L_Y = N\ell$
. Since the output at each product line is y, aggregate output in the digital sector is
 $Y=\left(\int_{i=0}^{N}y^{\frac{\eta-1}{\eta}}di\right)^{\frac{\eta}{\eta-1}} = N^{\frac{\eta}{\eta-1}}y$
. Labor productivity in the digital sector is thus,
Footnote 34
 \begin{equation} \frac{Y}{L_Y} = \frac{N^{\frac{\eta}{\eta-1}}y}{N\ell} = N^{\frac{1}{\eta-1}}\displaystyle\frac{y}{\ell}.\end{equation}
Hence, growth rate of labor productivity for the whole digital sector depends on the rate at which labor productivity is growing at each firm, and also on the rate at which the measure of products is growing. The latter can be obtained from equation (25):
 \begin{equation} \frac{\dot{N}}{N} = \varphi (\lambda-1)\frac{q^{\lambda-1}}{1+q^{\lambda-1}} \frac{\dot{q}}{q} = \varphi\frac{g}{(2-\varphi)}.\end{equation}
where I have used
 $\frac{q^{\lambda-1}}{1+q^{\lambda-1}} \frac{\dot{q}}{q} = \frac{g}{(\lambda-1)(2-\varphi)}$
, from equation (39). Then equation (48) implies that the labor productivity for the digital sector grows at a constant rate given by:
 \begin{equation} \frac{\dot{Y/L_Y}}{Y/L_Y} = \frac{1}{\eta-1}\frac{\dot{N}}{N} + \frac{\dot{y/\ell}}{y/\ell} = \left(\frac{\varphi}{\eta-1}+\frac{\lambda}{\lambda-1}\right)\frac{g}{2-\varphi}.\end{equation}
Further, the price index P declines at a constant rate because
 $P^{1-\alpha} = N\eta F$
from the digital sector market-clearing condition in equation (20), and N grows at a constant rate from equation (49). Hence, aggregate output of the digital sector, given by
 $Y=P^{-\alpha}$
from equation (6), grows at a constant rate, as does the revenue of the digital sector, PY.
Footnote 35
Finally, I move on to characterizing how employment would behave in this environment with slowing innovation and sustained labor productivity growth.
6 Automation, labor share, and employment in the digital sector
Proposition 7 Under Assumptions 2–7, (i) IT displaces labor at a constant rate within each firm, (ii) the labor employed at each firm reduces at a constant rate, and (iii) the share of labor in production cost of each firm reduces at a constat rate.
Proof. From equation (12),
 \begin{equation}\frac{\dot{\ell}}{\ell} = \frac{\dot{y}}{y} + \lambda \frac{r^{1-\lambda}}{1+r^{1-\lambda}}\frac{\dot{r}}{r} = \frac{\dot{y}}{y} + s_x \frac{\dot{r}}{r}.\end{equation}
There are two forces acting on labor at each firm, captured by the two terms
 $\displaystyle \frac{\dot{y}}{y}$
and
 $s_x \displaystyle\frac{\dot{r}}{r}$
. The first term
 $\displaystyle\frac{\dot{y}}{y}$
is the productivity effect and captures the fact that an increase in q reduces the price of IT r, and hence the unit cost of producing each good and its price, leading the firm to sell more of the product, which in turn increases the labor used by the firm. The second term,
 $s_x \displaystyle\frac{\dot{r}}{r}$
, is the displacement effect and captures the fact that increase in q reduces the price of IT r (which is also the price of IT relative to labor), and hence firms substitute labor with IT.
-
(i) I first show that the rate at which IT displaces labor is constant, that is,
$s_x \displaystyle\frac{\dot{r}}{r}$
is constant. Substituting
$s_x=\displaystyle\frac{q^{\lambda-1}}{1+ q^{\lambda-1}}$
from equation (31) and
$r=\frac{1}{q}$
from equation (24) gives
(52)where the last equality follows from equation (39). Hence, the rate at which labor is being displaced by IT at each firm is constant, equal to
\begin{equation} s_x \frac{\dot{r}}{r} = \frac{q^{\lambda-1}}{1+ q^{\lambda-1}} \frac{\dot{q}}{q} = \frac{g}{\displaystyle (\lambda-1)(2-\varphi)},\end{equation}
$\frac{g}{\displaystyle (\lambda-1)(2-\varphi)}$
.
-
(ii) Combining the above expression for
$s_x \displaystyle\frac{\dot{r}}{r}$
with the expression for
$\frac{\dot{y}}{y}$
from equation (43), it can be seen that labor employed at each firm decreases at a constant rate given by:
(53)
\begin{equation}\frac{\dot{\ell}}{\ell} = -\frac{g}{2-\varphi}.\end{equation}
-
(iii) To show that the share of labor in total production cost also decreases at a constant rate, take logs and differentiate equation (30) with respect to time, to get,
(54)
\begin{align} \frac{\dot{s_\ell}}{s_\ell} = -(\lambda-1)\frac{q^{\lambda-1}}{1+q^{\lambda-1}}\frac{\dot{q}}{q} = -\frac{g}{2-\varphi}.\\[-20pt] \nonumber\end{align}


Although the labor employed at each firm decreases at a constant rate, the total employment in the digital sector can increase over time, as the next proposition shows.
Proposition 8 Employment in production in the digital sector increases over time if
 $\varphi > 1$
and decreases if
 $\varphi < 1$
.
Proof. The total employment in production in the digital sector is given by,
 $ L_y = N \ell $
. Hence, the growth rate of employment in the sector is
 \begin{equation} \frac{\dot{L_y}}{L_y} = \frac{\dot{N}}{N} + \frac{\dot{\ell}}{\ell} = \varphi \frac{g}{2-\varphi} - \frac{g}{2-\varphi} = (\varphi-1)\frac{g}{2-\varphi},\end{equation}
where I have used
 $\frac{\dot{N}}{N} = \varphi\frac{g}{(2-\varphi)}$
from equation (49) and
 $\frac{\dot{\ell}}{\ell}= -\frac{g}{2-\varphi}$
from equation (51). Since
 $\varphi <2$
by Assumption 4, employment in the digital sector increases if
 $\varphi > 1$
and decreases if
 $\varphi < 1$
.
The above condition is the result of the interaction between the two opposing effects on employment in the digital sector. On the one hand, employment in each product line goes down at the rate
 $\displaystyle\frac{\dot{\ell}}{\ell}$
given in equation (51), as firms replace labor with IT. On the other hand, new products that use labor are launched at each point in time, at the rate
 $\frac{\dot{N}}{N}$
given in equation (49). Total employment in production in the digital sector increases if the latter effect dominates, which happens if
 $\varphi > 1$
. From definition of
 $\varphi$
in equation (22), the condition
 $\varphi > 1$
be written as
 $\lambda < 1 + \displaystyle\frac{(\alpha-1)(\eta-1)}{\eta-\alpha}$
.
Hence, a lower IT–labor elasticity of substitution,
 $\lambda$
, and a higher price elasticity of demand for IT consumption goods,
 $\alpha$
, make it more likely that employment in the digital sector will increase. It is easy to relate these comparative static results to the working of the model. A lower
 $\lambda$
reduces the rate of displacement of labor by IT (see equation (52)). A higher
 $\alpha$
means that a given decrease in the price index P (driven by an increase in q) would lead to a larger consumer expenditure on digital goods, which in turn would increase the entry of new products, and hence increase employment.
If
 $\varphi < 1$
, then employment in the digital sector will decrease over time, but there is still a possibility that the labor retrenched in the digital sector can be absorbed into the growing IT-producing sector. I examine in the next section whether it is possible for the total employment in the digital sector and the IT sector to grow over time, even if
 $\varphi < 1$
.
Proposition 9 The total employment in production in the digital and the IT sectors will increase over time if
 $\varphi > 1$
. If
 $\varphi<1$
, then employment will decrease until labor share at each firm reaches a threshold value,
 $s_\ell^{*}$
, after which the total employment will increase. The threshold labor share value is given by:
 \begin{equation} s_\ell^{*} = \frac{\varphi h}{(1-\varphi)(1-h)}, \end{equation}
Proof. See Appendix
Note from equation (56) that if
 $\varphi > 1$
,
 $s_\ell^*$
is less than 0 and hence total production employment will always be increasing. If
 $\varphi < 1$
, total production employment first decreases as the labor share decreases, until
 $s_\ell$
reaches
 $s_\ell^*$
, and then increases as
 $s_\ell$
reduces below
 $s_\ell^*$
.The reason is straightforward. The measure of products that exist in the digital sector varies as
 $\ell^{-\varphi}$
.
Footnote 36
Hence, total employment in the digital sector,
 $N\ell$
, varies as
 $\ell^{1-\varphi}$
. Since the profit for each firm remains at F, the total production cost for each firm also stays constant at
 $(\eta-1)F$
, that is,
 $x + \ell = (\eta-1)F$
.
Footnote 37
Hence, if a firm decreases its labor usage by one unit, it must increase its purchase of IT by one unit. Since each unit of IT requires h units of labor, employment in the IT sector is proportional to
 $\ell$
. Hence for
 $\varphi <1$
, employment in the digital sector reduces in proportion to
 $\ell ^ {1-\varphi}$
, while employment in the IT sector increases in proportion to
 $\ell$
. Hence, eventually the increase in employment in the IT sector will dominate the decrease in employment in the digital sector. As can be seen from equation (56), higher values of
 $\varphi$
or h result in higher
 $s_\ell^*$
, and hence an earlier onset of increasing total employment. This is intuitive since higher
 $\varphi$
means the rate of new product creation would be higher and higher h means that the unit labor requirement for the supplier is higher.
Finally, note that any labor retrenched in the digital sector that is not absorbed in the IT sector would move into primary goods production. The primary sector is thus a passive sector of the economy, whose output is determined by the amount of labor left over after the demands of the digital and IT sectors have been met.
7 Conclusion
I presented a model of technological change in IT that is consistent with the evidence in the data that the rate of innovation in IT has been slowing down. The model showed that slowing of innovation is a likely outcome in a world where the elasticity of substitution between IT and labor is greater than 1. Slowing down of innovation, however, does not imply that labor productivity and output growth will slow down. In particular, the model shows that with some assumptions on the R&D cost, slowing innovation in IT will be accompanied by constant labor productivity and output growth in firms that use IT as well as for the whole IT using sector of the economy.
The model brings out the point that in a world where the shares of inputs in production show a systematic trend, changes in input productivities and relative input prices can have growth effects that are different from the one where the shares are stationary. In contrast to a model with fixed input shares, a decreasing rate of growth in the productivity (quality) of an input in such a world is capable of producing a constant rate of growth in labor productivity and output.
With the share of IT inputs in production showing a systematic upward trend in the data, one should be careful about extending the results from models with constant input shares to gauge the impact of IT on the economy. For example, with rising IT share in final goods production, concerns about falling employment at the firm level due to IT-enabled automation may not get a respite from a slowing down of innovation in IT, as would be the case in a model with constant input shares. However, even with sustained automation and accompanying reduction of labor at every firm, aggregate employment in the IT using sector of the economy can grow at a constant rate, aided by the demand for labor in the production of new goods and services enabled by improvements in IT.
A Appendix
A.1 Proof of Proposition 1
Proposition 1 : Under Assumptions 1 and 2, the optimal policy of the supplier is to set the limit price of
 $rq = 1$
.
Proof. The supplier will choose the limit price,
 $rq=1$
, if
 $r_m q > 1$
, where
 $r_m$
is the monopoly price that maximizes the gross profit of the supplier, that is,
 $r_m$
is the solution to the problem:
 \begin{eqnarray*} \max_{r} &\;& (rq-h)Nx \\ s.t \;\:\: x &=& \frac{1}{rq} \frac{r^{1-\lambda}}{1+r^{1-\lambda}}(\eta-1)F.\end{eqnarray*}
Substituting for x into the objective function and taking the derivative with respect to r gives the following first-order condition,
 $ r^{\lambda} - \frac{h}{q}\frac{\lambda}{\lambda-1} r^{\lambda-1} - \frac{h}{q}\frac{1}{\lambda-1} = 0$
. Let the function f(r) denote the left-hand side of the equation, that is,
 \begin{equation} f(r) \equiv r^{\lambda} - \frac{h}{q}\frac{\lambda}{\lambda-1} r^{\lambda-1} - \frac{h}{q}\frac{1}{\lambda-1},\end{equation}
so that the first-order condition becomes
 $f(r_m) = 0$
. Differentiating f(r) with respect to r gives
 $f'(r) = \lambda r^{\lambda-2} (r-\frac{h}{q})$
. Hence,
 $f'(r) > 0$
for all
 $r>\frac{h}{q}$
. Since
 $\frac{\lambda}{\lambda-1} \frac{h}{q} > \frac{h}{q}$
, it must be true that
 $f'(r) > 0$
for
 $r > \frac{\lambda}{\lambda-1}\frac{h}{q}$
. Now consider the function f(r) for
 $ r = a \frac{\lambda}{\lambda-1}\frac{h}{q}$
, for any
 $a \in [0,1]$
. From equation (58),
 \begin{equation*} f\left( a \frac{\lambda}{\lambda-1}\frac{h}{q}\right) = \left(\frac{\lambda}{\lambda-1}\frac{h}{q}\right)^\lambda a^{\lambda-1}(a-1) - \frac{h}{q}\frac{1}{\lambda-1}.\end{equation*}
Hence,
 $f\left( a \frac{\lambda}{\lambda-1}\frac{h}{q}\right) <0$
for all
 $a \in [0,1]$
, that is,
 $f(r) < 0$
for
 $r \in \left[0, \frac{\lambda}{\lambda-1}\frac{h}{q}\right]$
. Since f(r) is an increasing function for all
 $r > \frac{\lambda}{\lambda-1}\frac{h}{q}$
, and
 $ f(r) < 0$
for
 $r \in \Big[0, \frac{\lambda}{\lambda-1}\frac{h}{q}\Big]$
, then it must be that
 $r_m > \frac{\lambda}{\lambda-1}\frac{h}{q}$
if
 $f(r_m)=0$
.
Further, since
 $h> \frac{\lambda-1}{\lambda}$
by Assumption 2,
 $r_m > \frac{1}{q}$
, or
 $r_m q > 1$
. Since
 $r_m q > 1$
, the supplier will set the limit price
 $rq=1$
.
A.2 Proof of Proposition 9
Proposition 9 : Total employment in production in the digital and IT sectors will increase over time if
 $\varphi > 1$
. If
 $\varphi<1$
, then employment will decrease until labor share at each firm, s, reaches a threshold value
 $s^{*}$
, and further decreases in s will be accompanied by increases in total employment in production in the digital and IT sectors.
Proof. The total labor used in production is
 $L_y + L_s$
, where
 $L_y$
is the labor employed in the digital sector and
 $L_s$
is the labor used by the IT supplier in production. Since it takes h units of labor for the supplier to make one unit of IT input,
 $L_s = hNx$
, where x is the quantity of IT input used by each firm. From equation (11), the IT input used at each firm is
 $x = q^{\lambda-1} \ell$
. Hence,
 \begin{equation} L_y + L_s = N \ell + hNx = N\ell + hNq^{\lambda-1}\ell = N\ell(1 + hq^{\lambda-1}).\end{equation}
Using equations (12), (17), (25), and (30), q,
 $\ell$
, and N and can be expressed in terms of
 $s_\ell$
, respectively. Taking the derivative of the resulting expression with respect to s, it can be seen that there is a threshold value of s given by:
 \begin{equation} s^* = \frac{\varphi h}{(1-\varphi)(1-h)},\end{equation}
such that,
 \begin{eqnarray*} \frac{d(L_y+L_s)}{ds} &>& 0 \:if\: s > s^* \\[3pt] &=& 0 \:if\: s = s^* \\[3pt] & < & 0 \:if\: s < s^*.\end{eqnarray*}
Lemma 1 The consumption of the primary good will be nonnegative if the growth of labor force,
 $\frac{\dot{L}}{L}$
, and the initial size of the labor force L(0), satisfy the conditions:
 \begin{eqnarray} \frac{\dot{L}}{L} &\geq& \frac{\varphi}{2-\varphi}g \end{eqnarray}
 \begin{eqnarray} L(0) &\geq& \eta F\left(\frac{z(0)}{A}(1-h)(\eta-1)F\left(\eta^\alpha(\eta-1)^{1-\alpha}\right)^{-\frac{2(\eta-1)}{\eta-\alpha}}\right)^{\frac{\varphi}{2-\varphi}}\end{eqnarray}
Proof. From the consumer budget constraint equation (5), the consumption of primary good is
 $C = L + \Pi - P^{1-\alpha}$
. Hence,
 $C > L - P^{1-\alpha}$
. Since
 $P^{1-\alpha}=N\eta F$
from equation (20), it follows that
 $C > L - N\eta F$
. Therefore, as long as
 $L(0) > N(0) \eta F$
, and
 $\frac{\dot{L}}{L} \geq \frac{\dot{N}}{N}$
, it will be true that
 $C >0$
. Equation (50) gives
 $\frac{\dot{N}}{N}=\frac{\varphi}{2-\varphi}g $
. Substituting
 $R(q)=Aq^{\lambda-1}$
from Assumption 6 into the supplier first-order condition in equation (26) gives one equation in N and q. The digital market-clearing condition in equation (25) gives second equation in N and q. Solving these two equations gives the value of N(0) in terms of z(0) and leads to the second condition in the proposition.
B Data appendix
Growth of labor productivity in the Non-Farm Business Sector in the USA (1987 = 100). Source: BLS



