I. INTRODUCTION
The weathering steels such as YQ450NQR1 (Panzhihua, China) are widely used to manufacture rails, railway wheels, etc., and generally, they have lower strength and ductility compared with martensitic steels.Reference Izotov, Komkov and Filippov1 Currently, the most common way to obtain an excellent combination in high strength and well ductility is adding the microalloying elements into steels.Reference Jung, Park, Kim and Lee2–Reference Ormandy, Strangwood and Davis4 The alloying elements of interest are typically niobium, vanadium, and titanium. These elements are frequently added into steels in individual or federated way and then precipitate the nanometer-sized carbides, nitrides, or carbonitrides in the austenite or ferrite phase during cooling.Reference Speer, Michael and Hansen5–Reference Wu, Ju, Tang, Hu, Guo, Kang and Wang8 However, the addition of these alloying elements will lead generally a deterioration in hot ductility of C–Mn steels.Reference Mintz9,Reference Mejía, Salas-Reyes, Bedolla-Jacuinde, Calvo and Cabrera10 The hot cracking risk for microalloyed steels is associated with the loss of hot ductility in continuous casting, thus the hot ductility loss of microalloyed casting slabs has been received much attention.Reference Dong, Li, Long, Gui, Chen, Huang and Vitos11,Reference Mintz, Yue and Jonas12 The survey result found that hot ductility deterioration of casting slab usually occurred in the temperature range of 700–1000 °C, and this deterioration is generally associated with the precipitation of nitrides and carbonitrides in the sensitive temperature range.Reference Cho, Dong, Yang and Lee13,Reference Salas-Reyes, Mejía, Bedolla-Jacuinde, Boulaajaj, Calvo and Cabrera14 These fine precipitates can pin austenite grain boundaries and limit the ductility of the austenite matrix.Reference Pierson15 Moreover, the film-like ferrite formed along the austenite grain boundary weakens austenite grain cohesion, and these pre-existed precipitates in the ferrite thin film will accelerate the crack growth within the brittle film during casting straightening operation.Reference Ma, Wen, Tang, Yu, Li, Xu and Mei16 The current approach for hot ductility improvement is to retard the precipitation of nitrides and carbonitrides in the sensitive temperature range.Reference Muller17 However, these tiny nitrides and carbonitrides precipitated in the sensitive temperature range can effectively improve the resistance of austenite grain coarsening in the subsequent reheating process.Reference Yan, Shan and Yang18 Therefore, it is important to study the precipitation behavior of tiny precipitates during continuous casting and the dissolution behavior of tiny precipitates during the reheating process in microalloyed steels.
The studies of precipitation in continuous casting and dissolution in reheating treatments are currently focused on the microstructure analysis of the interrupted as-cast and heat-treated specimens. A set of experimental techniques are used to analyze and quantify the precipitates in quenching specimens, such as Gleeble ductility testing, scanning electron microscopy, and transmission electron microscopy (TEM) precipitation investigation, coupling with thermodynamic equilibrium computations as well as kinetic numerical modeling of commercial packages.Reference Muller17 Differential scanning calorimetry (DSC) is a powerful and rapid thermo-analytical technique, and it is widely used to research different phase transformations of steels and alloy materials.Reference Ren, Zhu, Nan and Yang19 Moreover, DSC analysis and isothermal calorimetry have been extensively applied to the study of nonferrous alloys with second phase hardening, especially aluminum-based alloys, magnesium-based alloys, and titanium-based alloys.Reference Colombo, Battaini and Airoldi20–Reference Liu, Wu, Yang, Wei, Yu, Skaret and Roven23 The heat flow signals measured by DSC can provide valuable kinetic information about the phase transformation and the phase precipitation and dissolution in the materials during a specific heating and cooling cycle.Reference Falahati, Jun, Lang, Ahmadi, Povoden-Karadeniz and Kozeschnik24 Compared to microstructure investigations after quenching, DSC has two important advantages. First, it is an effective and rapid experimental tool to measure the onset temperature and the finish temperature with high precision during phase transformation in a well-defined small sample. Second, the energy absorbed (endothermic peaks) and energy released (exothermic peaks) during the specific heating and cooling cycle are directly correlated with the phase volume fraction of precipitates and the composition of materials.Reference Liu, Wu, Yang, Wei, Yu, Skaret and Roven23,Reference Falahati, Jun, Lang, Ahmadi, Povoden-Karadeniz and Kozeschnik24 However, this well methodology is not used generally to study the precipitation and dissolution kinetics of metastable and stable second phase particles during continuous casting and reheating in microalloyed steels.
In this work, DSC was used to research and characterize the precipitation and dissolution kinetics of second phase particles in a vanadium microalloyed steel during a specific cooling and heating cycle. Moreover, the result of thermodynamic equilibrium computations using a commercial package (Thermo-Calc, Stockholm, Sweden) and TEM microstructure investigations under different quenching conditions were used to demarcate the specific phase transformation and the precipitation reaction. Meanwhile, the qualitative and quantitative descriptions about the precipitated phases were given by further DSC analysis in the studied steel, such as the onset temperature and the finish temperature of the precipitation reaction, the energy absorbed and energy released kinetics of the precipitation reaction. The reliability of further DSC analysis was also verified by comparing the previous literature studies. Furthermore, an additional goal of this study is to give a general application of DSC as an effective experimental technique for the kinetic research of phase transformation and the precipitates in microalloyed steels, just as the routine application in aluminum-based alloys, magnesium-based alloys, and titanium-based alloys.
II. EXPERIMENTAL PROCEDURES
The material used in this study was a vanadium microalloyed casting slab, which was collected from a commercial steel plant. The detailed chemical compositions of the vanadium microalloyed steel in mass fraction (wt%) are listed as follows: 0.11–0.14 C, 1.25–1.40 Mn, ≤0.02 P, ≤0.02 S, 0.30–0.50 Si, 0.15–0.25 Ni, 0.20–0.30 Cr, 0.20–0.30 Cu, 0.11–0.14 V, and 0.009–0.015 N. First, the collected casting slab was divided into some cubical specimens with the same size. Next, these cubical specimens were heated to 1350 °C with a heating rate of 10 °C/min. Then the cubical specimens were held for 60 min at 1350 °C to make the vanadium element completely dissolve into the austenite matrix. Finally, to keep alloying element supersaturate into the steel matrix, the immediately quenched specimens were obtained through the ice salt water quenching treatment. Small cylindrical specimens for DSC measurements with a height of 0.5 mm and a diameter of 4 mm were machined from the quenching specimens, and then they were polished using the standard preparation method.
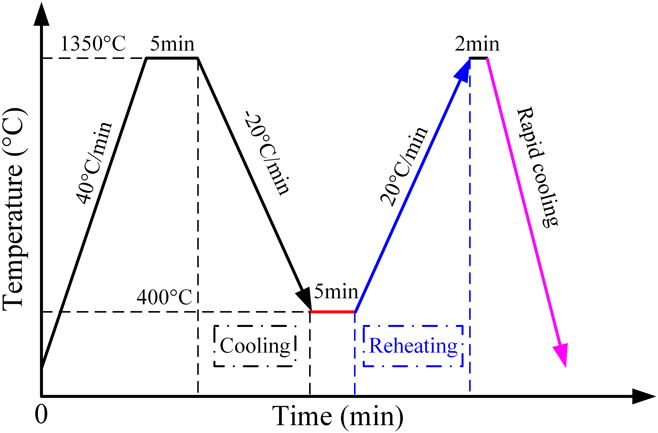
The average cooling rate of the casting slab in the secondary cooling zone is less than 30 °C/min during continuous casting.Reference Long, Dong, Chen, Zhang and Zhang25 To simulate a same thermal history as that in continuous casting, the test of precipitation caused by oversaturated vanadium was performed in a high-resolution thermal analyzer of DSC 404C (NETZSCH-Gerätebau GmbH, Selb, Germany) with a slow cooling rate of 20 °C/min. Similarly, in subsequent dissolution process of the precipitates, corresponding DSC test was carried out with the same heating rate of 20 °C/min. The detailed schematic of experimental procedures is illustrated in Fig. 1. In the first heating and cooling cycle, the DSC specimen was heated to 1350 °C from room temperature with a fixed heating rate of 40 °C/min. Then the DSC specimen was held for 5 min at 1350 °C to guarantee the temperature homogeneity. Next, the DSC specimen was cooled to 400 °C with the cooling rate of 20 °C/min. Meanwhile, the specimen was held for 5 min at 400 °C. In the second heating and cooling cycle, the DSC specimen was reheated to 1350 °C from 400 °C with the heating rate of 20 °C/min. The DSC specimen was held for 2 min at 1350 °C and then it was cooled fast to room temperature. During the experimental process, a stable argon gas flow of 50 mL/min was maintained in the chamber to prevent oxidation of the specimen. In the heating and cooling cycles, the relative heat flow change of the specimen as a function of time was recorded online. The precipitation and dissolution behaviors of fine precipitates were deduced from the difference between the signals of cooling and reheating process.
Schematic of temperature regimes for DSC tests in two set heat circles.

In the current study, to further verify the precipitation behaviors of V(CN) and VC particles, the microstructure investigations of V-precipitates were carried out using TEM. First, the precipitation experiments of V-precipitates were carried out in a resistance-heated furnace (Type: HMX-1700-30, Shanghai Haoyue Electric Technology Co., Ltd., Shanghai, China). Three initial water quenching specimens were heated to 1350 °C from room temperature with the same heating rate of 40 °C/min. Then the three specimens were held for 5 min at 1350 °C. Next, one of them (labeled as: specimen 1) was cooled to 1100 °C (equilibrium precipitation temperature of vanadium carbonitride = 1087 °C) with the cooling rate of 20 °C/min, and then it was immediately took out and water-quenched by ice salt water. Similarly, another of them (labeled as: specimen 2) was continuously cooled to 850 °C (above A e3 = 846 °C) with 20 °C/min. It was also immediately took out and then water-quenched by ice salt water. Finally, the remaining (labeled as: specimen 3) was kept in the furnace until the temperature reduced to 700 °C (above A e1 = 699 °C) with 20 °C/min; similarly, it was also immediately took out and then water-quenched by ice salt water.
The size, chemical composition, and distribution of the fine precipitates in these three specimens were investigated using conventional TEM techniques. Thin foils for TEM observation were machined into an initial thickness of about 0.5 mm. Next, these thin foils were mechanically ground to a final thickness of about 50 μm and then punched into a few 3 mm diameter disks. Subsequently, these disks were twin-jet electropolished with a mixed acid electrolyte (by volume: 5% perchloric acid and 95% ethanol) at −25 °C. Finally, the twin-jet electropolished thin foils were observed in TEM equipment (FEI TECNAL G2 F20, Amsterdam, the Netherlands) operated at 200 kV and equipped with an EDS system to identify the composition of fine precipitates.
III. THERMODYNAMIC CALCULATION
Vanadium as the microalloying element is frequently added into steels and then precipitates in austenite and ferrite phases with the nanometer-sized precipitates. These fine precipitates contribute to improve mechanical properties of steel through grain refinement and precipitation hardening.Reference Speer, Michael and Hansen5 Therefore, it is essential to study the precipitation sequence and phase transition behavior. In this study, Thermo-Calc program was used to investigate the thermodynamics of phase transformation and particle precipitation during the cooling process.
A. Thermodynamics of phase transformation
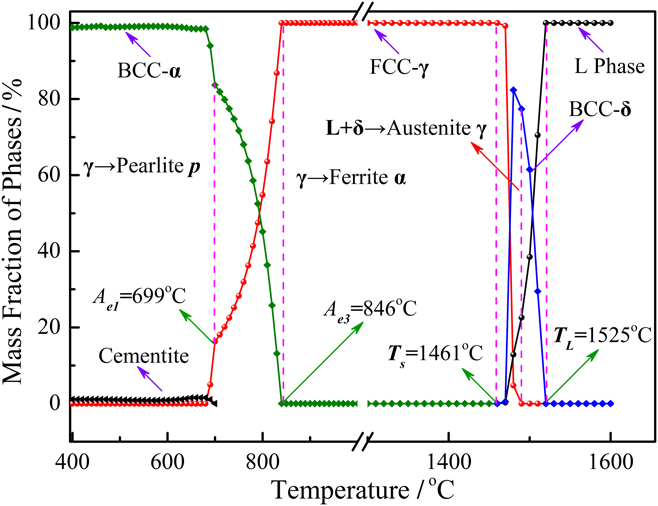
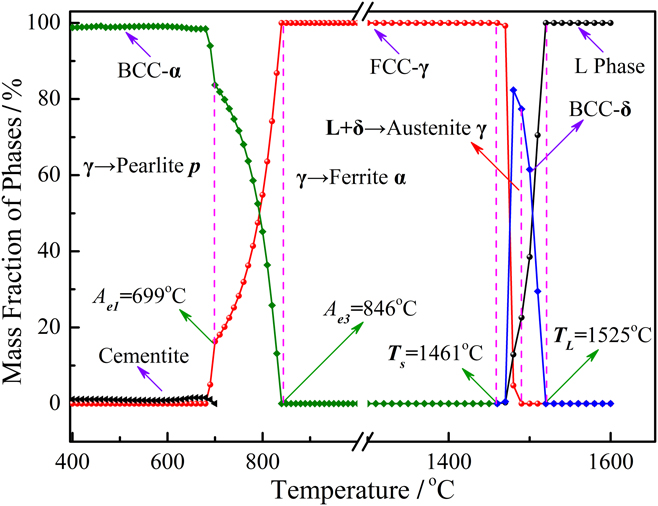
Phase equilibria calculation of the experimental steel was performed in the temperature range of 400–1600 °C. The variation of equilibrium phases and phase transformation sequence in the selected temperature range are revealed in Fig. 2. The result indicated that the liquidus temperature (T L) and solidus temperature (T S) of the experimental steel were around 1525 °C and 1461 °C, respectively. The liquid steel solidified initially with the formation of primary phase δ-ferrite, which had a body-centered cubic crystallographic structure. In the mushy zone, the peritectic reaction (L + δ → austenite γ) occurred in a narrow temperature range of 1487–1475 °C. And solidification proceeded in the three-phase region (L + δ + γ) with the formation of the γ-phase, which had a face-centered cubic crystallographic structure. As the solidification finished, δ-ferrite transformed into austenite phase and then the austenite phase remained at 846 °C with the decrease of temperature. When the temperature fell below A e3 (846 °C), austenite decomposition started. During the initial period of austenite decomposition, in general, proeutectoid ferrite formed generally. When the temperature decreased to A e1 (699 °C), cementite precipitated from the residual austenite phase, constituting the secondary transformation product-pearlite phase. Finally, the reaction of austenite decomposition finished at 672 °C. Under equilibrium cooling conditions, T L, T S, A e3, and A e1 of the experimental steel were determined to be around 1525 °C, 1461 °C, 846 °C, and 699 °C, respectively.
Equilibrium phases of vanadium microalloyed steel at different temperatures.
B. Thermodynamics of the precipitation reaction
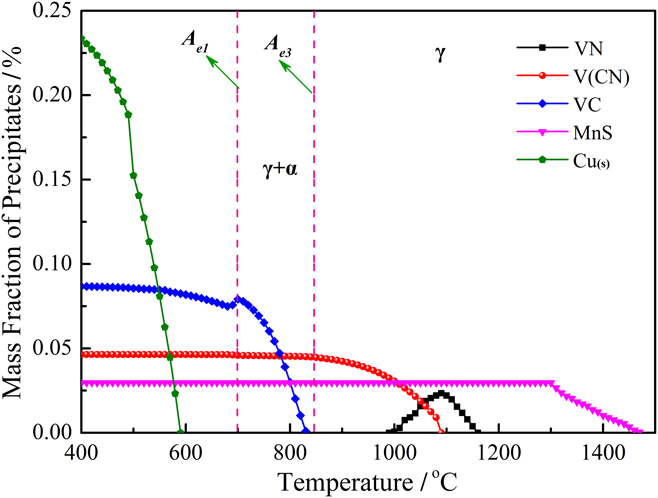
It is generally known that the redistribution of solute atoms at the front of the solid phase is relatively active because of the solubility difference between the solid phase and liquid phase during the actual solidification process. It can subsequently lead to solute element segregation and enrichment at the front of dendritic crystals. The segregation ratio of the alloying element was calculated for the given cooling rate of 20 °C/min according to the Ohnaka’s equations.Reference Ohnaka26 The calculated results showed that there was no individual contain vanadium phase form in the liquid region and mushy zone. However, MnS particles would precipitate in the mushy zone due to the effect of segregation. The results of thermodynamic calculation and segregation model calculation during continuous cooling are shown in Fig. 3. The results indicated that MnS precipitated first in the mushy zone, near the end of solidification. MnS particles started to precipitate when the temperature dropped to 1464 °C, and MnS precipitation finished at 1311 °C with a mass fraction of 0.028%. With the continuous decrease of temperature, VN particles started to precipitate from the austenite phase when the temperature dropped to 1158 °C. The mass fraction of VN initially increased and then decreased to zero with the decrease of temperature. Then the miscible carbonitrides of V(CN) started to precipitate from the austenite phase when the temperature was 1087 °C. It is indicated that the preprecipitated VN particles were metastable and may gradually transform into stable V(CN) particles. With the continuous decrease of temperature, the solubility product of the vanadium element either in the austenite or ferrite phase gradually decreased. Meanwhile, the content of the vanadium element and carbon element in the residual austenite phase is far more than the solubility in the ferrite phase. VC particles started to precipitate when the temperature dropped to 831 °C. The mass fraction of VC precipitates gradually increased from 831 °C to the eutectoid temperature A e1 of 699 °C. Under equilibrium cooling conditions, thermodynamic calculation results also indicated that copper particles Cu(s) started to precipitate at 586 °C. Finally, all the copper elements were precipitated from the iron matrix to form Cu(s). As mentioned above, the precipitation sequence in the selected vanadium microalloyed steel during continuous cooling is MnS > VN > V(CN) > VC > Cu(s).
Equilibrium precipitated phase fractions of the experimental steel during cooling.

IV. RESULTS AND ANALYSIS
A. DSC measurements during continuous cooling and reheating
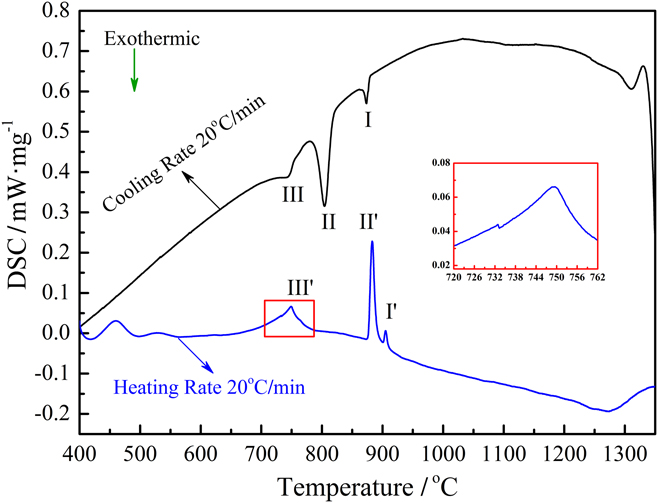
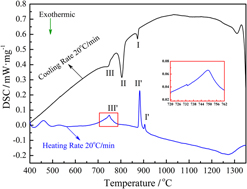
The heat flow exchange curves of experimental steel during continuous cooling with the cooling rate of 20 °C/min and reheating with the heating rate of 20 °C/min are shown in Fig. 4. It was found that there were no obvious heat flow exchanges when the temperature was below 500 °C or above 1100 °C for the cooling DSC testing and the heating DSC testing. The corresponding DSC curves showed the constant heat flux characteristics in the two temperature ranges where no phase transformation or precipitation occurred. Moreover, in the temperature range of 1100–500 °C during cooling, three obvious exothermic peaks were detected on the cooling DSC curve. The cooling DSC curve first included a weak exothermic peak at the higher temperature region indicated by (I), then a strong exothermic peak at the middle temperature region indicated by (II), and the third weak exothermic peak at the lower temperature region indicated by (III). Similarly, in the temperature range of 500–1100 °C during heating, three obvious endothermic peaks were also detected on the heating DSC curve. The heating DSC curve first included a weak endothermic peak at the lower temperature region indicated by (III′), then a strong endothermic peak at the middle temperature region indicated by (II′), and the third weak endothermic peak at the higher temperature region indicated by (I′). As the magnification of the weak endothermic peak III′ increased, it was noteworthy that there was a very weak endothermic peak on the left of the endothermic peak III′. The two overlapped peaks on the DSC curve were presented clearly due to the relatively close temperature range. Finally, three main transition stages during cooling and reheating can be identified from these two DSC curves. It was noteworthy that the start and end temperature of the three reactions were different between the cooling DSC curve and the heating DSC curve. The detailed analysis would be introduced in the following sections.
DSC curves of the experimental steel during continuous cooling and reheating.

B. Phase transformation and precipitation behavior during cooling
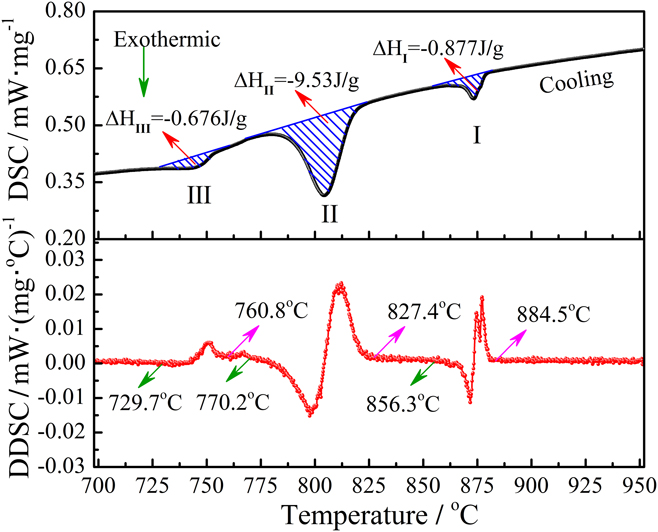
Figure 5 shows the cooling DSC curve of the experimental steel at the cooling rate of 20 °C/min, together with the markings of first derivative of the DSC curve (DDSC). In general, the peaks and transformation temperatures of the DSC curve were identified using the extrapolated method. In the extrapolated method, two tangent segments of the DSC curve are extrapolated first, and the intersect point temperature is defined as the onset temperature or the finish temperature of transformation. Compared with the onset temperature and the finish temperature extrapolated on the DSC curve, it was found that these two critical temperatures were also easier to determine on the DDSC curve. Moreover, the peak temperatures were also easier to determine from the DDSC curve and the baseline of zero. As mentioned above, in the temperature range of 1100 °C–500 °C during the cooling process, three obvious exothermic peaks were detected on the cooling DSC curve, and defined as I, II, and III, respectively. The γ → α phase transformation and second phase precipitation form austenite or ferrite phases were accompanied by relative heat release during cooling. In addition, the first deviation from the DDSC baseline was observed at the starting temperature of peak I. The onset temperature of peak I was 884.5 °C and the finish temperature of peak I was 856.3 °C. It is noteworthy that the finish temperature of peak I (856.3 °C) was higher than the temperature of A e3 (846 °C). This means that the exothermic reaction of peak I was occurred within the austenite phase. According to the results of equilibrium calculation for the precipitates, the exothermic reaction of peak I was defined as the V(CN) precipitation reaction. Meanwhile, the peak temperature of V(CN) precipitation was 873.5 °C. This is consistent with previous studies that the most precipitation rate of V (CN) particles in vanadium microalloyed steels is detected in the austenite phase at the nose tip temperature of 870 °C.Reference Yukun, Guangmin, Zhenhua and Haofei27·In general, the enthalpy of V(CN) precipitation could be expressed by the peak area of the DSC curve, and the enthalpy of V(CN) precipitation was determined to be 0.877 J/g. With the continuous decrease of temperature, another obvious peak II was observed. The onset temperature of peak II was 827.4 °C and the finish temperature of peak II was 770.2 °C. It was noteworthy that the onset temperature of peak II was lower than the temperature of A e3 (846 °C) and the finish temperature of peak II was higher than the temperature of A e1 (699 °C). The exothermic reaction of peak II was occurred in the temperature range of austenite transformation into ferrite. The exothermic reaction of peak II was defined as the reaction of austenite transformation into ferrite. The area of peak II was higher than the area of peak I, and the enthalpy of ferrite formation expressed by the peak area II was determined to be 9.53 J/g. Furthermore, the onset temperature of exothermic peak III was 760.8 °C and the finish temperature of peak III was 729.7 °C. The onset temperature of peak III and the finish temperature of peak III were both higher than the temperature of A e1 (699 °C). This means that the exothermic reaction of peak III was occurred in the coexistence phase of γ + α. According to the equilibrium calculation results of the precipitates, the exothermic reaction of peak III was defined as the reaction of VC precipitation. The enthalpy of VC expressed was determined to be 0.676 J/g. Moreover, most of the carbon element in steel reacted with vanadium and nitrogen element to form V(CN) and VC precipitates. This may cause that the secondary transformation product-pearlite was hardly measured with DSC testing, especially at the small cooling rates. As a whole, the exothermic peak type of V(CN) and VC precipitation is relatively gentle, completed in a narrow temperature range. By comparison, the peak type of γ → α transformation is relatively sharp, completed in a relatively wide temperature range.
DSC curves of the experimental steel with the cooling rates of 20 °C/min.

C. V-precipitates study by TEM
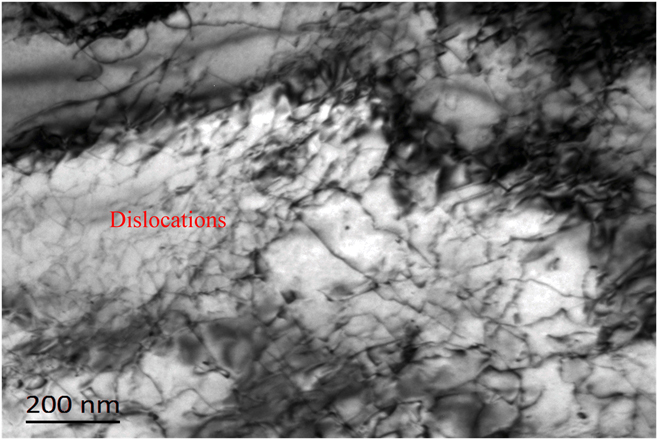
To further verify the precipitation kinetics of V-precipitates characterized by DSC, the specimens under different temperature conditions were investigated using TEM observation. The TEM micrograph of specimen 1 is given in Fig. 6. The observed result of specimen 1 (water-quenched at 1100 °C) showed that there were no V-precipitates exist in the matrix, even on the dislocations. This means that the V-precipitates were not precipitated in the matrix when the temperature was above 1100 °C in the experimental steel.
Bright-field TEM micrograph of water quenching specimen 1.

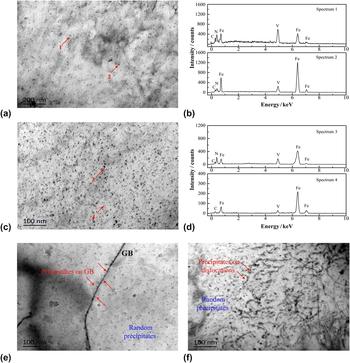
The TEM micrographs obtained from specimen 2 and specimen 3 are given in Fig. 7. The TEM observations of specimen 2 (water-quenched at 850 °C) indicated that the matrix contained very fine precipitates with particle size between 20 and 40 nm in diameter. The finely dispersed precipitates were randomly and uniformly distributed throughout the matrix, as shown in Fig. 7(a). These nanoscale precipitates were determined as V(CN) using the EDS analysis, as shown in Fig. 7(b). A higher number density and more uniform dispersion of nanoscale precipitates were observed in specimen 3 (water-quenched at 700 °C), as shown in Fig. 7(c). The striking difference between the two specimens was the existence of finer precipitates in specimen 3, the size of them were between 5 and 15 nm in diameter, such as which was indicated by the label of number 4 in Fig. 7(c). The corresponding EDS analysis confirmed vanadium enrichment in these fine precipitates, as shown in Fig. 7(d). Randomly and uniformly distributed V-precipitates were the mixture of V(CN) and VC in the matrix of specimen 3. In TEM observation, the distribution characteristic of V-precipitates was also studied, and the representative TEM micrographs are presented in Figs. 7(e) and 7(f). In this work, nanoscale V-precipitates were observed on grain boundaries, dislocations, and the matrix. Randomly distributed V-precipitates were generally existed within the grains. It was found that a significant amount of V(CN) precipitates were distributed on grain boundaries and dislocations, as marked with red arrow in Figs. 7(e) and 7(f). Furthermore, nanoscale VC precipitates were uniformly distributed in the grains and not focused on grain boundaries and dislocations. It is noteworthy that V(CN) precipitated on grain boundaries and dislocations had larger size than that precipitated in the grains. It may be attributed to lower interfacial energy and higher solute segregation on the grain boundary and dislocation. In general, V(CN) precipitates tend to precipitate along the grain boundary or dislocation in the initial stage of the precipitation reaction.
Bright-field TEM micrographs observed from thin foils with corresponding EDS analysis: (a) precipitates in specimen 2, (b) EDS analysis from indicated precipitates in specimen 2, (c) precipitates in specimen 3, (d) EDS analysis from indicated precipitates in specimen 3, (e) grain boundary precipitates in specimen 3, and (f) dislocations precipitates in specimen 3.

Compared to specimen 1, the TEM observations of specimen 2 revealed that the V(CN) primarily precipitated in the range of 1100 and 850 °C. Corresponding to the TEM study, obvious exothermic peaks were exactly detected on the cooling DSC curve in the temperature range of 1100–850 °C during cooling. Thus, the TEM observations of specimen 2 further proved that the exothermic reaction of peak I occurred within the austenite phase was the precipitation reaction of V(CN). Compared to specimen 2, the TEM observations of specimen 3 revealed that randomly distributed precipitates were frequently observed and new VC precipitates were observed in the matrix and uniformly distributed in the grains. This revealed that the VC precipitates could be precipitated in the range of 850 and 700 °C. Based on the steel composition and the thermodynamic calculation, these VC particles are likely to precipitate in the austenite decomposition process. However, no row-like VC interphase-precipitates were observed in TEM thin foils. It means that VC carbides were not nucleate at the ferrite/austenite interface. VC precipitates seem to be precipitated from the residual austenite phase in the experimental steel. Combined with TEM analysis, the exothermic peak III detected on the cooling DSC curve was defined as the precipitation reaction of VC.
D. Phase transformation and dissolution behavior during reheating
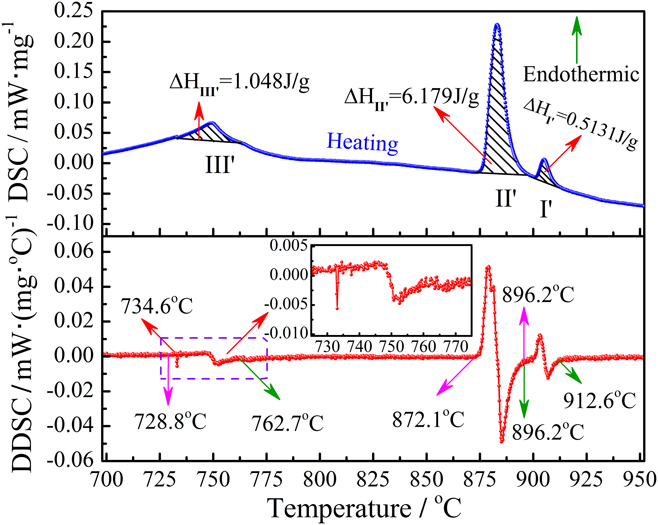
Figure 8 shows the reheating DSC curve of the experimental steel at the heating rates of 20 °C/min, together with markings of the DDSC curve. Similarly, three critical temperatures such as the onset temperature, peak temperature, and the finish temperature were determined on the DDSC curve. In the temperature range of 500 °C–1100 °C during the reheating process, three corresponding endothermic peaks were observed on the heating DSC curve and defined as III′, II′, and I′, respectively. The α → γ phase transformation and second phase particle dissolution into the matrix were generally accompanied by absorbing heat during heating. As mentioned above, as the magnification of the weak endothermic peak III′ increased, it was noteworthy that there was a very weak endothermic peak on the left of the endothermic peak III′. The onset temperature of peak III′ was 728.8 °C and the finish temperature of peak III′ was 762.7 °C. The intersect point temperature between the very weak endothermic peak and the endothermic peak III′ was 734.6 °C. Since most of the carbon element in steel reacted with vanadium and nitrogen elements to form V(CN) and VC phases, there were no obvious cementite phase form during the cooling process. It may cause that DSC cannot detect the heat flow change due to the dissolution of a shade of the cementite phase during the reheating process. Furthermore, the mass fraction of 0.23% for Cu(s) is far larger than that of the cementite phase at room temperature. As presented in previous research studies,Reference Ren, Zhu, Nan and Yang19 it was found that the heat flow change caused by dissolution of Cu(s) started at 728 °C at the heating rate of 20 °C/min and then a weak endothermic peak occurred, which is correspond to the dissolution of Cu precipitates. Thus, in the current study, the very weak endothermic peak on the left of the endothermic peak III′ was defined as the dissolution reaction of Cu precipitates. The intersect point temperature of 734.6 °C was determined to be the onset temperature of VC phase dissolution, and the finish temperature of VC phase dissolution was determined as 762.7 °C. The endothermic peak III′ was defined as the VC dissolution reaction, and the enthalpy of VC dissolution was determined to be 1.048 J/g. With the continuous increase of temperature, the onset temperature of another obvious sharp endothermic peak II′ was 872.1 °C and the finish temperature of peak II′ was 896.2 °C. The endothermic reaction of peak II′ was defined as the reaction of ferrite transformation into austenite. The enthalpy of austenite formation expressed by the peak area II′ was determined to be 6.179 J/g. Furthermore, the onset temperature of another small endothermic peak I′ near the peak II′ was 896.2 °C and the finish temperature of peak I′ was 912.6 °C. The endothermic peak I′ was defined as V(CN) dissolution. The enthalpy of V(CN) dissolution was determined to be 0.5123 J/g.
DSC curves of the experimental steel with the heating rates of 20 °C/min.

To further investigate the difference of reaction kinetics between the cooling process and reheating process, the temperature intervals of each reaction occurred in the cooling process and heating process were compared in this work. During continuous cooling process, the temperature intervals of V(CN) particle precipitation, γ → α transformation, and VC particles precipitation were determined to be around 28.2 °C, 57.2 °C, and 31.1 °C, respectively. During continuous reheating process, the temperature intervals of VC particle dissolution, α → γ transformation, and V(CN) particle dissolution were determined to be around 28.1 °C, 24.1 °C, and 16.4 °C, respectively. Compared to the temperature intervals of reactions for the cooling process, an obvious decrease both in the temperature intervals of corresponding reverse reactions was observed in the reheating process. It also indicated that all temperature intervals of reactions during the cooling process was obviously greater than these temperature intervals of corresponding reverse reactions of cooling during the reheating process, the difference of all three temperature intervals was about 47.9 °C. This difference may have an effect on the activation energy of phase transformation and particle precipitation/dissolution during cooling and reheating. The detailed analysis would be introduced in the following sections.
E. Activation energy of phase transformation during casting and reheating
The Johnson–Mehl–Avrami–Kolmogorov (JMAK) analysis has been applied to describe the kinetics of the austenite decomposition reaction on a semi-empirical level.Reference Primig and Leitner28 In the present investigation, the JMAK equation is used to calculate the activation energy for V(CN) precipitation, γ → α phase transformation, and VC precipitation during the cooling process in the experimental steel. Similarly, the evolutions of the activation energy for VC dissolution, α → γ phase transformation, and V(CN) dissolution during the reheating process were also investigated by the modified JMAK equation. For nonisothermal kinetics of transformation process, the modified JMAK equation can be described as followsReference Ghosh and Gao29,Reference Rai, Raju, Jeyaganesh, Mohandas, Sudha and Ganesan30 :
 $$f = 1 - \exp \left( { - K_1^n \cdot {t^n}} \right)\quad ,$$
where f is the transformation fraction of each phase product; K 1 is the kinetics parameter and determined from experimental data; t is the transformation time and n is the time exponent. K 1 under the nonequilibrium state can be described by the following equation:
 $${K_1} = {K_0}\cdot\exp \left( { - {Q \over {RT}}} \right)\quad ,$$
where Q is the activation energy of the reaction, T is the absolute temperature, R is the gas constant, and K 0 is the pre-exponential factor. It is worth noting that the constants K 0 and Q need to be determined to describe the progress of the reaction at the given temperature.
Currently, the most common way for dealing with the thermally activated reactions is based on the assumption that the transformation rate during a reaction is the product of two functions, one depending solely on the temperature T and the other depending solely on the transformed fraction f.Reference Málek31,Reference Starink32 Thus, the transformation rate during a reaction can be written as follows:
 $${{{\rm{d}}f} / {{\rm{d}}t}} = {K_1}\left( T \right) \cdot F\left( f \right)\quad ,$$
where F(f) is the implicit function of initial function f from Eq. (1) and described in detail as the following expressionReference Azghandi, Ahmadabadi, Raoofian, Fazeli, Zare, Zabett and Reihani33:
 $$F\left( f \right) = n\cdot\left( {1 - f} \right)\cdot{\left[ { - {\rm{ln}}\left( {1 - f} \right)} \right]^{{{\left( {n - 1} \right)} / n}}}\quad .$$
The phase transition fraction f can also be characterized quantitatively by measuring the area of the corresponding phase transformation peak, and it generally carried out on the DSC curve. Therefore, the phase fraction of the new formation phase at any given temperature T can be effective expressed as follows:
 $$f = {{S\left( T \right)} \over {{S_{{\rm{peak}}}}}} = {{\int_{{A_{{\rm{right}}}}}^{T\left( t \right)} {{y_{{\rm{DSC}}}}{\rm{d}}T} } \over {\int_{{A_{{\rm{right}}}}}^{{A_{{\rm{left}}}}} {{y_{{\rm{DSC}}}}{\rm{d}}T} }}\quad ,$$
where S(T) is the peak area between the baseline and the reaction peak at the given temperature T and S peak is the entire area between the baseline and the reaction peak on the DSC curve. These area measurements were carried out using a commercial program of Origin software (San Clemente, California). Relative peak regions were linearized for baseline by connecting the left and right points of the interval with a straight line. In the cooling process, the right point is the start temperature of the reaction peak, and the left point is the finish temperature of the reaction peak. On the contrary, the right point is the finish temperature of the reaction peak, and the left point is the start temperature of the reaction peak in the reheating process.
Meanwhile, the transformation rate during a reaction can be rewritten as follows:
 $$\left( {{{{\rm{d}}f} / {{\rm{d}}t}}} \right) = \left( {{{{\rm{d}}f} / {{\rm{d}}T}}} \right) \cdot \left( {{{{\rm{d}}T} / {{\rm{d}}t}}} \right) = \theta \cdot \left( {{{{\rm{d}}f} / {{\rm{d}}T}}} \right)\quad ,$$
where θ is the cooling rate of the cooling process or the heating rate of the reheating process.
By substituting Eqs. (2)–(5) into Eq. (6), meanwhile, a simplified formula can be achieved through a logarithmic transformation for Eq. (6), which is described by the following equation:
 $$\ln \left[ {\theta \cdot {{\left( {{{{\rm{d}}f} / {{\rm{d}}T}}} \right)} / {F\left( f \right)}}} \right] = \ln {k_0} - Q \cdot \left[ {{1 / {\left( {RT} \right)}}} \right]\quad .$$
In addition, it is necessary to determinate an initial value of n in the current study to obtain the expression of F(f). In terms of n value defined by the function of phase transformation fraction, it has higher precision and in better agreement with the experimental data than n value set respectively as 0.5, 1, and 1.5.Reference Baosheng, Qingwu, Wei, Jiaming and Yunfeng34 The expression of n can be described by the following equation:
 $$n = 1 - 0.5{f^2}\quad .$$
Then Q under the assigned n can be calculated by the linear regressions. The detailed solution equations of Q are given as follows:
 $$Q = - {{\partial \left[ {{\rm{ln}}\left( {\theta \cdot {{\left( {{{{\rm{d}}f} / {{\rm{d}}T}}} \right)} / {F\left( f \right)}}} \right)} \right]} \over {\partial \left[ {{1 / {\left( {RT} \right)}}} \right]}}\quad .$$
Finally, the activation energy Q can be obtained by the slope of ln[θ·(df/dT)/F(f)] versus 1/(RT), and k 0 can be determined by the intercept of linear regression.
1. Variation of phase transformation fraction during the cooling and reheating process
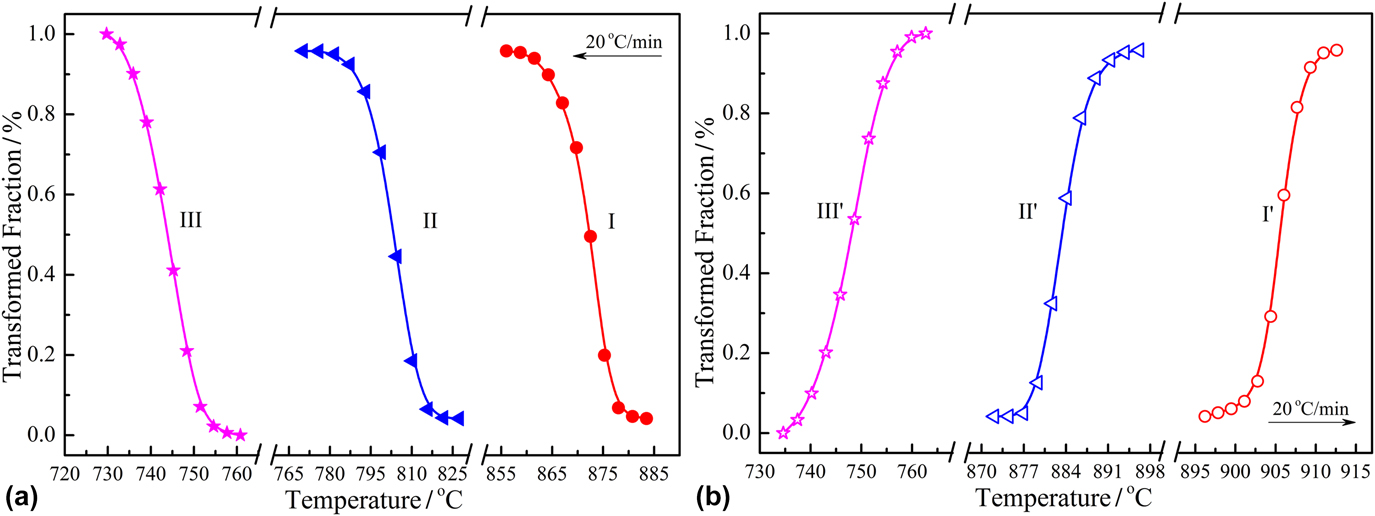
For each phase transformation either in the cooling process or reheating process, the phase transformed fraction f could be calculated by Eq. (5) based on the DSC peak curve, and the results are presented in Fig. 9. The variations of phase fractions for different formation phases during the cooling process are shown in Fig. 9(a). Meanwhile, in the reheating process, the variations of phase fractions for corresponding reverse reactions of cooling are shown in Fig. 9(b). As indicated above, the transformed fraction of each phase product was a function of temperature. As shown in Fig. 9(a), the transformed fraction of each phase product all increased with the continuous decrease of temperature in the phase reaction range. In the cooling process, the variation of phase fraction for first phase product I was associated with the V(CN) particle precipitation; the variation of phase fraction for second phase product II during cooling was associated with the transformation of austenite into ferrite (γ → α); and the variation of phase fraction for third phase product III was related to the precipitation of VC particles. There were same trends for three phase transformation curves (I, II, and III) measured from 1350 to 400 °C with the cooling rate of 20 °C/min. As shown in Fig. 9(b), the transformed fraction of each corresponding reverse reaction product of cooling all increased with the increase of temperature in the phase reaction range. In the reheating process, the variation of phase fraction for first phase product III′ was associated with the VC particle dissolution precipitation; the variation of phase fraction for second phase product II′ during reheating was associated with the transformation of ferrite into austenite (α → γ); finally the variation of phase fraction for third phase product I′ was related to the dissolution of V(CN) particles. Similarly, there were the same trends for three phase transformation curves (III′, II′, and I′) measured from 400 to 1350 °C with the heating rate of 20 °C/min.
Variations of transformed fraction of various phases with temperature: (a) during cooling and (b) during reheating.

2. Activation energy of each phase reaction during the cooling and reheating process
In this work, the activation energy Q of each reaction product and corresponding reverse reaction product was calculated by linear regression Eq. (9), and the detailed results are presented in Fig. 10. Figure 10(a) shows the scatter points and fitting line of ln[θ·(df/dT)/F(f)] versus 1/(RT) for the three exothermic peaks during cooling. Figure 10(b) shows the scatter points and fitting line of ln[θ·(df/dT)/F(f)] versus 1/(RT) for the three endothermic peaks during reheating. Furthermore, the correlation coefficients R 2 of the linear regression, together with the activation energy Q of the each peak are also marked in Figs. 10(a) and 10(b). As shown in Fig. 10(a), in the cooling process of the experimental steel, the activation energy of V(CN) precipitation (Q I) of reaction stage I was determined to be 311.2 kJ/mol. The activation energy of austenite transformation into ferrite (Q II) of reaction stage II was determined to be 147.6 kJ/mol. The activation energy of VC precipitation (Q III) of reaction stage III was determined to be 167.6 kJ/mol. The activation energy value Q II of austenite transformation into ferrite (γ → α) was in good agreement with the value reported in previous literature studies, and the activation energy Q of γ → α transformation in steel is in general about 100–200 kJ/mol.Reference Hillert and Höglund35,Reference Liu, Wang, Sommer and Mittemeijer36 The diffusion activation energy of vanadium atoms in the austenite phase is reported as 264 kJ/mol, and the diffusion activation energy of vanadium atoms in the ferrite phase is 241 kJ/mol.Reference Yong37 It was found that the activation energy of V(CN) precipitation Q I (311.2 kJ/mol) was larger than the diffusion activation energy of the vanadium element in the austenite phase (264 kJ/mol). Meanwhile, Q I was also larger than the diffusion activation energies of carbon and nitrogen atoms in the austenite phase, values of which were 136 kJ/mol and 151 kJ/mol,Reference Yong37 respectively. This implies that the precipitation of V(CN) particles was mainly dominated by Gibbs free energy of reaction, which was mainly related to the temperature of the cooling process, rather than the diffusion behaviors of vanadium atoms, carbon atoms, and nitrogen atoms in the austenite phase. In addition, the activation energy of VC precipitation Q III (167.6 kJ/mol) was lower than the diffusion activation energy of the vanadium atom in the ferrite phase that was reported to be 241 kJ/mol.Reference Yong37 But Q III (167.6 kJ/mol) was obviously larger than the diffusion activation energy of carbon atoms in the ferrite phase that was reported to be 80 kJ/mol.Reference Yong37 In this sense, the precipitation behavior of VC particles in the experimental steel was mainly related to the diffusion of vanadium atoms in the ferrite phase. As shown in Fig. 10(b), in the reheating process of the experimental steel, the activation energy of VC dissolution (Q III′) of reaction stage III′ was determined to be 255.4 kJ/mol. The activation energy of ferrite transformation into austenite (Q II′) of reaction stage II′ was determined to be 308.1 kJ/mol. The activation energy of V(CN) dissolution (Q I′) of reaction stage I′ was determined to be 592.6 kJ/mol. The activation energy of ferrite transformation into austenite (308.1 kJ/mol) was obviously larger than the activation energy of austenite transformation into ferrite that was measured to be 147.6 kJ/mol. This is consistent with previous studies.Reference Hillert and Höglund35,Reference Liu, Wang, Sommer and Mittemeijer36 Similarly, the activation energy of VC dissolution Q III′ (255.4 kJ/mol) and the activation energy of V(CN) dissolution Q I′ (592.6 kJ/mol) were also obviously larger than the activation energy of VC precipitation Q III and the activation energy of V(CN) precipitation Q I that were measured to be 167.6 kJ/mol and 311.2 kJ/mol, respectively. In general, the activation energy of the phase reaction during reheating was larger than the activation energy of the phase reaction during cooling in the experimental steel. The obtained activation energies of VC and V(CN) dissolution were both higher than that of VC and V(CN) precipitation in the experimental steel. This indicates that the dissolution of second phase particles requires more energy to support its occurrence. In addition, the obtained activation energies of V(CN) precipitation and V(C,N) dissolution were both higher than that of VC precipitation and VC dissolution in the experimental steel. Similarly, compared to VC, V(CN) particles require more energy to support their precipitation/dissolution. Meanwhile, DSC can act as a generally experimental technique for the determination of critical temperatures (start temperature, peak temperature, and finish temperature) of the phase reaction and for the calculation of activation energy of phase transformation in vanadium microalloyed steel, just as the routine application in aluminum-based alloys, magnesium-based alloys, and titanium-based alloys.
Determination of activation energy for various exothermic/endothermic peaks: (a) during cooling and (b) during reheating.

V. SUMMARY
(1) In vanadium microalloying YQ450NQR1 steel, DSC can act as an effective experimental technique to clearly detect the precipitation/dissolution behaviors of second phase particles during the cooling/reheating process. DSC can also highlight the process and sequence of precipitation and dissolution for second phase particles.
(2) In the continuous cooling process, two obvious precipitation stages and a ferrite formation stage were clearly identified in the experimental steel by DSC analysis: (i) the first stage—V(CN) precipitation, in the temperature range of 884.5–856.3 °C; (ii) the second stage—austenite transformation into ferrite, in the temperature range of 827.4–770.2 °C; and (iii) the third stage—VC precipitation, in the temperature range of 760.8–729.7 °C.
(3) In the reheating process, similarly, two obvious dissolution stages and a austenite formation stage were clearly identified in the experimental steel by DSC analysis: (i) the first stage—VC dissolution, in the temperature range of 734.6–762.7 °C; (ii) the second stage—ferrite transformation into austenite, in the temperature range of 872.1–896.2 °C; and (iii) the third stage—V(CN) dissolution, in the temperature range of 896.2–912.6 °C.
(4) There were same trends for three phase transformation curves measured from 1350–400 °C or 400–1350 °C with the cooling/heating rate of 20 °C/min. In the cooling process, the phase transformed fraction of each phase product increased with the continuous decrease in temperature in the reaction temperature area. In the reheating process, the phase transformed fraction of each phase product for the reverse reaction increased with the continuous increase in temperature in the reaction temperature area.
(5) In the cooling process with a cooling rate of 20 °C/min, the activation energies for the V(CN) precipitation, γ → α transformation, and VC precipitation in the experimental steel were determined to be 311.2 kJ/mol, 147.6 kJ/mol, and 167.6 kJ/mol, respectively. In the reheating process with a heating rate of 20 °C/min, the activation energies for the VC dissolution, α → γ transformation, and V(CN) dissolution in the experimental steel were determined to be 255.4 kJ/mol, 308.1 kJ/mol, and 592.6 kJ/mol, respectively.
(6) The activation energy of the phase reaction during reheating was larger than the activation energy of the phase transformation reaction during cooling in the experimental steel. Compared to the precipitation, the dissolution of second phase particles requires more energy to support its occurrence.
ACKNOWLEDGMENTS
This work was financially supported by the Natural Science Foundation of China (NSFC, Project Nos. 51504048, 51374260, and 51611130062). The authors thank the members of Laboratory of Metallurgy and Materials, Chongqing University, for the support of this work.