INTRODUCTION
Toxoplasmosis is caused by the apicomplexan parasite, Toxoplasma gondii. Serological studies indicate Toxoplasma infection is common in humans, with seroprevalence in different countries varying widely from <10 to >60% according to socioeconomic parameters and population behaviours (Pappas et al. Reference Pappas, Roussos and Falagas2009). Transmission to humans is usually through ingestion of oocysts in contaminated food or bradyzoite-containing cysts in undercooked meat from an intermediate host. Infections are usually subclinical or associated with non-specific symptoms in healthy humans, although infections in immunocompromised individuals may progress to cerebral toxoplasmosis (Suzuki et al. Reference Suzuki, Sa, Gehman and Ochiai2011). In pregnant women, a primary infection during or immediately prior to conception may lead to congenital toxoplasmosis of the foetus leading to hydrocephaly, retinochoroiditis and other birth defects. Thus counselling of the pregnant mother is crucially dependent on accurate determination of exposure and timing of infection.
Serological testing of pregnant women for exposure to T. gondii is routinely performed in many countries. The presence of parasite-specific IgG is followed up with a test for IgM by capture enzyme-linked immunosorbent assay (ELISA) as an indicator of recent exposure and acute (‘A’) infection. A negative IgM test helps rule out A infection, whereas a positive IgM is not necessarily diagnostic of A infection as IgM is known to persist in some toxoplasmosis cases for many months (Bobic et al. Reference Bobic, Sibalic and Djurkovic-Djakovic1991; Gorgievski-Hrisoho et al. Reference Gorgievski-Hrisoho, Germann and Matter1996). In such cases, the avidity of IgG is determined by the differential binding of IgG in the absence or presence of a chaotropic agent, such as urea (Lappalainen and Hedman, Reference Lappalainen and Hedman2004). While high avidity is a good marker of chronic/IgM-persisting (‘C/M’) and chronic (‘C’) infection and helps rule out A infection, low avidity is not a good diagnostic marker of A infection (Lefevre-Pettazzoni et al. Reference Lefevre-Pettazzoni, Le Cam, Wallon and Peyron2006; Villard et al. Reference Villard, Breit, Cimon, Franck, Fricker-Hidalgo, Godineau, Houze, Paris, Pelloux, Villena and Candolfi2013). Thus, in the case of suspected A infections, additional tests are performed by an experienced reference laboratory. The sero-diagnostic algorithm is complex and requires experience to interpret (Sensini, Reference Sensini2006).
The replicative tachyzoite stage is thought to be responsible for acute infection, either from a primary exposure during pregnancy or from reactivation of dormant bradyzoites in immunocompromised individuals. Many commercially available serological tests use native parasite antigen prepared from tachyzoites, although these tests are not standardized and do not per se allow the discrimination of a current or previous exposure.
The use of recombinant proteins may help standardize tests (Pietkiewicz et al. Reference Pietkiewicz, Hiszczynska-Sawicka, Kur, Petersen, Nielsen, Stankiewicz, Andrzejewska and Myjak2004; Kotresha and Noordin, Reference Kotresha and Noordin2010; Holec-Gasior, Reference Holec-Gasior2013) and may also lead to more precise detection of A infection, particularly if tachyzoite antigens A-specific antigens are used (Gross et al. Reference Gross, Holpert and Goebel2004). Several commercial avidity assays, of which some are based on recombinant protein assays, use automated processing in order to bring standardization to the process (Petersen et al. Reference Petersen, Borobio, Guy, Liesenfeld, Meroni, Naessens, Spranzi and Thulliez2005; Fricker-Hidalgo et al. Reference Fricker-Hidalgo, Saddoux, Suchel-Jambon, Romand, Foussadier, Pelloux and Thulliez2006; Curdt et al. Reference Curdt, Praast, Sickinger, Schultess, Herold, Braun, Bernhardt, Maine, Smith, Hsu, Christ, Pucci, Hausmann and Herzogenrath2009).
In this report we aim to identify recombinant antigens that may lead to a simpler type of test to replace the current IgG, IgM and avidity tests. Three antigens recognized preferentially in A infections, and three antigens recognized preferentially in C/M infection identified here and from our previous report (Liang et al. Reference Liang, Doskaya, Juarez, Caner, Jasinskas, Tan, Hajagos, Bradley, Korkmaz, Guruz, Felgner and Davies2011), have been expressed in Escherichia coli, purified and tested in ELISAs against a well-characterized sera collection of Turkish toxoplasmosis cases and controls.
METHODS
Sera
Sera were selected from archived samples at Ege University Medical School, Department of Parasitology, Bornova/İzmir, Turkey. Standard serological assays, described below, were used to compile four well-defined groups of reference sera. Group 1 comprised 51 samples from seronegative (‘N’) controls that were IgM-negative/IgG-negative, and obtained from individuals without any history of toxoplasmosis. Group 2 comprised 33 samples from A infections. These were IgM-positive/low avidity IgG, and all were collected during an outbreak in a boarding school in Turkey thought to be linked to exposure to cat litter (Doganci et al. Reference Doganci, Tanyuksel, Araz, Besirbellioglu, Erdem, Ozoguz, Yucel and Ciftcioglu2006). Samples were collected within 1–2 weeks of the outbreak occurring, and each donor had clinical symptoms consistent with a recent infection. The T. gondii strain responsible for the outbreak is not known. Group 3 comprised 51 samples from C/M infections, which were IgM-positive/high-avidity IgG. Group 4 comprised 51 samples from C infections, which were IgM-negative/high avidity IgG. No longitudinal samples were used in this study; each sample was obtained from a different donor. All sera were collected with patient consent as approved by the Ege University Medical School Research Ethics Committee (protocol #10-10-7). Sera were shipped on dry ice to UCI for array probing and assay development without patient identifiers and were classified as exempt status by the UCI Institutional Review Board.
Serologic testing and classification of sera
Sera were classified to one of the four groups described above using standard serodiagnostic assays prior to probing against protein arrays. With the exception of the IgM capture ELISA, all assays were ‘in-house’ tests. Technical details have been described previously (Liang et al. Reference Liang, Doskaya, Juarez, Caner, Jasinskas, Tan, Hajagos, Bradley, Korkmaz, Guruz, Felgner and Davies2011). Briefly, immunofluorescence assay (IFA) was performed according to published methods (Fulton and Voller, Reference Fulton and Voller1964; Voller, Reference Voller1964; van Loon et al. Reference van Loon, van der Logt, Heessen and van der Veen1983; Guruz et al. Reference Guruz, Ok and Korkmaz1996) with modifications as described (Liang et al. Reference Liang, Doskaya, Juarez, Caner, Jasinskas, Tan, Hajagos, Bradley, Korkmaz, Guruz, Felgner and Davies2011). Slides coated with T. gondii Ankara strain tachyzoites were probed with serial dilutions of patient serum samples and visualized with fluorescein-conjugated anti-human IgG (Biomerieux, France) followed by fluorescence microscopy. Samples able to detect parasites at dilutions below 1/16 were considered IgG-positive. IgG ELISAs were performed according to published methods (Engvall and Perlmann, Reference Engvall and Perlmann1971; Voller et al. Reference Voller, Bidwell, Bartlett, Fleck, Perkins and Oladehin1976; Payne et al. Reference Payne, Joynson, Balfour, Harford, Fleck, Mythen and Saunders1987; Francis et al. Reference Francis, Payne and Joynson1988; Guruz et al. Reference Guruz, Ok and Korkmaz1996) with modifications as described (Liang et al. Reference Liang, Doskaya, Juarez, Caner, Jasinskas, Tan, Hajagos, Bradley, Korkmaz, Guruz, Felgner and Davies2011). Microtiter plates coated with an antigen suspension derived from T. gondii Ankara strain tachyzoites were probed with patient serum samples (1:256 in casein buffer) and detected using peroxidase-conjugated recombinant protein G followed by TMB (3,3′,5,5′-tetramethylbenzidine) developer. Samples were considered positive if the OD450 nm>mean + 7s.d. of the N population. IgM was assayed using an IgM capture ELISA kit (Radim, Italy) according to the manufacturer's instructions, as described (Liang et al. Reference Liang, Doskaya, Juarez, Caner, Jasinskas, Tan, Hajagos, Bradley, Korkmaz, Guruz, Felgner and Davies2011). IgG avidity was determined by performing the IgG ELISA in the absence or presence of urea according to published methods (Hedman et al. Reference Hedman, Lappalainen, Seppaia and Makela1989, Reference Hedman, Lappalainen, Soderlund and Hedman1993; Joynson et al. Reference Joynson, Payne and Rawal1990) with minor modifications as described (Liang et al. Reference Liang, Doskaya, Juarez, Caner, Jasinskas, Tan, Hajagos, Bradley, Korkmaz, Guruz, Felgner and Davies2011). An avidity index (AI) was expressed as a percentage, defined by the formula (OD450 nm with urea/OD450 nm without urea) × 100. Sera associated with early infection (<3–4 months) typically have AI <20%. Sera associated with late infection (>6 months) typically have AI >30%, whereas AI between 20 and 30% was considered equivocal and not included in the study. Serum samples with a low AI and positive by IgM capture ELISA were classified as A infection, i.e. occurring in previous 3–4 months. Samples with high AI and positive IgM were classified as C/M whereas the sera with high AI and negative IgM were classified as C infection. Diagnosis of A infections was based on both serological tests and on the fact that these were samples from an outbreak.
Protein microarrays
Bioinformatic filtering was used to down-select from >43 000 exons present in the T. gondii genome to ~2500 exons for array manufacture, as described (Liang et al. Reference Liang, Doskaya, Juarez, Caner, Jasinskas, Tan, Hajagos, Bradley, Korkmaz, Guruz, Felgner and Davies2011). The most prevalent strain of T. gondii in Turkey is type II, although type III and Africa I strains are also detected (Can et al. Reference Can, Doskaya, Ajzenberg, Ozdemir, Caner, Iz, Doskaya, Atalay, Cetinkaya, Urgen, Karacali, Un, Darde and Guruz2014; Doskaya et al. Reference Doskaya, Caner, Can, Gulce Iz, Gedik, Doskaya, Kalantari-Dehaghi and Guruz2014). A plasmid expression library was produced by amplification of individual exons from genomic DNA of the type II T. gondii strain, PRU, followed by recombination cloning into a T7 expression vector. Proteins were then expressed in the RTS-100 in vitro transcription/translation (IVTT) expression system (5 Prime Inc., Gaithersburg, MD) and printed on nitrocellulose-coated microscope slides using a Gene Machine OmniGrid Accent microarray printer (Digilabs Inc., Marlborough, MA). Each expression product incorporated polyhistidine (HIS) and haemagglutinin (HA) epitope tags engineered into the N- and C-termini of each protein, respectively. Each array included multiple control spots of IVTT reactions lacking plasmid template. Array QC was performed using antibodies against HIS and HA epitope tags, and a cut-off defined by the average + 2·5s.d. of the control IVTT spots was used to determine expression of each tag (Liang et al. Reference Liang, Doskaya, Juarez, Caner, Jasinskas, Tan, Hajagos, Bradley, Korkmaz, Guruz, Felgner and Davies2011).
ELISA using recombinant antigens
Proteins selected for further study on the basis of protein array data were expressed and purified, either as inclusion bodies as described previously (Hermanson et al. Reference Hermanson, Chun, Felgner, Tan, Pablo, Nakajima-Sasaki, Molina, Felgner, Liang and Davies2012) or on His-Bind® (Novagen/EMD Millipore, Billerica, MA) nickel-chelate columns according to the manufacturer's instructions. In each case the same T7-expression plasmids used for protein microarray fabrication production were introduced into E. coli strain BL21 Star (DE3) cells, colony selected and sequence verified. For protein expression, transformed cells were grown at 25 °C for 18–24 h in Magic Media™ (Invitrogen, Carlsbad, CA) to allow autoinduction (Studier, Reference Studier2005). Pilot expression experiments were first conducted in 1 mL cultures. Expression was evaluated by SDS PAGE and Western blot analysis using antibodies to the HIS and HA epitope tags. Master cell banks of a single clone that showed high protein expression in vivo were then deposited as glycerol stocks for scale-up production. Glycerol was added to purified proteins at a final concentration of 10% and proteins snap-frozen at −80 °C until required for use.
Recombinant protein ELISAs were performed as described (Hermanson et al. Reference Hermanson, Chun, Felgner, Tan, Pablo, Nakajima-Sasaki, Molina, Felgner, Liang and Davies2011). Briefly, plates were coated with 100 μL purified proteins in TBS at concentrations ranging from 1·5 to 12 μg mL−1, optimized empirically for each antigen first by serial dilution experiments. Primary sera were pre-incubated in casein/TBS blocking buffer (Thermo Scientific, Waltham MA) containing E. coli lysate (Antigen Discovery, Inc., Irvine, CA) at 10 mg mL−1 final concentration for 30 min prior to placing into the plates. Bound antibody was detected using goat anti-human IgG-HRP conjugate (Bethyl Laboratories, Inc., Montgomery, TX) followed by SureBlueReserve™ TMB developer (Kirkegaard and Perry Laboratories, Inc., Gaithersburg, MD). Samples were considered positive if the OD450 nm>mean + 2s.d. of the N samples.
Statistical methods
Array data were handled as described (Liang et al. Reference Liang, Doskaya, Juarez, Caner, Jasinskas, Tan, Hajagos, Bradley, Korkmaz, Guruz, Felgner and Davies2011). Briefly, analyses were performed using R (http://www.r-project.org) and graphic outputs generated in MS Excel. The variance stabilization and normalization (vsn) method was applied to the quantified array signal intensity (SI) values. An exon product was classified as seropositive on the array if the average SI of the population of interest was > average + 2·5s.d. of all IVTT control spots. To identify antigens whose recognition was significantly different between groups t-tests were applied to log-transformed data and corrected for false discovery using the Benjamini and Hochberg (BH) method (Benjamini and Hochberg, Reference Benjamini and Hochberg1995). A ratio of average SI in different infections was also used to assess discrimination between different infections. Receiver operator characteristic (ROC) analyses were performed on array data between patient groups for each antigen (or the sum OD of multiple antigens) with a varying threshold cut off. Plots of false positive vs true positive plots were made, from which areas under the curve (AUC) and maximal sensitivity and 1-specificity values were calculated for each antigen(s) using a Youden index (Schisterman et al. Reference Schisterman, Perkins, Liu and Bondell2005, Reference Schisterman, Faraggi, Reiser and Hu2008). For ELISA data, ROC analyses were performed to assess diagnostic accuracy by AUC, sensitivity and specificity, as described above.
RESULTS
Generation and characterization of protein microarray TG2
Individual exons from T. gondii were cloned from genomic DNA and displayed as expression products on protein microarrays for serum antibody screening as described previously (Liang et al. Reference Liang, Doskaya, Juarez, Caner, Jasinskas, Tan, Hajagos, Bradley, Korkmaz, Guruz, Felgner and Davies2011). Briefly, a bioinformatic filtering process was applied to the >8000 genes (>43 000 exons) encoded in the T. gondii (TGME49) genome based on predicted antigenicity. The exons were ranked by size and exons above 200 bp were cloned into a T7 expression vector by PCR and homologous recombination in ascending order of size. The plasmids were then expressed by in vitro transcription/translation (IVTT) and printed in microarrays. The first chip (‘TG1’) comprised 1357 exon products from 615 genes (Liang et al. Reference Liang, Doskaya, Juarez, Caner, Jasinskas, Tan, Hajagos, Bradley, Korkmaz, Guruz, Felgner and Davies2011). We now add to this inventory an additional 1513 exons (from 772 genes) which were expressed and arrayed on a second chip (‘TG2’) along with 51 control IVTT spots. Expression was verified using antibodies to HIS and HA epitope tags to probe the arrays, which revealed 84% HIS positive, 91% HA positive, 80% HIS/HA double-positive and 5% HIS/HA double-negative.
Infection-specific diagnostic antigens
The results of the standard IgG avidity ELISAs and IgM capture ELISAs are shown in Fig. 1A and 1B, respectively. These data were used with clinical information to help classify sera into N, A, C/M and C reference sets prior to probing against protein microarrays. A total of 33 outbreak samples that were IgM-positive/IgG-positive with IgG AI <20% were used as the A reference set. Also, 51 samples that were IgM-positive/IgG-positive with an IgG AI >30% were classified as C/M, and 51 samples that were IgM-negative/IgG-positive with an IgG AI >30% were classified as C. It is noteworthy that the average IgM signals of the C/M group was lower but more variable than A infections (mean ± s.d. 820 ± 557 and 1913 ± 327, respectively). An additional 51 samples that were IgM and IgG seronegative were classified as N.
Characterization of the toxoplasmosis reference sera collection using standard serological assays. (A) IgG ELISA with and without urea. The avidity index is calculated from (OD450 nm with urea/OD450 nm without urea) × 100. Hashed lines indicate avidity indexes of 20 and 30% which are used to define low and high avidity samples; (B) IgM capture ELISA. The samples are arranged in the same order as shown for the IgG ELISA above. Cut-off (hashed line) defined by reference sera supplied with the kit. Abbreviations: nd, not done; N, seronegative; A, acute; C/M, chronic/IgM persisting; C, chronic.

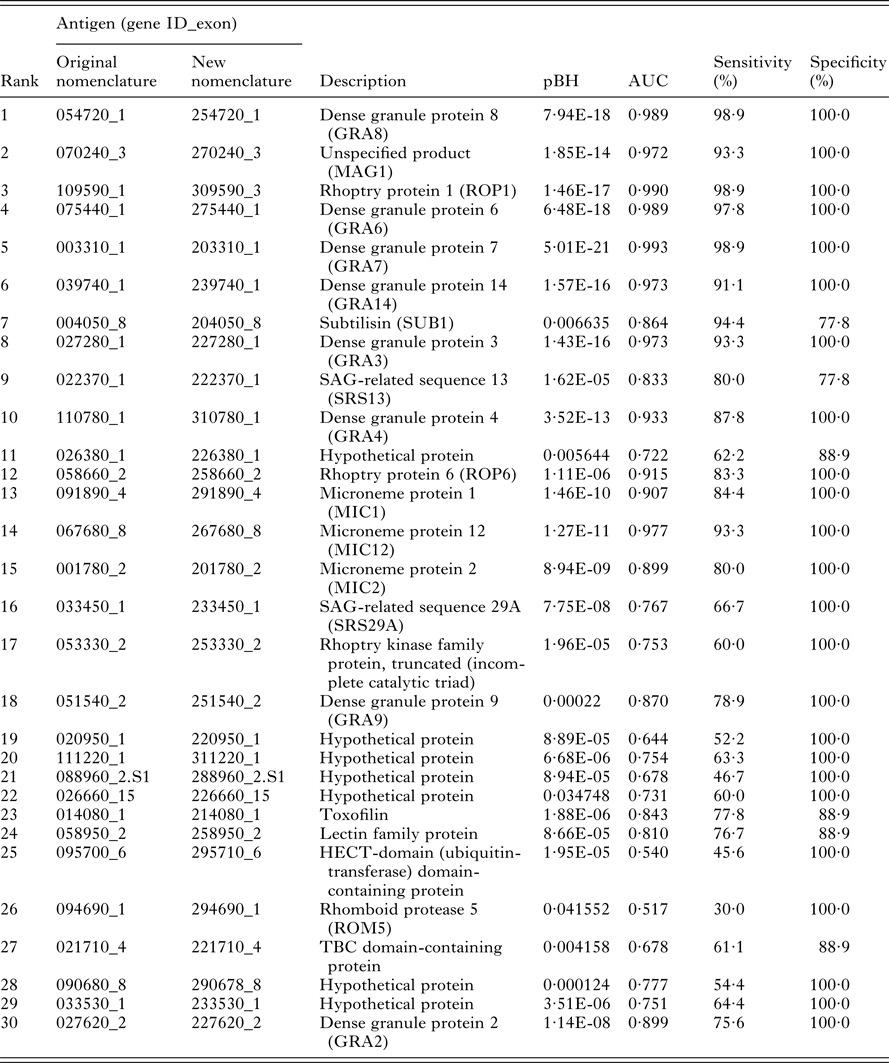
Arrays were then probed with a random subset of the sera collection, comprising 9 N, 31 A, 32 C/M and 27 C samples. The data were first analysed to identify IgG target antigens that were diagnostic of toxoplasmosis in general, regardless of type of infection. Non-reactive exon products were first identified using a cut-off for seropositivity (defined as the mean + 2·5s.d. of the IVTT control spots). T-tests were then performed on the seropositive exon products by comparing the N group with the combined A, C/M and C groups. Of 148 seropositive exon products, 66 were defined as significantly different between controls and infected populations, i.e. BH-corrected P value (pBH) < 0·05. These are listed in Fig. 2, and ranked in descending order of the average SI of the A + C/M + C population. The heat map (Fig. 2A) shows the SI for individual patients, while the bar chart (Fig. 2B) shows the average SI (+SEM) for negative and infected groups and corresponding pBH when the two groups were compared by t-test. A description of the top 30 of 66 exon products is provided in Table 1. Eight of these 30 targets (26·7%) are derived from dense granule (GRA) proteins, of which 6 were in the top quartile of the set of 66 exon products. Also represented were exon products of three microneme (MIC) proteins, two rhoptry (ROP) proteins and two surface antigen (SAG)-related proteins.
Protein microarray data for array TG2 probed with a subset of reference sera samples. The full array comprises 1513 exon products from T. gondii, probed with N, A, C/M and C sera as defined by the standard serological tests in Fig. 1. The exon products shown (listed left) are those reactive with IgG that were above a cut off defined by the average IVTT control spots +2·5s.d., and significant, i.e. BH-corrected P-values (pBH) <0·05, when the N controls and all positive sera (A + C/M + C) were compared by t-test. A total of 66 exon products were defined by these criteria. (A) Heat map showing reactivity profiles of individual patients; strongest signals are black. (B) Bar chart of corresponding average signal intensity (SI) + SE and overlaid with pBH.

Top 30 antigens that discriminate between seronegatives and T. gondii infections. Antigens are ranked by descending protein array signal intensity (see Fig. 2 for details). pBH, Benjamini–Hochberg corrected P value; AUC, area under ROC curve
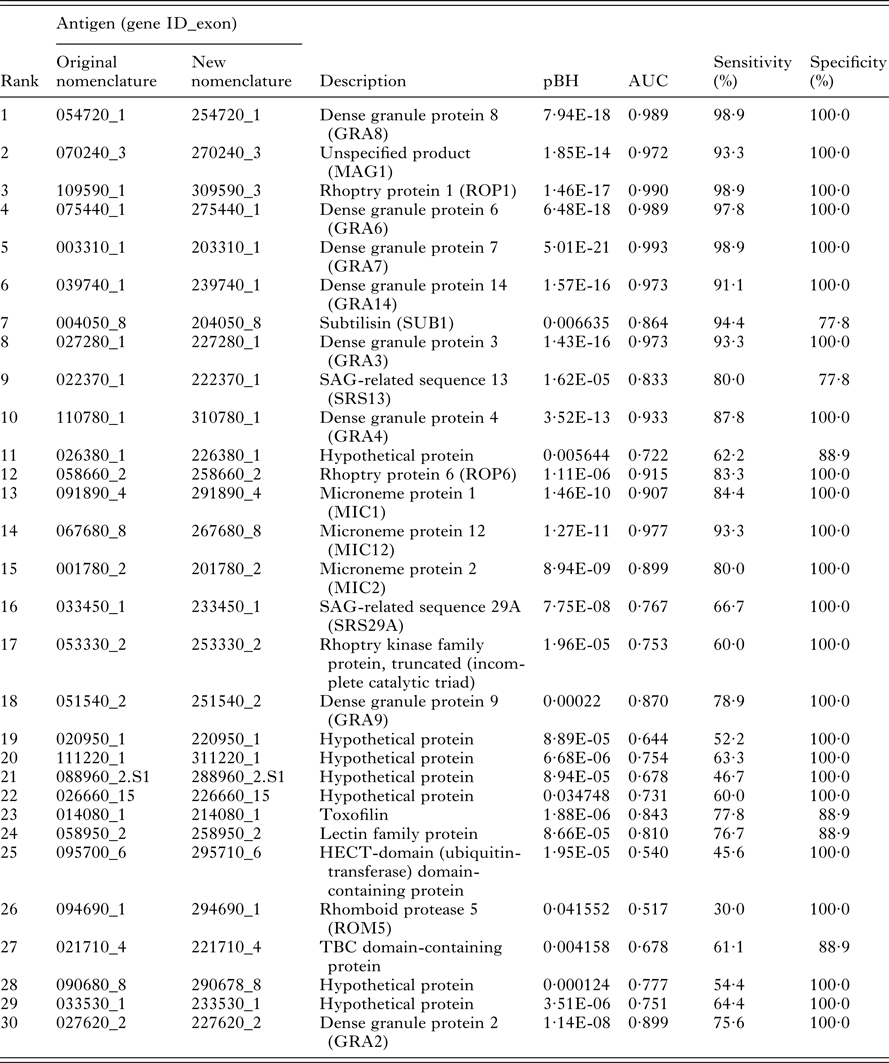
We evaluated the accuracy of diagnosing infection by comparing N with the combined A, C/M and C groups by ROC analysis. The data are shown as AUC and % sensitivity and specificity in Table 1. Although not developed further in this study, one or more of these recombinant proteins could be developed as a replacement for the whole parasite lysates or crude extracts that are currently used diagnostically for exposure to T. gondii.
Diagnostic antigens and development of ELISAs
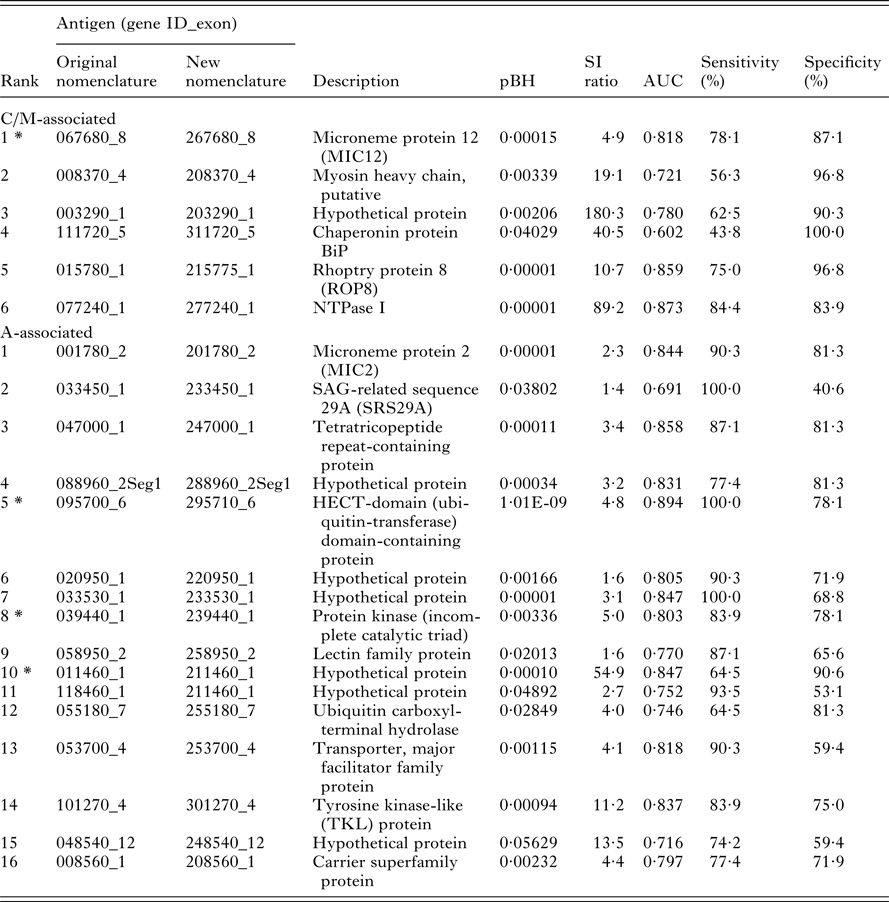
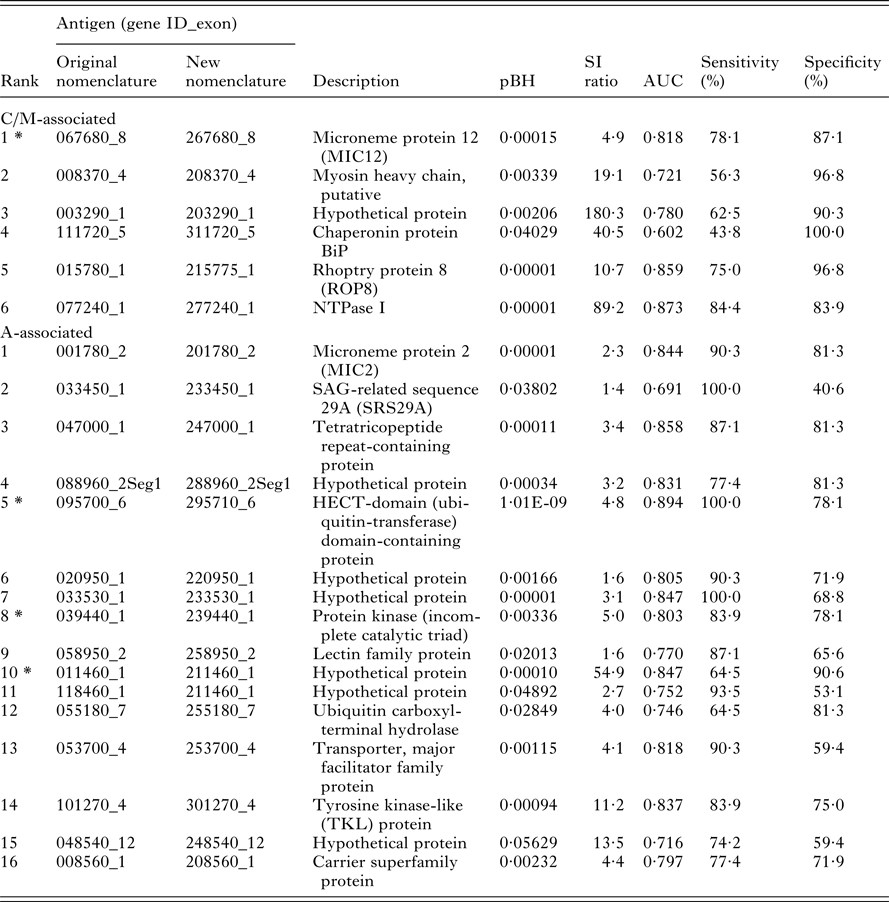
The main aim of this study was to identify IgG target antigens whose recognition was more strongly associated with different types of infection. In particular, we wished to identify candidates to help discriminate between individuals with A and C/M infections. Using the 148 seropositive exon products defined above, t-tests were performed comparing A and C/M groups for each antigen. This identified 22 exon products that were significant and therefore potentially discriminatory (Fig. 3). Of these, 6 were more strongly recognized by C/M, while 16 were more strongly recognized by A infections. This significantly advances our previous study (Liang et al. Reference Liang, Doskaya, Juarez, Caner, Jasinskas, Tan, Hajagos, Bradley, Korkmaz, Guruz, Felgner and Davies2011), in which we found exon products associated with C/M infection only. Descriptions of the 22 new targets are listed in Table 2. Of these, three A-associated exon products were selected for further study on the basis of the following criteria: average SI in A infections >15 000, pBH < 0·005 and a SI ratio (A over C/M) >4. These are indicated by ‘*’ in Fig. 3 and Table 2. These were 095700_6 (HECT-domain/ubiquitin-transferase domain-containing protein, exon 6), 039440_1 (protein kinase, incomplete catalytic triad, exon 1) and 011460_1 (hypothetical protein, exon 1). Exon product 011460_1 was selected in spite of a relatively low average SI in A infections by virtue of a very large SI C/M over A SI ratio (54·9). A fourth exon product associated with C/M infection was also purified: 067680_8 (MIC12 exon 8) based on average SI in C/M infections >15 000, P < 0·005 and C/M over A ratio >4. We also purified two additional C/M-associated exon products, 086450_1 (GRA-5, exon 1) and 070250_2 (GRA-1, exon 2) that had been revealed by the TG1 array reported previously (Liang et al. Reference Liang, Doskaya, Juarez, Caner, Jasinskas, Tan, Hajagos, Bradley, Korkmaz, Guruz, Felgner and Davies2011). The six proteins were expressed in litre-scale cultures of E. coli and purified using nickel-chelate chromatography or as SDS-solubilized inclusion bodies, and tested in ELISAs against the full sera panel (n = 191 samples).
Protein microarray exon products that discriminate between A and C/M serum groups. Exon products that were significant when the A and C/M serum groups were compared by t-test. Six were C/M associated (C/M > A), and 16 were A-associated (A > C/M). (A) Heat map showing reactivity profiles of individual patients; scale as shown in Fig. 2; (B) Bar chart of corresponding average signal intensity (SI) + SE per group overlaid with pBH. Antigens selected for further study indicated by asterisk (*).

Antigens that discriminate between A and C/M T. gondii infections. Antigens are ranked by descending protein array signal intensity (see Fig. 3 for details). AUC, sensitivity and specificity refer to detection of C/M or A infections using the C/M-associated or A-associated antigens, respectively. pBH, Benjamini–Hochberg corrected P value; SI ratio, ratio of average signal intensity of (C/M)/A for the C/M-associated antigens, and A/(C/M) for the A-associated antigens; AUC, area under ROC curve; * , antigens selected for scale-up purification and analysis by ELISA
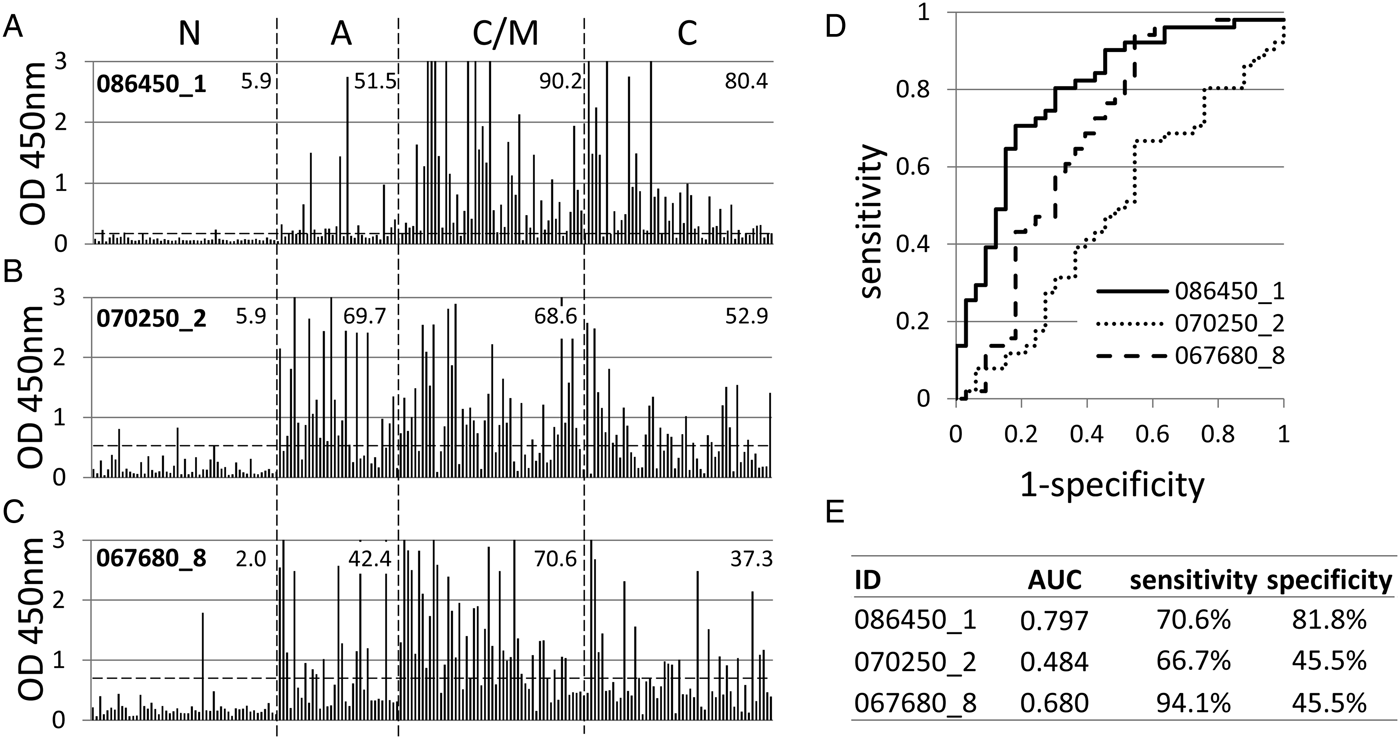
In the initial round of experiments, each antigen was tested individually to determine whether the discriminatory properties seen by array were retained after scale-up purification from E. coli. Shown in Fig. 4A–4C are ELISA data for the three C/M-associated exon products as defined by protein microarray. The samples are ordered from left to right in the figure in the same order as Fig. 1. OD450 nm values to all three antigens were lowest in the 51 N controls as expected, although one to three of these donors had values above the cut-off, depending on antigen. Consistent with the array data, recognition of 086450_1 (GRA-5, exon 1) and 067680_8 (MIC12, exon 8) was skewed towards C/M infection (90·2 and 70·6%, respectively) compared to A infection (51·5 and 42·4%, respectively). Recognition of 086450_1 remains high in C infections (80·4%) while recognition of 067680_8 is noticeably lower in C (37·3%). In contrast, 070250_2 (GRA-1, exon 2) showed no discriminatory properties (recognized by 69·7% of A and 68·6% of C/M) despite showing some, albeit modest, discrimination by protein microarray (Liang et al. Reference Liang, Doskaya, Juarez, Caner, Jasinskas, Tan, Hajagos, Bradley, Korkmaz, Guruz, Felgner and Davies2011). This antigen was also recognized in 52·9% of C infections.
IgG ELISA analysis of three candidate C/M-associated antigens. (A–C) raw ELISA data for 191 reference sera, defined in Fig. 1, probed against 086450_1, 070250_2 and 067680_8, respectively. Hashed lines, cut-off based on average + 2s.d. of the N controls. Values shown in each patient group are % samples above the cut-off. Antigens 086450_1 and 070250_2 were identified previously by array TG1 (Liang et al. Reference Liang, Doskaya, Juarez, Caner, Jasinskas, Tan, Hajagos, Bradley, Korkmaz, Guruz, Felgner and Davies2011), while 067680_8 was identified in the present study. Candidates were expressed in E. coli from the same expression plasmids used for the protein arrays, and proteins purified. (D) ROC curves for each antigen comparing A (negatives) with C/M (positives) infections. (E) AUC and % sensitivity/specificity for the ROC curves.

Since distinguishing between A and C/M toxoplasmosis is the most problematic using standard serological assays, we focused on identification of individual antigens that could potentially discriminate these types of infections. The values shown in Fig. 4A–4C are based on a single cut-off calculated by the mean + 2s.d. of the N control population. Therefore, the accuracy of each was also evaluated by ROC. The ROC plots in Fig. 4D were derived by comparing the A and C/M groups, with each antigen tested for accuracy for diagnosing C/M infection. As seen from the raw ELISA data, 086450_1 (GRA-5, exon 1) shows the best accuracy, with 070250_2 (GRA-1, exon 2) showing the least. This is reflected by AUC and the optimal sensitivity and specificity percentages (Fig. 4E). Together these data allow us to conclude 086450_1 (GRA-5, exon 1) showed the best discrimination between A and C/M infection of the three tested. However, this antigen per se would provide little utility for diagnosing A infection as it is recognized more strongly in C/M infections.
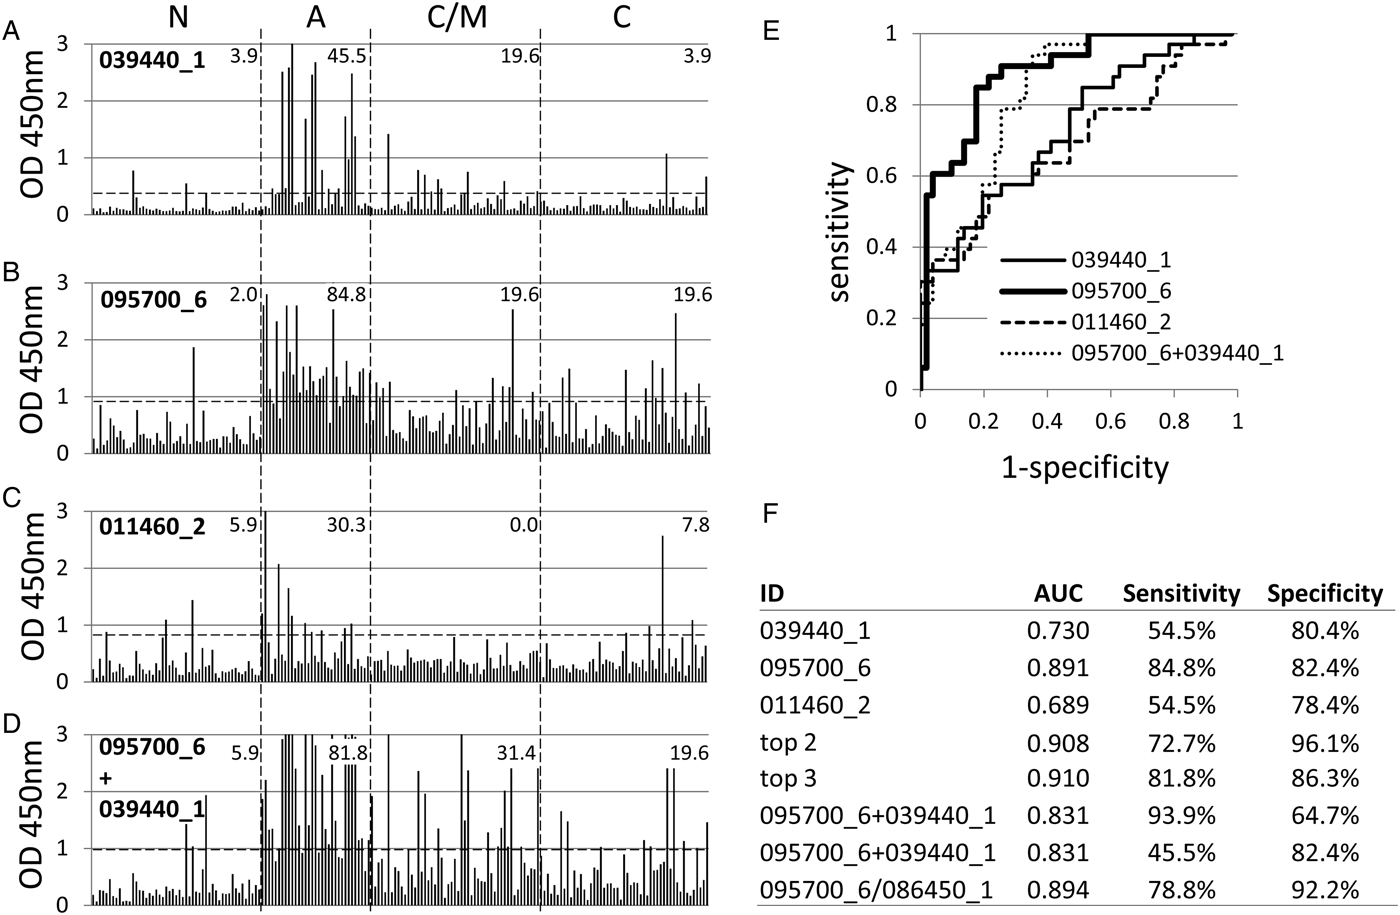
Shown in Fig. 5A–5C are the corresponding ELISA data of the three candidate A infection-associated exon products. Of these, the discriminatory behaviour of 095700_6 (HECT-domain/ubiquitin-transferase domain-containing protein, exon 6), was maintained best during the transition from array to scale-up in E. coli and ELISA. Thus, based on the single cut-off, 095700_6 showed 84·8% recognition of A infections compared to 19·6% for C/M and C infections. Exon products 039440_1 (protein kinase, incomplete catalytic triad, exon 1) and 011460_2 (hypothetical protein, exon 1) were recognized by 45·5 and 30·3% of A infections, respectively, compared to 19·6 and 0·0% of C/M and 3·9 and 7·8% of C. Recognition of all three was lowest for the N controls, with only 1–3 out of 51 individuals above the cut off. ROC analysis (Fig. 5E) revealed 095700_6 showed the highest AUC, followed by 039440_1 for discriminating between A and C/M infections.
IgG ELISA of four candidate A-associated antigens. (A–D) raw ELISA data for 191 reference sera, defined in Fig. 1, probed against 039440_1, 095700_6, 011460_2 and a mixture of 095700_6 and 039440_1, respectively. Hashed lines, cut-off based on average +2s.d. of the N controls. Values shown in each patient group are % samples above the cut-off. (E) ROC curves for each antigen comparing C/M infections (negatives) with A (positives). (F) AUC and % sensitivity/specificity for the ROC curves. ‘Top 2’ and ‘Top 3’ refer to ROC analysis using antigens combined in silico by summation (see text for details). Data for plates coated with the combination of 095700_6 and 039440_1 is shown twice; the first shows optimal % sensitivity/specificity as defined by the Youden index, while the second shows % sensitivity when % specificity is set to the same value as the % specificity for 095700_6 alone.

The effects of antigen multiplexing were then examined with the aim of improving the sensitivity and specificity of diagnosis of A infection (Fig. 5F). Summation of data in silico for 095700_6 (HECT-domain/ubiquitin-transferase domain-containing protein, exon 6) and 039440_1 (protein kinase, incomplete catalytic triad, exon 1) – designated ‘top 2’, and top 2 + 011460_1 (hypothetical protein, exon 1) – designated ‘top 3’, produced incremental improvements in AUC. This indicates an improvement in the test might be achievable by combining antigens from the same infection type. We attempted to verify this experimentally by producing ELISA plates coated with a mixture of 095700_6 and 039440_1. Using the single cut-off approach (Fig. 5D), sensitivity for A infection was not improved (84·8% for 095700_6 alone compared to 81·8% for the two-antigen combination), and specificity decreased (i.e. detection of C/M increased from 19·6 to 31·4% for the two-antigen combination). This reduction in accuracy was also reflected in the ROC analysis, with the AUC reduced from 0·891 to 0·831 (Fig. 5F). Optimal sensitivity, as determined by the Youden index, appears to increase as a result of multiplexing (Fig. 5F), although if the specificity is set at 82·4% to be comparable with the top antigen alone, sensitivity of the 2-antigen combination falls to 45·5%.
Since multiplexing antigens with others in the same infection group failed to improve accuracy, we tested whether we could exploit the reciprocal patterns of recognition of A- and C/M-associated antigens, in particular, A-associated 095700_6 (HECT-domain/ubiquitin-transferase domain-containing protein, exon 6) and C/M-associated 086450_1 (GRA-5, exon 1) (Figs 4A and 5B, respectively). Predictably, when these two antigens were combined and used to coat ELISA plates in vitro, specificity for A and C/M infections was cancelled out (not shown). However, ROC analysis of the ratio of 095700_6/086450_1 (Fig. 5F) showed a very slight improvement in AUC and specificity of diagnosis of A infection compared to 095700_6 alone, although sensitivity was reduced.
DISCUSSION
In this study, we have extended our original observations (Liang et al. Reference Liang, Doskaya, Juarez, Caner, Jasinskas, Tan, Hajagos, Bradley, Korkmaz, Guruz, Felgner and Davies2011) on the use of protein microarrays for identifying serodiagnostic antigens in toxoplasmosis. In this new study we have identified over 60 additional exon products that are recognized by IgG in toxoplasmosis sera compared to seronegative individuals. Of the top 30 (Table 1), GRA proteins are enriched (n = 8/30). Also represented among the top 30 were three MIC proteins, two ROP proteins and two SAG-associated proteins, although SAGs themselves appear under-represented among the antigens identified by the array. A large group (n = 8) of serologically reactive proteins were unannotated and whose functions are currently unknown. These results add to a growing body of data that support the development of recombinant proteins as an alternative to parasite lysates for serodiagnosis (Pietkiewicz et al. Reference Pietkiewicz, Hiszczynska-Sawicka, Kur, Petersen, Nielsen, Stankiewicz, Andrzejewska and Myjak2004; Kotresha and Noordin, Reference Kotresha and Noordin2010; Holec-Gasior, Reference Holec-Gasior2013). These studies consistently show GRA, ROP and SAG antigens in particular are often seen to be serologically reactive. Although not pursued further here, any one or more of these broad T. gondii infection-associated antigens could be selected for further study as a replacement for existing lysate-based tests.
A particular aim of our protein microarray approach throughout has been to seek antigens that might be used to diagnose A infections, without relying on a complex algorithm composed of IgM capture assays and IgG avidity. The hypothesis behind this antigen-based approach is there are antibody responses that differ between A and C stages of T. gondii infection. These might arise, for example, from antigens that are exposed to the immune system at different times during infection or parasite life cycle, or by virtue of antibodies that might appear and decay rapidly. Several such candidate antigens were identified by array (see Fig. 3) from which a number were successfully purified in sufficient quantity for analysis by ELISA. Two C/M-associated antigens identified in the first study (Liang et al. Reference Liang, Doskaya, Juarez, Caner, Jasinskas, Tan, Hajagos, Bradley, Korkmaz, Guruz, Felgner and Davies2011), and one C/M-associated antigen and three A-associated antigens identified in the present study, have been tested in this way. Not unexpectedly, some that showed promise as discriminatory showed poor specificity when expression was scaled-up in E. coli and the antigens purified. Overall, however, the serological ‘behaviour’ seen by array was preserved when the antigen was purified and tested by ELISA. Our lead A-specific-antigen was encoded by exon 6 of HECT-domain (ubiquitin-transferase) domain-containing protein (originally TGME49_095700, revised as TGME49_295710), whereas the lead C/M-specific antigen was exon 1 of the dense granule protein GRA5 (originally TGME49_086450, revised as TGME49_286450). Neither is a perfect classifier, and attempts to use two (or more) antigens, either additively or by ratios failed to significantly improve the performance of individual antigens. However, these approaches, particularly of using ratios of reciprocal infection type-associated antigens, may improve the diagnostic utility of other antigens yet to be investigated. It is also important to recognize that the origin of the genomic DNA used to produce the recombinant antigens used herein may influence the sensitivity and specificity of antibody assays using sera exposed to different strains of T. gondi. The exons used to develop the ELISAs here were obtained from the type II strain, PRU. There are a variety of T. gondii genotypes in circulation in Turkey. The prevalent strains are type II, while type III and Africa type I strains are also detected (Doskaya et al. Reference Doskaya, Caner, Ajzenberg, Degirmenci, Darde, Can, Erdogan, Korkmaz, Uner, Gungor, Altintas and Guruz2013; Can et al. Reference Can, Doskaya, Ajzenberg, Ozdemir, Caner, Iz, Doskaya, Atalay, Cetinkaya, Urgen, Karacali, Un, Darde and Guruz2014). Antibodies to these heterologous strains may differ in their reactivity to type II-derived assay antigens. In our previous protein array study, we also identified exon 2 of GRA1 (070250_2) as a candidate C/M-associated antigen (Liang et al. Reference Liang, Doskaya, Juarez, Caner, Jasinskas, Tan, Hajagos, Bradley, Korkmaz, Guruz, Felgner and Davies2011). Unexpectedly, purified 070250_2 was not strongly-infection type specific in ELISA (Fig. 4B), being detected in all three types of infection (69·7% of A, 68·6% of C/M and 52·9% of C infections). However, the OD450 nm-values (which correlate with antibody titre) show a clear downward trend after acute illness, with average OD450 nm of 1·242, 1·101, 0·704 and 0·186 for A, C/M, C and N infections, respectively. This suggests anti-GRA1 IgG antibodies reach peak values in the A infections and then decrease during the course of chronic illness (decreases in ELISA OD450 nm were also seen against the A-associated 095700_6, 039440_1 and 011460_1, as shown in Fig. 5). The decline in GRA1 antibodies is of particular interest as it is consistent with published kinetics seen in mice infected orally with bradyzoites or oocysts (Doskaya et al. Reference Doskaya, Caner, Can, Gulce Iz, Gedik, Doskaya, Kalantari-Dehaghi and Guruz2014). In this study, anti-GRA1 IgG antibodies appeared on day 10, peaked at day 40 and declined thereafter. Similar results were obtained by Gatkowska et al. (Reference Gatkowska, Hiszczynska-Sawicka, Kur, Holec and Dlugonska2006) also in mice. In one human study (Ferrandiz et al. Reference Ferrandiz, Mercier, Wallon, Picot, Cesbron-Delauw and Peyron2004), it has been reported that 34% of sera from A infections (defined as seroconversion within the previous 3 months) reacted with GRA1. An IgG response was first detected on day 28, peaked at day 49 and decreased progressively thereafter.
The potential utility of antibodies to GRA1 as a biomarker for A T. gondii infection is consistent with its temporal expression during infection. Infection of humans is initiated by ingestion of sporozoites in oocysts or tissue cyst bradyzoites. Around 2 days after ingestion and invasion of intestinal epithelial cells, parasites transform into rapidly dividing tachyzoites which signals the onset of the A infection. Gradually, and under mounting immune pressure, tachyzoites convert into semi-dormant bradyzoites and eventually into fully dormant tissue cysts, and the A infection gives way to a chronic illness. Although GRA1 is expressed by all forms of the T. gondii parasite, it is particularly abundant in fully sporulated oocysts (Tilley et al. Reference Tilley, Fichera, Jerome, Roos and White1997; Possenti et al. Reference Possenti, Fratini, Fantozzi, Pozio, Dubey, Ponzi, Pizzi and Spano2013) and in the parasitophorous vacuoles (PVs) of tachyzoites during intracellular proliferation (Cesbron-Delauw et al. Reference Cesbron-Delauw, Guy, Torpier, Pierce, Lenzen, Cesbron, Charif, Lepage, Darcy, Lecocq and Capron1989; Cesbron-Delauw, Reference Cesbron-Delauw1994). Thereafter, expression is progressively repressed after conversion into bradyzoites (Cleary et al. Reference Cleary, Singh, Blader, Brewer and Boothroyd2002).
Although the sera used in the present study are well characterized, we did not use longitudinal samples from the same patient. It is always problematic to determine exactly when an individual first becomes exposed to Toxoplasma, but longitudinal sampling would enable a more precise analysis of the temporal dynamics of the antibody response. In the case of GRA1 for instance, a patient could be diagnosed as A infection at the time of first sampling if the titres in subsequent samples decrease. Future studies are likely to benefit from a combination of longitudinal human samples and animal models in which the time of infection with oocyts or tissue cysts can be precisely controlled.
ACKNOWLEDGEMENTS
The authors would like to thank the staff of Department of Parasitology, Ege University Medical School for their help in collecting the sera.
FINANCIAL SUPPORT
This work was supported by NIH grant AI058365 (DHD) and a Scientific Research Projects Branch Directorate of Ege University Chancellery grant 2007TIP015 (YG). DHD and PLF disclose a financial interest in Antigen Discovery Inc., which has licensed the protein microarray technology. DHD, PLF and the University of California, Irvine may financially benefit from this interest if the company is successful in marketing its products that are related to this research. The terms of this arrangement have been reviewed and approved by the University of California, Irvine, in accordance with its conflict of interest policies.