The by-product of insufficient niacin consumption, pellagra is a nutrition-related disease characterized by dermatitis, aggression, diarrhea, dementia, and in extreme and untreated cases, death. During the early 1900s, pellagra deaths were recorded in every state in the Union, but the disease was much more pronounced in the South. At the disease’s peak in 1928, there were approximately 230,000 cases of pellagra in the American South (equal to the population of Atlanta at the time) and more than 7,000 deaths annually (Bollet Reference Bollet1992). In some southern states, it was the ninth or tenth leading cause of death, and had a death rate comparable to malaria.Footnote 1 Early observers believed pellagra was contagious and unrelated to nutrition. It was only during the late 1930s that scientists established that the disease was caused by a niacin deficiency. Soon after this discovery, states throughout the country began passing laws mandating the enrichment of bread, flour, and corn products with niacin. Today the disease is largely unknown in the United States, except among homeless populations and others in extreme deprivation.
In this article, we examine the rise and fall of pellagra in the American South. We begin our analysis by exploring the long-standing claim that pellagra stemmed from the South’s cotton monoculture. In particular, widespread cotton production is thought to have displaced local production of niacin-rich foods and driven poor southern farmers and mill workers to consume milled midwestern corn, which was relatively cheap but also devoid of the niacin necessary to prevent pellagra. Previous work has sought to document the connection between cotton production and pellagra by using simple time series and cross- sectional comparisons. These correlations show that when and where cotton production was high so too was the pellagra rate (Park et al. Reference Park, Sempos and Barton2000; Goldberger, Wheeler, and Sydenstricker 1920; Rajakumar Reference Rajakumar2000). However, ascribing causality to the positive correlation between cotton production and pellagra is problematic. For example, it might conflate changes in income with changes in food availability: perhaps years of high cotton production were also years of low income, and it was the reduction in income, not the reduction in local food production, that drove the increase in pellagra.Footnote 2
To test for a causal link between cotton production and pellagra, we follow previous research and treat the arrival of the boll weevil in the cotton belt during the early 1900s as an exogenous shock that disrupted cotton production. Using a difference-in-differences estimating strategy and county-level data from North Carolina and South Carolina, we regress pellagra mortality against an indicator variable for boll weevil infestation interacted with pre-boll weevil measures of cotton production or pellagra.
Our results show that counties with high levels of either cotton production or pellagra experienced relatively large reductions in pellagra mortality following the arrival of the boll weevil. These results are robust to potential confounding factors such as malaria, urbanization, interpolation of inter-census population estimates, and changes in overall mortality. In addition, we run a series of placebo tests on death rates from other diseases and find no evidence that they fell in response to the boll weevil. These results suggest that the reductions in pellagra that followed the arrival of the boll weevil were not caused by improvements in the overall disease environment. Finally, we do not find evidence that the groups most likely afflicted with pellagra (e.g., women and children) migrated out of cotton producing counties (post-boll weevil) at higher rates than less vulnerable groups.
As further evidence, we also establish a mechanism linking the arrival of the boll weevil with reductions in pellagra. In particular, we show that the arrival of the boll weevil in cotton- producing counties prompted farmers to diversify their crop mix by planting niacin-rich foods. This, in turn, would have increased the availability of niacin to nearby populations.
Having explored cotton’s role in the rise of pellagra, we then turn to an analysis of the forces that helped bring an end to the disease in the American South. Pellagra rates dropped sharply during the 1930s and 1940s. This drop happened shortly after the discovery that pellagra was caused by niacin deficiency in 1937 and continued after the passage of state laws in the 1940s mandating that breads and grains be enriched with niacin. Historical observers have long hypothesized a causal connection between these events and concurrent reductions in pellagra. To test this claim, we use county data from North Carolina and South Carolina and a difference-in-differences estimation approach. The results suggest that improved medical understanding and state fortification laws significantly reduced pellagra related mortality.
Taken together, our results contribute to four literatures. First, the observation that malnutrition can emerge in poor agricultural societies that rely heavily on cash crops is not unique to the American South; development economists and colonial historians offer similar arguments for other parts of the world (e.g., National Academy of Sciences 1978, p. 44; Bhatia Reference Bhatia1963). Second, the American South has long lagged behind the North in economic performance. While southern states exhibited productivity growth between 1900 and 1920, it was only later in the century that incomes converged with those in the North (Mitchener and McLean Reference Mitchener and McLean2003; Wright Reference Wright1987). Common explanations for these patterns fall into one of three categories: institutional, technological, and disease-related.Footnote 3 The results here reinforce the idea that the South’s disease environment—particularly as it relates to nutrition-related diseases—is important to understanding the long-term economic evolution of the region.
Third, the literature that explores nutritional shocks primarily achieves identification by focusing on shocks that adversely affect both nutrition and income (Lumey, Stein, and Susser Reference Lumey, Stein and Susser2011). The results here complement and extend this literature. Of particular interest is our use of the boll weevil, which breaks the usual correlation between nutrition and income. Most shocks that reduce nutrition also reduce income, and it is difficult to disentangle the two effects as they are mutually reinforcing. The boll weevil, however, induced farmers to abandon a profitable crop (cotton) for less profitable crops (local food). As explained later, the shift to less profitable crops was often associated with expansions in local food supplies, which helped to improve nutrition despite the reductions in income that came with producing less profitable crops.
Finally, over the past decade, there has been revived interest in the role of the boll weevil in southern economic history. Fabian Lange, Alan Olmstead, and Paul Rhode (Reference Lange, Olmstead and Rhode2009) show that in anticipation of the arrival of the boll weevil, cotton farmers in the South increased production but once the pest arrived shifted to the production of other crops. Deirdre Bloome, James Feigenbaum, and Christopher Muller (Reference Bloome, Feigenbaum and Muller.2017) explore how the boll weevil interacted with tenancy to shape marriage patterns. Their results indicate that with the arrival of the boll weevil, tenancy fell as did the frequency of marriages at early ages among African Americans. This reversed an early pattern of rising tenancy and marriage rates among young African Americans. Philipp Ager, Markus Breuckner, and Benedikt Herz (Reference Ager, Brueckner and Herz2017) also find evidence that the boll weevil reduced the number of tenant farms, wages in agriculture, and female labor force participation in cotton producing counties. On a more positive note, Richard Baker (Reference Baker2015) shows how the arrival of the boll weevil promoted convergence in black and white school enrollment rates, as demand for child labor in cotton related tasks fell. Our results complement these findings.
HISTORICAL BACKGROUND
Pellagra is a disease caused by niacin deficiency that caused thousands of deaths in the South during the first half of the twentieth century. Pellagra is characterized by “the four D’s”: dermatitis, diarrhea, dementia, and death. Conrad Elvehjem showed definitively that pellagra was caused by inadequate niacin consumption in 1937 (Elvehjem et al. Reference Elvehjem, Madden and Strong1937). Prior to that, physicians and public health workers had a range of theories, most of which focused on pellagra being a disease of unclear origin (Mooney, Knox, and Morabia Reference Mooney, Knox and Morabia2014, Siler, Garrison, and MacNeal Reference Siler, Garrison and MacNeal1914, Reference Siler, Garrison and MacNeal1915). The dermatitis and skin discoloration associated with severe cases of pellagra facilitated a proper diagnosis.
For many, pellagra was a seasonal affliction, emerging in late spring and early summer, which is itself suggestive that access to local food supplies might matter in the propagation of the disease. In healthy populations, pellagra took about six months to develop (Goldberger, Waring, and Willets Reference Goldberger, Waring and Willets1915; Goldberger, Waring, and Tanner Reference Goldberger, Waring and Tanner1923). In cases where diets were supplemented, pellagra tended to go away within a few months. The relationship between duration of pellagra and death is not clear. Because of the distinctive symptoms of the disease in severe cases, death rates for pellagra are probably well estimated (assuming all deaths are recorded systematically).
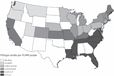
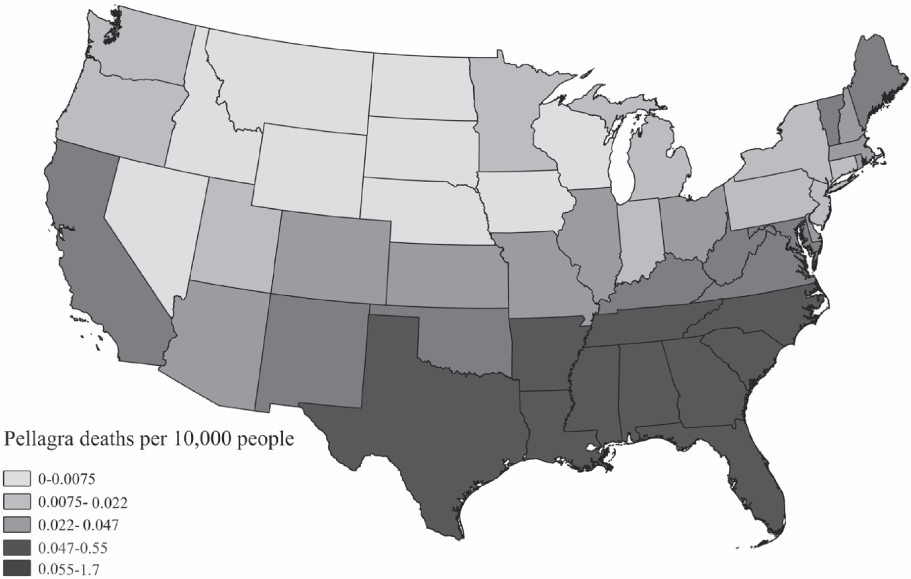
Pellagra was much more prevalent in the South than in other parts of the United States. Figure 1 shows state pellagra death rates in 1920 and in 1935. Unfortunately, southern states were not part of the U.S. death registration system until the mid-1910s, so the numbers of deaths during early twentieth century are not precisely known. What we do know is that by 1907 pellagra deaths were reported in Journal of the American Medical Association articles and by 1911 the Surgeon General of the U.S. Public Health Service expressed concerns regarding the growing prevalence of pellagra, particularly in the American South (Bollet Reference Bollet1992).Footnote 4
PANEL A: PELLAGRA DEATH RATES IN 1920

PANEL B: PELLAGRA DEATH RATES IN 1935

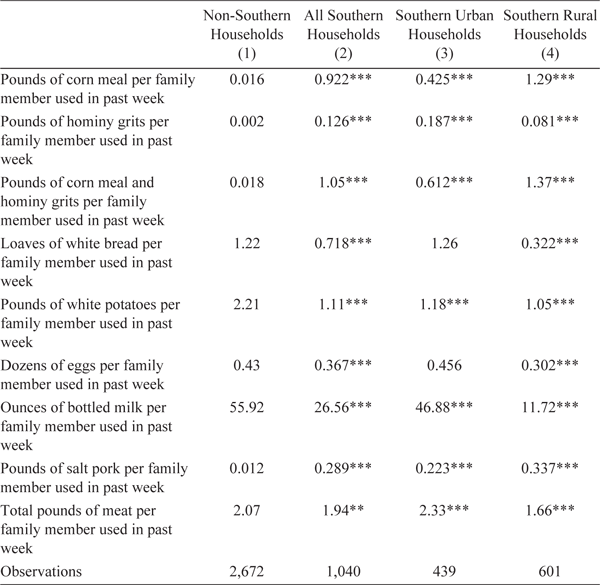
Why was pellagra more prevalent in the South? The diet for poor whites and blacks in the South consisted primarily of salt pork, molasses, and corn—foods with very little niacin. Table 1 documents the importance of corn in southern diets. This table is based on the Study of Consumer Purchases in the United States, 1935–1936, which collected data on food purchases from a large sample of households including southern households in both urban and rural areas. The table demonstrates that compared to non-southerners, southerners were eating more corn meal, more salt pork, less bread, fewer potatoes, fewer eggs, and less meat, and they were drinking less milk. In comparison to corn, wheat and potatoes have about twice as much niacin per gram (Krehl et al. Reference Krehl, De La Huerga and Elvehjem1946). Salt pork was low in niacin, relative to other types of meat. Eggs and milk have tryptophan, which can be converted to niacin in the body.
SOUTHERN DIETS 1935–1936

Source: Study of Study of Consumer Purchases in the United States, 1935–1936 accessed on ICPSR. Significant differences in column means relative to column 1 are reported.
* p<0.1, ** p<0.05, *** p<0.01
In addition to varying regionally, the number of pellagra deaths varied over time. The time series variation is clear in Figure 2, which plots pellagra deaths and cotton production in North Carolina and South Carolina over time. These data suggest that pellagra was widespread in North Carolina and South Carolina in the mid-1910s. The boll weevil first arrived in a county in South Carolina in 1917, had reached 40 percent of counties in North Carolina and South Carolina by 1920, and reached the final counties in 1922. The growth in pellagra stopped during the late 1910s at around the same time that the cotton economy stagnated with the spread of the boll weevil.
PELLAGRA AND COTTON ACREAGE IN NORTH CAROLINA AND SOUTH CAROLINA

One of the central themes of the extant literature on pellagra is that the disease stemmed directly from the South’s cotton monoculture. Cotton production crowded out local food production, leading to the importation of less healthful food. In his study of South Carolina, Walter Edgar (Reference Edgar1992) argues that a high debt burden forced many farmers to plant cotton, a cash crop with higher expected returns than other crops. Despite the population of South Carolina tripling from 1850 to 1935, the amount of food production remained about the same. As a result, South Carolina “had to import $70–$100 million worth of food annually. For poverty-stricken tenant farmers with little ready cash, this meant that there was less to eat. The consequent increased dependence on a diet of pork, cornbread, and molasses made poor Carolinians more susceptible to disease” (Edgar Reference Edgar1992, p. 47).
The importation of food into the South would tend to increase pellagra if the food being imported had lower levels of niacin than locally grown food. Indeed, historical observers often attribute the increase in pellagra to changes in the milling of Midwestern corn (e.g., Park et al. Reference Park, Sempos and Barton2000; Goldberger, Wheeler, and Sydenstricker 1920; Rajakumar Reference Rajakumar2000). Previous milling technology had removed less of the germ, retaining some niacin. The Beall degerminator, which was patented in 1900 and 1901, removed the germ. This led to a finer cornmeal with a longer shelf life, but with much less niacin and other micronutrients. Expansion of large-scale milling and movement of goods by railroad meant that this corn reached the South in increasing quantities. Alfred Bollet (Reference Bollet1992, p. 219) notes that “in the textile mill towns, surrounded by cotton fields, food was shipped in by railroad, and the cornmeal that could be purchased in the company stores was processed in the Midwest, where it had been degerminated.” In addition, a survey conducted by the Thompson-McFadden Pellagra Commission of residents in six mill towns in South Carolina revealed that almost 60 percent of residents consumed shipped cornmeal on a daily basis and only 10 percent of residents never consumed shipped cornmeal. In contrast, 12 percent of residents consumed locally produced cornmeal on a daily basis, and 80 percent of residents never consumed locally produced cornmeal (Siler Reference Siler, Garrison and MacNeal1915, pp. 21, 34).
Also relevant for our empirical analysis, Lange, Olmstead, and Rhode (Reference Lange, Olmstead and Rhode2009) present evidence that the boll weevil reduced cotton production and increased local food production. The boll weevil, a beetle that feeds on cotton leaves, squares (flower buds), and bolls, appeared in Texas in 1892; it then progressed north and east through the cotton belt. By 1922, the boll weevil had spread throughout the entire cotton region. The arrival of the weevil had a large effect on agriculture. In their analysis of the boll weevil on the South, Lange, Olmstead, and Rhode (Reference Lange, Olmstead and Rhode2009, p. 710) write: “Overall, the corn results indicate a greater movement to alternative crops than suggested in the literature, which has downplayed the boll weevil’s effects on diversification.” In a footnote, they add: “Based on the census data, we also find production of hay, Irish potatoes, peanuts, rice, and sweet potatoes; sugar cane, among other crops, showed statistically significant increases after the arrival of the weevil” (p. 710). We further examine the effect of the boll weevil on food production in North Carolina and South Carolina.
Increased production of southern corn and other crops following the arrival of the boll weevil was likely to increase niacin consumption. For corn, this could occur through increased consumption of fresh corn, the crowding out of midwestern cornmeal, or both. Southerners tended to plant and harvest sweet corn, which contained relatively high levels of niacin, while the corn varieties grown in the Midwest contained 30 to 50 percent less niacin than sweet corn (Burkholder, McVeigh, and Moyer Reference Burkholder, McVeigh and Moyer1944; Ayer Reference Ayer1895, pp. 12–13). Southerners made “stone ground” corn meal, which was neither kiln dried nor degerminated, and so preserved the niacin. Locally sourced corn could also be used to make hominy grits. If prepared correctly (in a lime/alkali solution), hominy grits contained more niacin than ordinary corn, cornmeal, or corn bread. Peanuts and sweet potatoes are high in niacin, so increased production and consumption would also affect niacin intake.
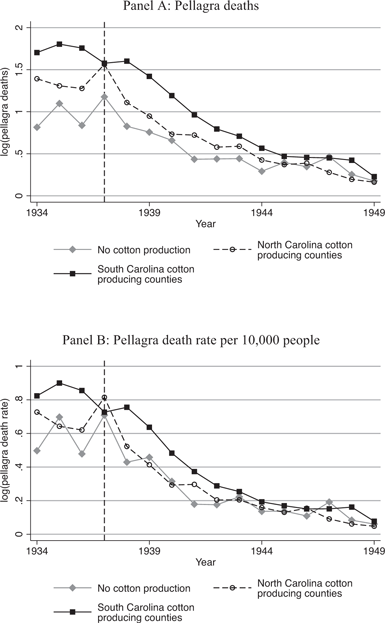
Figure 2 shows that pellagra rebounds during the late 1920s, shortly after the effects of the boll weevil begin to recede and the cotton economy recovers. Pellagra plummets again during the late 1920s and early 1930s, with the onset of the Great Depression and a sharp decline in cotton-acres harvested. It is only after the discovery of niacin in 1937, marked by the dashed-vertical line in the graphs, and the passage of laws mandating the fortification of grains and breads with niacin, that the correlation between cotton production and pellagra seems to break down.
In 1936 and 1937 Elvehjem and his collaborators were conducting experiments with rats and dogs that would lead to the discovery that niacin cured black tongue in dogs. Black tongue in dogs had long been recognized as being related to pellagra in humans. He published their results in September 1937 in a letter to the editor of the Journal of the American Chemical Society. The implications of these animal experiments for treatment of pellagra in humans were clear. In 1938, some bakers began voluntarily fortifying their bread with high vitamin yeast. The direct effects of voluntary fortification on the South are unclear, because bread was not consumed in large quantities and was often made at home (Park et al. Reference Park, Sempos and Barton2000; Park et al. Reference Park, Mcdowell and Hanson2001).
Thus, by 1937, the medical profession now knew that increased consumption of niacin rich foods could be used to address pellagra. Before this, doctors adopted ineffective treatment strategies. For example, a review of articles on PubMedCentral published between 1910 and 1937 suggests that during the 1910s, doctors in the American South focused treatment on chemical interventions, particularly Salvarsan, which had been used to treat syphilis.
In 1939, the Council on Foods and Nutrition of the American Medical Association encouraged “with some qualification, fortification of certain staple foods with vitamins and minerals, specifically the restorative additions of thiamine, niacin, riboflavin, iron, and calcium to white flour and white bread” (Wilder Reference Wilder1956, p. 1540). The committee had previously approved adding vitamin D to milk and iodine to salt. In 1941 the FDA established standards for the fortification of bread. In 1943 War Food Order No. 1 stated that all bread sold in interstate commerce had to meet FDA standards. Fortification of flour was not required and regulation was left to the states. The law was officially repealed in 1946 (Niemesh Reference Niemesh2015).
Over the period 1942–1949, 28 states passed some type of mandatory fortification law. For example, South Carolina passed a law in 1942 covering bread and flour and it was extended in 1943 to cover corn meal and corn grits. North Carolina passed a law in 1945 that covered bread, flour, corn meal, and corn grits. (States that passed laws pertaining to cornmeal and hominy grits were: Alabama, Georgia, Mississippi, North Carolina, South Carolina, and Texas.) Spurred by this, major producers of cornmeal and grits in the Midwest began fortifying their products. A 1957 survey found that nearly all hominy grits sold were enriched, and that cornmeal was generally enriched, except in Florida and Virginia, where enrichment was less typical (Park et al. Reference Park, Mcdowell and Hanson2001; National Research Council 1958).
These discoveries and laws were reflected in reduced pellagra. In particular, pellagra rates dropped sharply and permanently shortly after the discovery that pellagra was caused by niacin deficiency in 1937. The decline continued after the passage of states laws in the 1940s mandating that breads and grains be enriched with niacin. By the 1950s, the disease was largely eliminated from the United States.
A SIMPLE ECONOMIC FRAMEWORK
In this section, we sketch out a simple economic framework that can explain how the South’s reliance on cotton might have promoted higher pellagra rates in particular, and poor nutrition more generally construed. One of the central messages of this framework is that cash cropping does not necessarily result in poor nutrition; it only does so under certain conditions.
Consider a largely agricultural economy, where farmers decide how to allocate their land, labor, and capital. They can either plant, harvest, and sell a cash crop in an international market (in this case, cotton), or they can deploy their resources to produce food for the local market. In deciding how to allocate resources, farmers look toward expected prices.Footnote 5 To the extent expected cotton prices are relatively high, farmers would allocate their land and resources to planting and selling cotton and produce little food for the local market. This would decrease the supply of locally produced foods, driving up the relative price. Consumers, in turn, would then substitute away from local foods and begin importing food produced elsewhere. In the case here, consumers turned to degerminated corn from the Midwest, which as noted earlier, had low niacin content.
As an empirical matter, we cannot observe the expected price of cotton or the price of locally produced foods. However, we can observe acres dedicated to cotton and food production, which is perhaps an even better indicator of farmers’ beliefs about the expected relative profitability of food and cotton. In addition, we also exploit a setting where expected prices did not drive planting decisions: the arrival of the boll weevil, which induced farmers to shift away from cotton and diversify crops.
For the process noted earlier to generate high rates of pellagra, two conditions would need to be satisfied. First, it must be the case that there are, in fact, nutritional differences between imported corn and locally-sourced foods. Although we cannot directly test this proposition, there is anecdotal evidence to suggest this was the case. In the case of corn, as explained in the previous section, locally-produced southern corn was not degerminated, and so it is thought to have been healthier and richer in niacin. There is also evidence (discussed later) that aside from corn, southern farmers would switch to growing peanuts and sweet potatoes when cotton prices were low or when cotton production was not feasible. Peanuts and sweet potatoes are both rich in niacin and other micronutrients. Second, it must be the case that the price effect dominates any income effect.Footnote 6 More precisely, if demand for nutrition grows with income and higher cotton prices, it is possible that consumers in the region might begin importing relatively expensive niacin-rich foods, rather than degerminated corn. Having said this, nutritionally rich foods in general, and foods that were high in niacin, in particular, were poorly understood during our study period. Put another way, if cash cropping generates sufficiently high wages and income, and nutrition is a normal good, cash cropping need not imply poor nutrition.
DATA
County-level crop production data are from the 1909, 1919, 1924, and 1929 Censuses of Agriculture. These data are compiled in Michael Haines, Price Fishback, and Paul Rhode (Reference Haines, Fishback and Rhode2015) United States Agriculture Data, 1840–2010. We use data on cotton, corn, peanut, sweet potato, and tobacco acreage and acreage per capita.
We use data on county and state population, the year the boll weevil arrived in a county, and the dates that states passed fortification laws. Population data are from the 1900 to 1950 Censuses of Population. We linearly interpolate county and state populations between decennial censuses. Data on the first year the boll weevil arrived in a county are taken from Lange, Olmstead, and Rhode (Reference Lange, Olmstead and Rhode2009), which originally came from USDA boll weevil maps.Footnote 7 The year of state fortification law passage was taken from Youngmee Park et al. (Reference Park, Mcdowell and Hanson2001).
We collected data on pellagra mortality at the county-level for North Carolina from 1915–1949 and for South Carolina for 1916–1949. North Carolina and South Carolina are the only states, to our knowledge, that consistently reported pellagra deaths at the county level during this entire time period (1915–1949). Pellagra deaths for counties in North Carolina come from The Annual Report of the Bureau of Vital Statistics of the North Carolina State Board of Health.Footnote 8 The North Carolina State Board of Health did not issue a vital statistics report for the years 1918 and 1919; accordingly we do not have data on pellagra deaths for those years. Pellagra deaths for counties in South Carolina from 1916–1949 come from the Annual Report of the State Board of Health of South Carolina.
To supplement the analysis of pellagra in North Carolina from 1915 to 1925, we collected county-level deaths for the following diseases: malaria, measles, pneumonia, typhoid, and tuberculosis. Comparable data are not available for South Carolina.Footnote 9
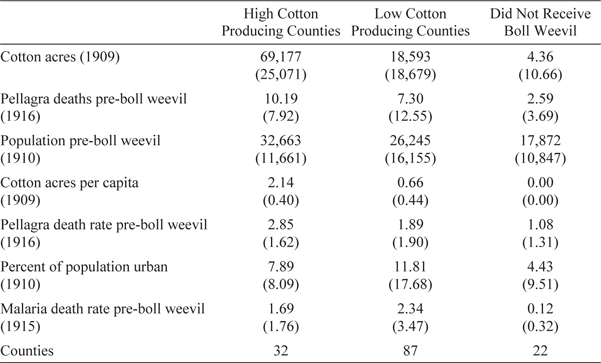
Table 2 presents summary statistics for three types of counties. We define high cotton counties as counties in the top 25 percent of the distribution of cotton acres per capita in North Carolina and South Carolina in 1909, which is prior to the arrival of the boll weevil. All of these counties received the boll weevil. Low cotton producing counties include all counties that received the boll weevil, but were not classified as high cotton producing counties. Finally, 22 counties did not receive the boll weevil. For ease of exposition unless there is a risk of confusion, we will refer to these counties as high cotton, low cotton, and no cotton counties. When compared to low cotton or no cotton counties, high cotton counties had higher cotton acres in 1909, higher numbers of pellagra deaths in 1916, larger populations in 1910, higher cotton per capita in 1909, and higher pellagra death rates in 1916.Footnote 10
SUMMARY STATISTICS

Notes: This table includes summary statistics for our sample of 141 counties in North Carolina and South Carolina. High cotton producing counties are defined as counties that were in the top 25 percent of the distribution of cotton acres per capita in 1909. All of these counties received the boll weevil. Low cotton producing counties include all counties that received the boll weevil, but were not classified as high cotton producing counties. Finally, 22 counties did not receive the boll weevil. Most of these counties did not have any cotton production, however, according to Haines, Fishback, and Rhode (Reference Haines, Fishback and Rhode2015), United States Agriculture Data, 1840–2010, a few of these counties did have very low level of cotton production. This is reflected in the fact that the average number of cotton acres in these counties is 4.36.
Sources: Cotton acres come from Haines, Fishback, and Rhode (Reference Haines, Fishback and Rhode2015) United States Agriculture Data, 1840–2010. Pellagra and malaria deaths come from the state health reports of North Carolina and South Carolina. County populations and urban populations come from decennial censuses.
COTTON, THE BOLL WEEVIL, AND PELLAGRA
Lange, Olmstead, and Rhode (Reference Lange, Olmstead and Rhode2009), Baker (Reference Baker2015), Bloome, Feigenbaum, and Muller (Reference Bloome, Feigenbaum and Muller.2017), and Ager, Brueckner, and Herz (Reference Ager, Brueckner and Herz2017) all use the boll weevil as an exogenous change to examine a range of outcomes. These authors argue that it is reasonable to treat the timing of the boll weevil as exogenous because there was little farmers and local officials could do to prevent the boll weevil from invading their county.Footnote 11 Following the lead of these previous studies, we use the arrival of the boll weevil to test the long-standing hypothesis that pellagra stemmed, in part, from the South’s monoculture in cotton.
Our empirical work on the boll weevil proceeds in three steps. We first focus on how disease rates responded to the arrival of the boll weevil, and show that the boll weevil was associated with reductions in pellagra. We then implement a series of econometric tests to see if our findings are robust to the following: additional controls for changes in overall mortality; dropping the years of the Great Influenza Pandemic; dropping counties with border changes; an explicit control for population; and placebo tests involving diseases other than pellagra. In the Online Appendix, we further explore the robustness of our results, giving particular attention to the possibility of selective migration, our measure of cotton intensity, and interpolation. The third and final part of our empirical analysis here focuses on the mechanisms linking pellagra and the boll weevil. We do this by analyzing how the boll weevil altered planting choices and prompted farmers to harvest food crops instead of cotton.
Figure 3 motivates the first part of our empirical analysis. Panel A (B) plots pellagra deaths (death rates) against cotton production for counties in South Carolina and North Carolina from 1915 to 1925. The vertical lines indicate key dates regarding the arrival of the boll weevil. From both panels, it is clear that following the arrival of the boll weevil, pellagra deaths and pellagra death rates are everywhere declining over time, but they fall more in cotton producing counties than in non-cotton counties (that were not invaded by the boll weevil).
PELLAGRA AND THE BOLL WEEVIL, 1915–1925

To study the relationship between the boll weevil shock and pellagra, we estimate the following equation:
 $$\eqalign{ ln {{\rm{[}}pellagra{\rm{]}}_{ct}} \cr& = \alpha + {\theta _{\rm{1}}} \times {{\rm{[}}boll \ weevil{\rm{]}}_{ct}} \cr& + {\theta _{\rm{2}}} \times {{\rm{[}}boll \ weevil{\rm{]}}_{ct}} \times {\rm{ [}}intensity{{\rm{]}}_c} + {\theta _c} \cr &+ {\theta _t} + {\varepsilon _{ct}} \cr} $$
In equation (1), ln[pellagra]ct is the log of pellagra deaths or the log of the pellagra death rate in county c in year t. [boll weevil]ct is an indicator variable that takes a value of one after the boll weevil has arrived in a county. We interact the boll weevil indicator with a measure of intensity of treatment [intensity]c. We adopt two measures of intensity. First, [high cotton]c ,1909 is an indicator variable if county c was in the top 25 percent of the distribution of cotton acres per capita in North Carolina and South Carolina in 1909. Second, [high pellagra]c ,1915 is an indicator if a county was in the top 25 percent of the distribution of pellagra death rates in North Carolina and South Carolina in 1915 and 1916. Finally, we include county fixed effects to control for unobserved time invariant county characteristics and year fixed effects to control for any unobserved shocks in a particular year that are common across the sample.
In some specifications, we control for the malaria death rate in 1915 and the urbanization rate in 1910. According to Hoyt Bleakley (Reference Bleakley2010), the malaria intervention in the American South occurs almost concurrently with the arrival of the boll weevil in North Carolina and South Carolina. Accordingly, we control for the county-level malaria death rate in 1915, just prior to the arrival of the boll weevil, interacted with year fixed effects. We also control for the percent of the county population living in an urban area during the 1910 census interacted with year. This controls for urban-rural differences in access to food.
For the analysis of pellagra deaths and death rates, we again use the sample period 1915–1925, restricting the sample to counties that existed in 1910. This provides us with pellagra death data for 98 counties in North Carolina and 43 counties in South Carolina over this time period, giving us a sample of 141 counties and 1,353 observations.Footnote 12
Our analysis presents results for both pellagra deaths and the pellagra death rate. We present results for both deaths and the death rate for the following reason. The pellagra death rate calculation is based on population numbers that are linearly interpolated between census years. As a result, the calculated death rate will be based on population estimates that are too low prior to the boll weevil and too high following the boll weevil in counties where the boll weevil causes a decrease in population. In counties that see an increase in population after the arrival of the boll weevil, the interpolated population will be too high prior to the boll weevil and too low following its arrival. Although neither deaths nor the death rate is a perfect measure, using both measures can help us assess the robustness of our results to concerns about interpolation.
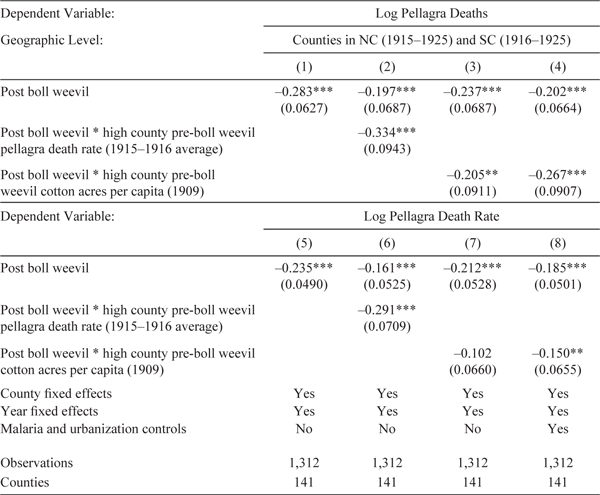
Table 3 shows the effect of the boll weevil on pellagra deaths and pellagra death rates in North Carolina and South Carolina. In columns 1–3, pellagra deaths fell statistically significantly following the arrival of the boll weevil and fell statistically significantly more post-boll weevil in counties with high pre-boll weevil death pellagra rates (column 2) and in high cotton counties (column 3). Pellagra fell 40 percent more in counties with high pre-boll weevil pellagra death rates than in counties with low pre-boll weevil pellagra death rates.Footnote 13 Pellagra fell 23 percent more in high cotton counties than in low cotton counties. Column 4 adds controls for malaria and urbanization, each interacted with year fixed effects. Pellagra fell 31 percent more in high cotton counties than in low cotton counties. The patterns in columns 5–8 for pellagra death rates are similar in sign and significance, although the magnitudes of the interaction terms are smaller. This is because the rates adjust for the declines in population, which the counts do not.
THE BOLL WEEVIL AND PELLAGRA

Notes: This table reports OLS estimates from equation (3) in the text. The unit of observation is a county-year cell. Standard errors, reported in parentheses, are clustered at the county-level. The variable “high county pre-boll weevil pellagra death rate” is an indicator if a county was in the top 25 percent of the distribution of pellagra death rates in North Carolina and South Carolina in 1915 and 1916. The variable “high county pre-boll weevil cotton acres per capita” is an indicator if a county was in the top 25 percent of the distribution of cotton acres per capita in 1909. Malaria and urbanization controls include the malaria death rate in 1915 and the percentage of the county population that lived in an urban designated area in 1910 both interacted with a full set of year dummies.
* p<0.1, ** p<0.05, *** p<0.01
Sources: The dependent variables come from the state health reports of North Carolina and South Carolina. The year that the boll weevil first arrived in a county comes from Lange, Olmstead, and Rhode (Reference Lange, Olmstead and Rhode2009). The high cotton acres indicator is constructed, as detailed in the notes above, from Haines, Fishback, and Rhode (Reference Haines, Fishback and Rhode2015) United States Agriculture Data, 1840–2010.
Table 4 examines the robustness of the results in Table 3 to three sets of concerns: the influenza pandemic (1918–1919); changing county borders; and the aforementioned interpolation concern. For comparison, column 1 re-reports the results for pellagra deaths from Table 3 column 4. Column 2 drops 1918 and 1919 for South Carolina, since we do not observe data in North Carolina in those years. Column 3 drops counties that change borders. Column 4 uses a different method of adjusting for population for counties that receive the boll weevil during that decade. This is done to address concerns that interpolated population measures for inter-census years could be overestimated in the face of boll-weevil induced outmigration. Hence, instead of interpolating population, population is assumed to be constant from the census year to the year prior to the arrival of the boll weevil, and then drops or increases to its value in the next census year after the boll weevil arrives. We are, therefore, assuming that population changes, which might occur due the arrival of the boll weevil, happen in the year the boll weevil arrives. Columns 5–8 repeat the analysis for pellagra death rates.
ROBUSTNESS CHECKS

Notes: This table reports OLS estimates from equation (3) in the text. The unit of observation is a county-year cell. Standard errors, reported in parentheses, are clustered at the county-level. The variable “high county pre-boll weevil cotton acres per capita” is an indicator if a county was in the top 25 percent of the distribution of cotton acres per capita in 1909. Malaria and urbanization controls include the malaria death rate in 1915 and the percentage of the county population that lived in an urban designated area in 1910 both interacted with a full set of year dummies.
* p<0.1, ** p<0.05, *** p<0.01
Sources: The dependent variables come from the state health reports of North Carolina and South Carolina. The year that the boll weevil first arrived in a county comes from Lange, Olmstead, and Rhode (Reference Lange, Olmstead and Rhode2009). The high cotton acres indicator is constructed, as detailed in the notes above, from Haines, Fishback, and Rhode (Reference Haines, Fishback and Rhode2015) United States Agriculture Data, 1840–2010.
In the Online Appendix (Table A3), we further explore the robustness of our baseline model. In particular, we obtain similar (though weaker) results if we use cotton acres as a share of total acres as our intensity of treatment measure. We also consider different controls and measures of mortality, showing that we obtain the same results if we control for the overall death rate or use the ratio of pellagra deaths to total deaths as our dependent variable. Finally, we interpolate pellagra deaths for 1918 and 1919 for North Carolina and show that our central results remain.
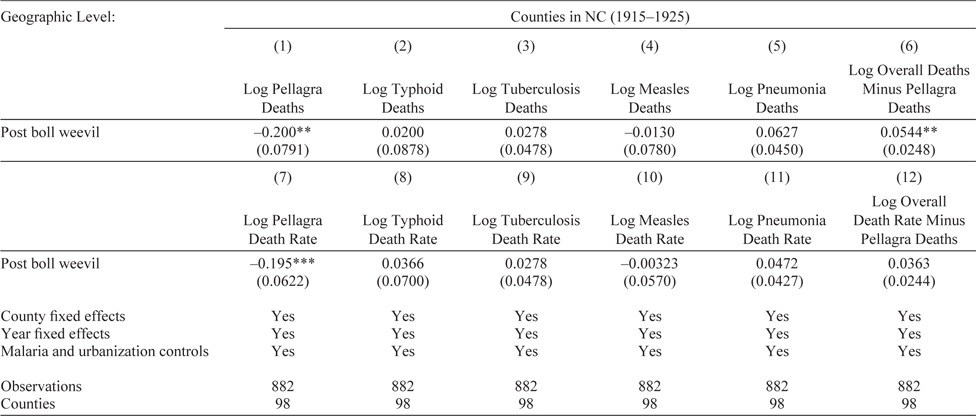
In Table 5 we use data from North Carolina to examine the effect of the boll weevil on diseases that are not caused by nutritional deficiencies.Footnote 14 All columns control for the county-level malaria death rate in 1915 interacted with year fixed effects and the percent of the county population living in an urban area during the 1910 census interacted with year fixed effects. Column 1 displays the baseline effect of the boll weevil on pellagra in North Carolina. The arrival of the boll weevil is associated with a 22 percent decrease in pellagra deaths. Columns 2–6 examine the effect of the arrival of the boll weevil on typhoid fever, tuberculosis, measles, pneumonia, and overall deaths (minus pellagra deaths), respectively. The boll weevil is associated with a small but statistically significant increase in overall deaths (minus pellagra deaths) of 5 percent. Columns 7–12 examine the effect of the arrival of the boll weevil on death rates of different disease. The boll weevil is not associated with significant decreases in the death rate of any of the non-nutrition related diseases or the overall death rate.
THE BOLL WEEVIL AND OTHER DISEASES

Notes: This table reports OLS estimates from equation (3) in the text, but uses diseases other than pellagra as the dependent variables in columns 2–6 and 8–12. The unit of observation is a county-year cell. Standard errors, reported in parentheses, are clustered at the county-level. Malaria and urbanization controls include the malaria death rate in 1915 and the percentage of the county population that lived in an urban designated area in 1910 both interacted with a full set of year dummies.
* p<0.1, ** p<0.05, *** p<0.01
Sources: The dependent variables come from the state health reports of North Carolina and South Carolina. The year that the boll weevil first arrived in a county comes from Lange, Olmstead, and Rhode (Reference Lange, Olmstead and Rhode2009).
One concern surrounding our analysis is the possibility that the groups most affected by pellagra migrated out of high cotton producing counties at a higher rate than the rest of the population. To address this issue, we looked for evidence of differential migration among affected groups. We used the 1910, 1920, and 1930 complete count census data to count the population of groups most affected by pellagra: children age two–ten and females age 22–44. We then generated two population counts for each county-year cell in North Carolina and South Carolina, the count for the affected group and the count of the rest of the population. We regressed these counts on year fixed effects, county fixed effects, and a post boll weevil indicator interacted with cotton (or pellagra) intensity and interacted with an indicator if the count was for the affected group.
The results of these “triple difference” regressions are displayed in Online Appendix Table A4, columns 2–5. The coefficient on the triple interaction is never significant and is close to zero in all specifications. Therefore, there is no evidence that children age two–ten or females age 22–44 are migrating out of high cotton producing counties at a higher rate than the rest of the population after the arrival of the boll weevil.
Online Appendix Table A4, column (1) also provides what might be a more direct test of whether groups most affected by pellagra migrate at a higher rate after the arrival of the boll weevil. In this specification we regress the population of a county in North Carolina or South Carolina on year fixed effects, county fixed effects, and a post boll weevil indicator interacted with cotton intensity and pellagra intensity. Again, the coefficient on the triple interaction term is not significant, meaning that counties with high cotton production and high pellagra did not experience differentially high outmigration after the arrival of the boll weevil. These patterns suggest the groups most vulnerable to pellagra did not migrate out of high cotton/high pellagra counties at elevated rates.
THE BOLL WEEVIL AND LOCAL FOOD PRODUCTION
We next turn to the effect of the boll weevil on crop acreage and crop acreage per capita in North Carolina and South Carolina. We adopt a specification similar to Lange, Olmstead, and Rhode (Reference Lange, Olmstead and Rhode2009):
 $$\eqalign{ ln{[crop\,outcome]_{ct}} \cr &= \alpha + {\theta _1}*{[boll\,weevil]_{ct}} \cr &+ {\theta _2} \times {[boll\,weevil]_{ct}} \cr & \times {[cotton\,acres\,pc]_{c,1909}} + {\theta _3}*t{S_c} + {\theta _4} \cr & *{t^2}{S_c} + {\theta _c} + {\theta _t} + {\varepsilon _{ct}}}$$
This specification is similar to equation (1), but the outcome is the log of acres dedicated to cotton, corn, peanuts, sweet potatoes, or tobacco or the acres per capita dedicated to these crops. In addition, we include a quadratic time trend, t and t 2, interacted with the share of cotton in total acres harvested in 1909, Sc. We restrict the sample to counties that existed in 1909. This restriction leaves us with 141 counties. Standard errors are clustered at the county level.
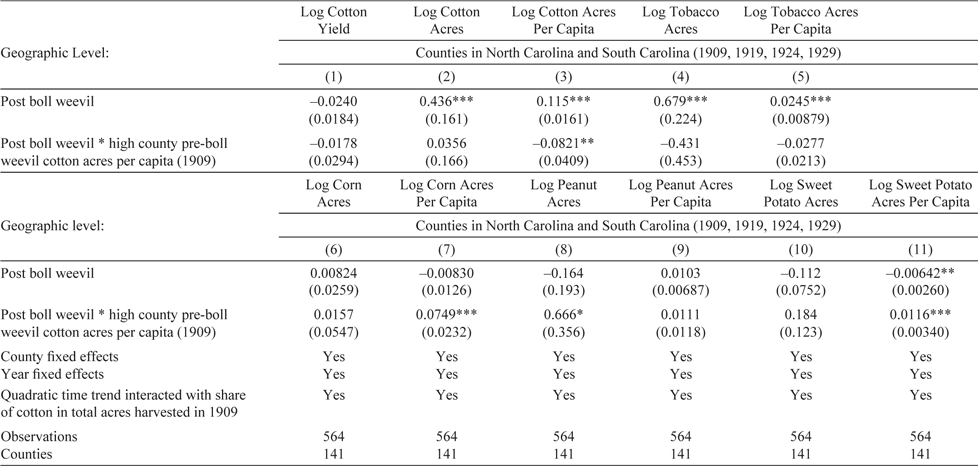
Table 6 displays the estimates from equation (2) for the agricultural censuses between 1909 and 1929. Cotton yields and cotton acres per capita fell more in high cotton counties after the boll weevil arrived. In addition, corn acres per capita, peanut acres, and sweet potato acres per capita, all saw significant increases in high cotton counties after the boll weevil. Notably, corn acres per capita increased 7.5 percent in high cotton counties relative to low cotton counties. Our results for North Carolina and South Carolina show evidence that acres and acres per capita devoted to food production increased after the boll weevil and are similar to the Lange, Olmstead, and Rhode (Reference Lange, Olmstead and Rhode2009) results for the South more broadly. These results suggest a mechanism (i.e., increased availability of nutritionally-rich, locally-sourced foods) through which the arrival of the boll weevil might have promoted better nutrition, particularly in relation to niacin and pellagra.
THE BOLL WEEVIL AND CROPS

Notes: This table reports OLS estimates from equation (2) in the text. The unit of observation is a county-year cell. Standard errors, reported in parentheses, are clustered at the county-level. The variable “high county pre-boll weevil cotton acres per capita” is an indicator if a county was in the top 25 percent of the distribution of cotton acres per capita in 1909.
* p<0.1, ** p<0.05, *** p<0.01
Sources: The dependent variables come from Haines, Fishback, and Rhode (Reference Haines, Fishback and Rhode2015) United States Agriculture Data, 1840–2010. The high cotton acres indicator is constructed, as detailed in the notes above, from Haines, Fishback, and Rhode (Reference Haines, Fishback and Rhode2015) United States Agriculture Data, 1840–2010. The year that the boll weevil first arrived in a county comes from Lange, Olmstead, and Rhode (Reference Lange, Olmstead and Rhode2009). See the text for more details.
NIACIN AND THE FALL OF PELLAGRA
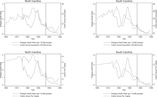
To motivate our analysis of the decline of pellagra, Figure 4 plots pellagra deaths and death rates in South Carolina and North Carolina. The figure compares cotton producing counties and non-cotton producing counties from 1934 to 1949. Following the discovery of niacin as a cure of pellagra in 1937 (marked by the dashed lines in Figure 4), pellagra deaths and pellagra death rates fall overall and fall more in cotton producing counties.
PELLAGRA AND THE DISCOVERY OF NIACIN, 1934–1949

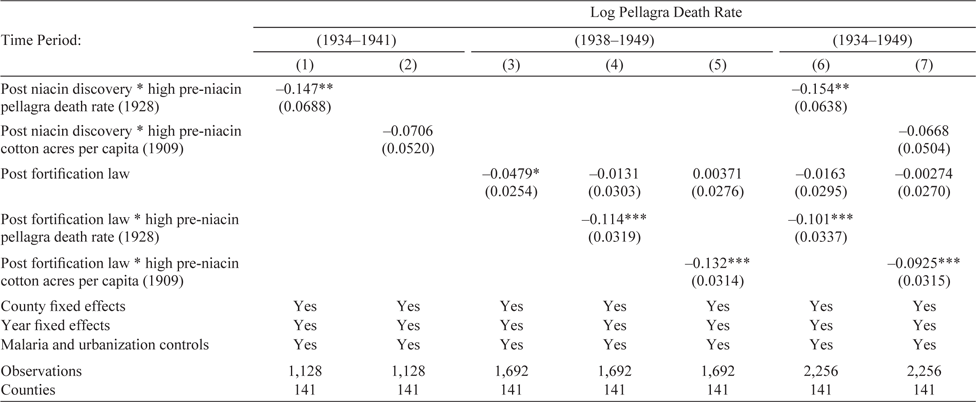
To describe the effect that the discovery of niacin had on pellagra we estimate a variant of equation (1) where [boll weevil]ct is replaced with a dummy variable that takes a value of one starting in 1937. We run this regression on county-level pellagra data for North Carolina and South Carolina.Footnote 15 We again use two intensity of treatment variables. The first is an indicator variable that takes a value of one if county c was in the top 25 percent of the distribution of pellagra death rates in 1928, prior to the discovery of niacin. The second intensity of treatment variable is an indicator variable if county c was in the top 25 percent of the distribution of cotton acres per capita in North Carolina and South Carolina in 1909.
Table 7 uses three different time periods to explore the effects of the discovery of niacin and the passages of mandatory fortification laws. Columns 1 and 2 use the time period 1934–1941 to study the effects of the discovery of niacin on pellagra death rates. Pellagra deaths fell more after the discovery of niacin in high-pellagra counties and in high cotton counties. Columns 3–5 use the time period 1938–1949 and study the effects mandatory fortification laws on pellagra death rates. The passage and implementation of a mandatory fortification law is associated with a decrease in the pellagra death rate, with larger decreases occurring in high-pellagra and high-cotton counties. Finally, columns 6–7 use the entire time period 1934–1949 and study the effects of both the discovery of niacin and the passage of a mandatory fortification law. When estimating the effects simultaneously, we still find that the pellagra death rate decreased more in high-pellagra and high-cotton counties after the discovery of niacin and after the passage of a mandatory fortification law. High-pellagra counties saw about a 16 percent decrease in the pellagra death rate after the discovery of niacin, and high-cotton counties saw about a 7 percent decrease. Both high-pellagra and high-cotton counties saw around an 11 percent decrease in the pellagra death rate after the passage of a fortification law.
DISCOVERY OF NIACIN AND FORTIFICATION LAWS – NORTH CAROLINA AND SOUTH CAROLINA

Notes: This table reports OLS estimates from equation (3) in the text. The unit of observation is a county-year cell. Standard errors, reported in parentheses, are clustered at the county-level. “Post niacin discovery” is an indicator variable that takes a value of one beginning in 1937 with the discovery of niacin. “Post fortification law” is an indicator variable that takes a value of one beginning in the year that a state past a mandatory fortification law. North Carolina passed a mandatory fortification law in 1945 and South Carolina passed a mandatory fortification law in 1942. The variable “high pre-niacin pellagra death rate (1928)” is an indicator if a county was in the top 25 percent of the distribution of pellagra death rates in North Carolina and South Carolina in 1928. The variable “high pre-niacin cotton acres per capita (1909)” is an indicator if a county was in the top 25 percent of the distribution of cotton acres per capita in 1909. Malaria and urbanization controls include the malaria death rate in 1915 and the percentage of the county population that lived in an urban designated area in 1910 both interacted with a full set of year dummies.
* p<0.1, ** p<0.05, *** p<0.01
Sources: The dependent variables come from the state health reports of North Carolina and South Carolina. The high cotton acres indicator is constructed, as detailed in the notes above, from Haines, Fishback, and Rhode (Reference Haines, Fishback and Rhode2015) United States Agriculture Data, 1840–2010.
Overall, the results in Table 7 indicate that counties with high cotton acreage per capita and poor baseline nutrition gained the most from the discovery of niacin and mandatory fortification laws. In Online Appendix Table A5, we also use state (rather than county) level data to show that the passage of mandatory fortification laws was associated with decreases in the pellagra death rate and that these decreases were larger for states with poor baseline nutrition and high cotton acreage per capita.
CONCLUSION
In this article we have explored the rise and fall of pellagra in the United States. Prior researchers suggest that pellagra emerged in part because of increased cotton production in the American South and the substitution of locally grown corn for corn that was milled in the Midwest. The midwestern milled corn was degerminated, which stripped the corn of much of its nutritional value. To establish the causal relationship between cotton acreage and pellagra we exploit an exogenous shock in cotton production that occurred from the arrival of the boll weevil. We show that, following the arrival of the boll weevil, the death rate from pellagra fell in counties with high initial pellagra or high initial cotton production. We also establish a plausible dietary mechanism to explain this result: the production of locally grown food increased as the boll weevil prompted farmers to shift away from cotton production.
These results are robust to confounding factors related to malaria, urbanization, the Great Influenza Epidemic, changing county borders, and inter-census population estimates based on interpolation. We also provide evidence that the arrival of the boll weevil was not associated with overall improvements in health. The death rates for typhoid, tuberculosis, measles, and pneumonia experienced no significant changes after the arrival of the boll weevil. This implies that one of the main impacts the boll weevil had on short-run health was improved nutrition. Furthermore, while the boll weevil induced outmigration in counties with high cotton production, our estimates suggest the groups most vulnerable to pellagra were not out-migrating at significantly higher rates.
In the last part of the article, we explore the forces that permanently reduced pellagra in the South. We focus on two sets of events: the discovery that niacin worked as an anti-pellagrant, which occurred in 1937; and the passage of state-level mandatory fortification laws from 1942 to 1949. Our results indicate that both sets of events mattered and contributed to the (near) elimination of pellagra in the South.