Introduction
Adelges tsugae Annand (Hemiptera: Adelgidae) (hemlock woolly adelgid) is endemic to the Pacific Northwest of North America, where it causes little damage to hemlocks (Tsuga spp.) (Pinaceae) (Havill et al. Reference Havill, Shiyake, Lamb-Galloway, Foottit, Yu and Paradis2016); however, in eastern North America, A. tsugae is invasive and can kill a hemlock in as little as three years (McClure Reference McClure1987). Established eastern populations of A. tsugae are found from Georgia, United States of America to Nova Scotia, Canada and as far west as Michigan, United States of America, and southern Ontario, Canada (United States Department of Agriculture Forest Service 2018; Canadian Food Inspection Agency 2019). Within this area, damage by A. tsugae has resulted in significant changes to ecosystems and property value of lands occupied by hemlock (e.g., Ellison et al. Reference Ellison, Bank, Clinton, Colburn, Elliott and Ford2005; Holmes et al. Reference Holmes, Liebhold, Kovacs and Von Holle2010; Spaulding and Rieske Reference Spaulding and Rieske2010; Aukema et al. Reference Aukema, Leung, Kovacs, Chivers, Britton and Englin2011; Moore et al. Reference Moore, Holmes and Bell2011; Orwig et al. Reference Orwig, Barker-Plotkin, Davidson, Lux, Savage and Ellison2013). Loss of hemlock also impacts wildlife and recreational values (Snyder et al. Reference Snyder, Young, Lemarie and Smith2002; McLoughlin et al. Reference McLoughlin, Vander Wal, Lowe, Patterson and Murray2011; Vickery et al. Reference Vickery, Rieucau and Doucet2011; Ellison et al. Reference Ellison, Barker-Plotkin and Khalid2016; Degrassi Reference Degrassi2018).
For most of its life, A. tsugae is permanently attached to twigs at the tips of hemlock branches, where it lives under a self-made woolly covering called an ovisac. Although ovisacs are present on the tree during most of the year, the woolly covering increases in abundance from early spring through early summer (McClure Reference McClure1987). Detection surveys look on lower-crown branches for this wool (e.g., Costa and Onken Reference Costa and Onken2006); however, there are scenarios where detection of wool on lower-crown branches is difficult because there are no branches to examine at ground level or because ovisacs are located only in the upper crown, where infestations often begin (Joseph et al. Reference Joseph, Hanula and Braman2011). We recently reported on a ball sampling technique that is used to sample the upper canopy of hemlock for A. tsugae wool during spring (Fidgen et al. Reference Fidgen, Fournier, Whitmore, MacQuarrie and Turgeon2019). This technique involves using a slingshot to shoot a ball partially covered with Velcro® hooks through hemlock branch tips of the middle and upper crown (Fidgen et al. Reference Fidgen, Fournier, Whitmore, MacQuarrie and Turgeon2019; Invasive Species Centre 2019). The Velcro is a critical part of this device because it traps and holds A. tsugae wool during the ball’s flight through the crown and landing. Although we have used this technique to detect low-level infestations of A. tsugae in the hemlock canopy, we have not determined how many samples are needed to reliably detect low-incidence A. tsugae infestations on a tree. Obtaining this information is an important step in the development of a stand-sampling approach for A. tsugae using the ball sampling technique.
A stand-sampling approach for detection of new A. tsugae infestations need focus only on the discovery of one infested hemlock tree. The key to developing a stand-sampling approach is to determine the number of samples to take in the stand (i.e., the number of trees to inspect) to reliably detect an infestation if one is present (Nyrop et al. Reference Nyrop, Shelton and Theunissen1989; Binns et al. Reference Binns, Nyrop and van der Werf2000; Parker et al. Reference Parker, Perry, Niesten, Blood Smyth, McKinlay and Ellis2003). Unfortunately, considerable field sampling usually is required to determine the optimal number of samples a surveyor must take. This process has been simplified by the development of resampling simulators (e.g., Binns et al. Reference Binns, Nyrop and van der Werf2000; Parker et al. Reference Parker, Perry, Niesten, Blood Smyth, McKinlay and Ellis2003; Legg et al. Reference Legg, Fidgen and Ryall2014). These simulators can quickly estimate the number of samples to take to achieve a desired level of precision. For example, a precision of 0.75 (i.e., the survey detects the target 75% of the time) is useful for operational surveys (Karandinos Reference Karandinos1976; Costa and Onken Reference Costa and Onken2006). The cost of sampling also is an important feature to consider when optimising sampling protocols (e.g., Parker et al. Reference Parker, Perry, Niesten, Blood Smyth, McKinlay and Ellis2003; Turgeon et al. Reference Turgeon, Pedlar, de Groot, Smith, Jones, Orr and Gasman2010; Berec et al. Reference Berec, Kean, Epanchin-Niell, Liebhold and Haight2015). Neither feature has been optimised for the ball sampling technique.
Herein, we report an extension of the ball sampling procedure for detecting A. tsugae wool in hemlock crowns that uses the presence or absence of wool on a ball as an indication of the infestation status of the tree. The main objective of the study was to assess the probability of detecting an infested tree and the cost (i.e., in time) of using the ball sampling technique when sampling individual trees and when sampling stands of eastern hemlock. Specifically, we assessed: (1) the relationship between number of ball samples per tree and the probability of detecting wool; (2) the relationship between the probability of detecting wool and the incidence of A. tsugae-infested shoots in the lower crown; and (3) the number of trees, as estimated by a resampling simulator, a surveyor would need to inspect in a stand to detect an A. tsugae infestation with 0.75 precision when taking a prespecified number of ball samples per tree.
Materials and methods
Tree sampling
This study was carried out in 2015 and 2016 at seven sites near Ithaca, New York, United States of America (Table 1). We sampled 124 trees using ball sampling (Fidgen et al. Reference Fidgen, Fournier, Whitmore, MacQuarrie and Turgeon2019) and twig sampling (Fidgen et al. Reference Fidgen, Legg and Salom2006). Both techniques were performed by two surveyors.
Tsuga canadensis stands infested with Adelges tsugae sampled to estimate the probability of detecting wool using a ball sampling method for 124 trees sampled near Ithaca, New York, United States of America in 2015 and 2016. DBH, diameter at 130 cm height on the tree bole. Incidence is the proportion of one-year-old twigs infested with one or more A. tsugae ovisacs based on a sample of 10–20 branch tips per tree. We sampled 121 trees to estimate the probability of detecting wool with increasing samples per tree. See text for details.

We performed ball sampling using racquetballs that were filled with wooden beads and covered in thin (one-centimetre-wide) Velcro strips (total surface area of Velcro: 50 cm2; version “FV50” in Fidgen et al. Reference Fidgen, Fournier, Whitmore, MacQuarrie and Turgeon2019). These balls were shot at the distal 60 cm tips of hemlock branches with a slingshot. To ball sample, each surveyor stood on opposite sides of a tree and examined a ball shot by their partner. To initiate sampling, the first surveyor shot a ball through the crown of the tree to land near the second surveyor. After the ball had landed, the second surveyor shot their ball through the crown of the tree to land near the first surveyor. Once the second ball landed, both surveyors recovered the other’s ball and examined the balls in turn for the presence of A. tsugae wool. This process was repeated until wool was found or until each surveyor took 15 samples per tree (i.e., 30 samples), whichever occurred first. For each sample, the presence or absence of wool on the ball was recorded. Wool is easily distinguished from other debris on the ball in spring because it is bright white, malleable (Fidgen et al. Reference Fidgen, Fournier, Whitmore, MacQuarrie and Turgeon2019), and often contains adelgid exoskeletons.
Only those samples for which the ball ascended through a minimum of three branch tips of the targeted hemlock tree and descended through the targeted crown, through open air, or through the crown of a hardwood were acceptable; otherwise they were repeated. We also repeated samples when the ball contacted American beech, Fagus grandifolia Ehrhart (Fagaceae), because this species can harbour a species of scale insect that produces wool that resembles that of A. tsugae. We targeted each sample to a different region of the crown to ensure thorough coverage of all potential A. tsugae habitat. We used fresh balls to sample each tree, and between samples, we cleaned debris and wool off the balls with a medium-bristle toothbrush.
We performed twig sampling with pole pruners. From each tree, we clipped ten 45-cm-long branch tips haphazardly from the lower crown (up to 8.5 m above ground level, which was our maximum reach). If we found adelgid wool on any of these 10 samples, we stopped sampling and estimated incidence of ovisacs (see below). If we did not find wool, we clipped five more tips and examined them, repeating this step one time if no wool was found, for a total of 20 tips. The incidence of ovisacs on any tree with no wool on 20 tips was recorded as zero; all other trees were classified as infested.
Probability of detecting wool using the ball sampling technique. We sampled hemlocks likely infested by A. tsugae using both ball sampling and twig sampling to evaluate the relationship between the probability of detecting wool and the number of ball samples required to find wool. For each sampled tree, we: (1) counted the number of positive ball samples (i.e., those balls that had wool on them after passing through a hemlock crown); (2) recorded the number of the first positive ball sample; (3) counted the number of one-year-old twigs with at least one ovisac on each branch tip; and (4) counted the total number of branch tips on each one-year-old twig. We used the twig counts to compute a measure of incidence by dividing the number of twigs that had at least one ovisac by the total number of twigs on each tip.
We elucidated the relationship between the number of samples until the first positive ball sample was detected as the response and the number of samples (1–30) taken as the predictor by fitting a logistic regression. We evaluated the effect of taking a fixed number of samples (5, 10, 15, 20, 25, and 30) per tree on the probability of detecting wool with increasing incidence of wool in the tree. We used the presence or absence of wool in a tree as the response variable and the incidence of wool, as determined from twig samples, as the predictor. Both these analyses were fit as generalised linear models.
We fit and tested the assumptions of our models using methods described in Zuur et al. (Reference Zuur, Ieno, Walker, Saveliev and Smith2009). All analyses were carried out in the R statistical computing environment, version 3.4.2 (R Core Team 2017). The generalised linear models were fit using functions in the “stats” package (R Core Team 2017). The generalised linear mixed model was fit using functions in the “lme4” package (Bates et al. Reference Bates, Mächler, Bolker and Walker2015). Results were considered significant at the 5% probability level. We used the results of the generalised linear models to predict the probability of detecting the adelgid in a tree, given the precision or the number of samples taken. These probabilities were used as the estimates of precision of the survey. For example, a predicted probability of detection of 0.75 is equivalent to a survey precision of 0.75 (i.e., a survey that detects the insect 75% of the time).
Stand-sampling simulations
We simulated inspections of hemlock stands to estimate the sampling effort (i.e., number of trees sampled and time to sample the required number of trees) needed to detect incipient adelgid infestations using ball sampling. All simulations were done in UNIONSIM (Legg et al. Reference Legg, Fidgen and Ryall2014; available from ˜http://w3.uwyo.edu/˜dlegg/union.html). This programme requires three inputs: (1) the probability of detecting an infested tree (P); (2) the number of trees in a simulated stand (T); and (3) the percentage of trees infested in this stand (I). We set T at 2000 trees, based on the hemlock density of our sampled stands (approximately 165 trees per hectare) and I was increased from 1% to 5% in 1% increments to simulate sampling different levels of A. tsugae infestation. Setting I to 1% is equivalent to 20 trees in a stand being infested, which is similar to what is expected when a newly established population of A. tsugae is present. An I of 2% and 3% (i.e., 40 and 60 trees) represents a low-level infestation (Costa and Onken Reference Costa and Onken2006). Lastly, we assumed a value of 4% and 5% (i.e., 80 and 100 trees) represents stands with larger hemlock woolly adelgid populations having conspicuously infested trees. We repeated each simulation 1000 times. We used the outputs of these simulations to compute the number of trees sampled per stand to detect at least one A. tsugae-infested tree for the 0.75, 0.85, and 0.95 precision levels.
Optimising stand sampling. To optimise stand sampling for adelgid wool using the ball sampling technique, we considered the time needed to complete sampling. This time will vary depending on the number of ball samples taken per tree and the number of trees sampled per stand, which are dictated by the desired precision level of the survey. The time it takes to detect an infestation is also a function of the incidence of the insect in the stand. Finally, travel time between trees also factors into the calculation of the time it takes to complete a survey. For example, when the expected incidence of infested trees in a stand is low, it may be beneficial to take fewer ball samples per tree and to sample more trees per stand, as compared to situations in which the incidence of infested trees in a stand is expected or known to be higher. In that case, it may be beneficial to take more samples per tree and to sample fewer trees per stand. We evaluated this low-incidence scenario in our simulations by varying P to reflect the likelihood of detecting an infested tree when taking 5, 10, 15, 20, 25, and 30 ball samples from each tree when there is a very low-incidence adelgid infestation per tree (I = 0.013). We determined these values of P from the field sampling (above) as 0.34, 0.51, 0.62, 0.70, 0.75, and 0.79. From the results of the simulations, we then evaluated the time needed to complete sampling of the estimated number of trees per stand, assuming 0.25 minutes per ball sample and 1.5 minutes to move between trees.
Results
Tree sampling
We detected A. tsugae wool on 103 of the 124 trees sampled with ball and twig sampling. Three additional trees had infestations of A. tsugae discovered by visual survey of foliage and tree climbing (Fidgen et al. Reference Fidgen, Fournier, Whitmore, MacQuarrie and Turgeon2019). On these trees, we found an average incidence of 0.09 ± 0.012 (mean ± standard error; range: 0–0.60) A. tsugae-infested twigs in the lower crown. We averaged 5 ± 0.4 (range: 1–20) positive ball samples per tree (out of 30 total samples). The average number of ball samples required to obtain the first positive ball sample was 8 ± 0.8 (range: 1–30).
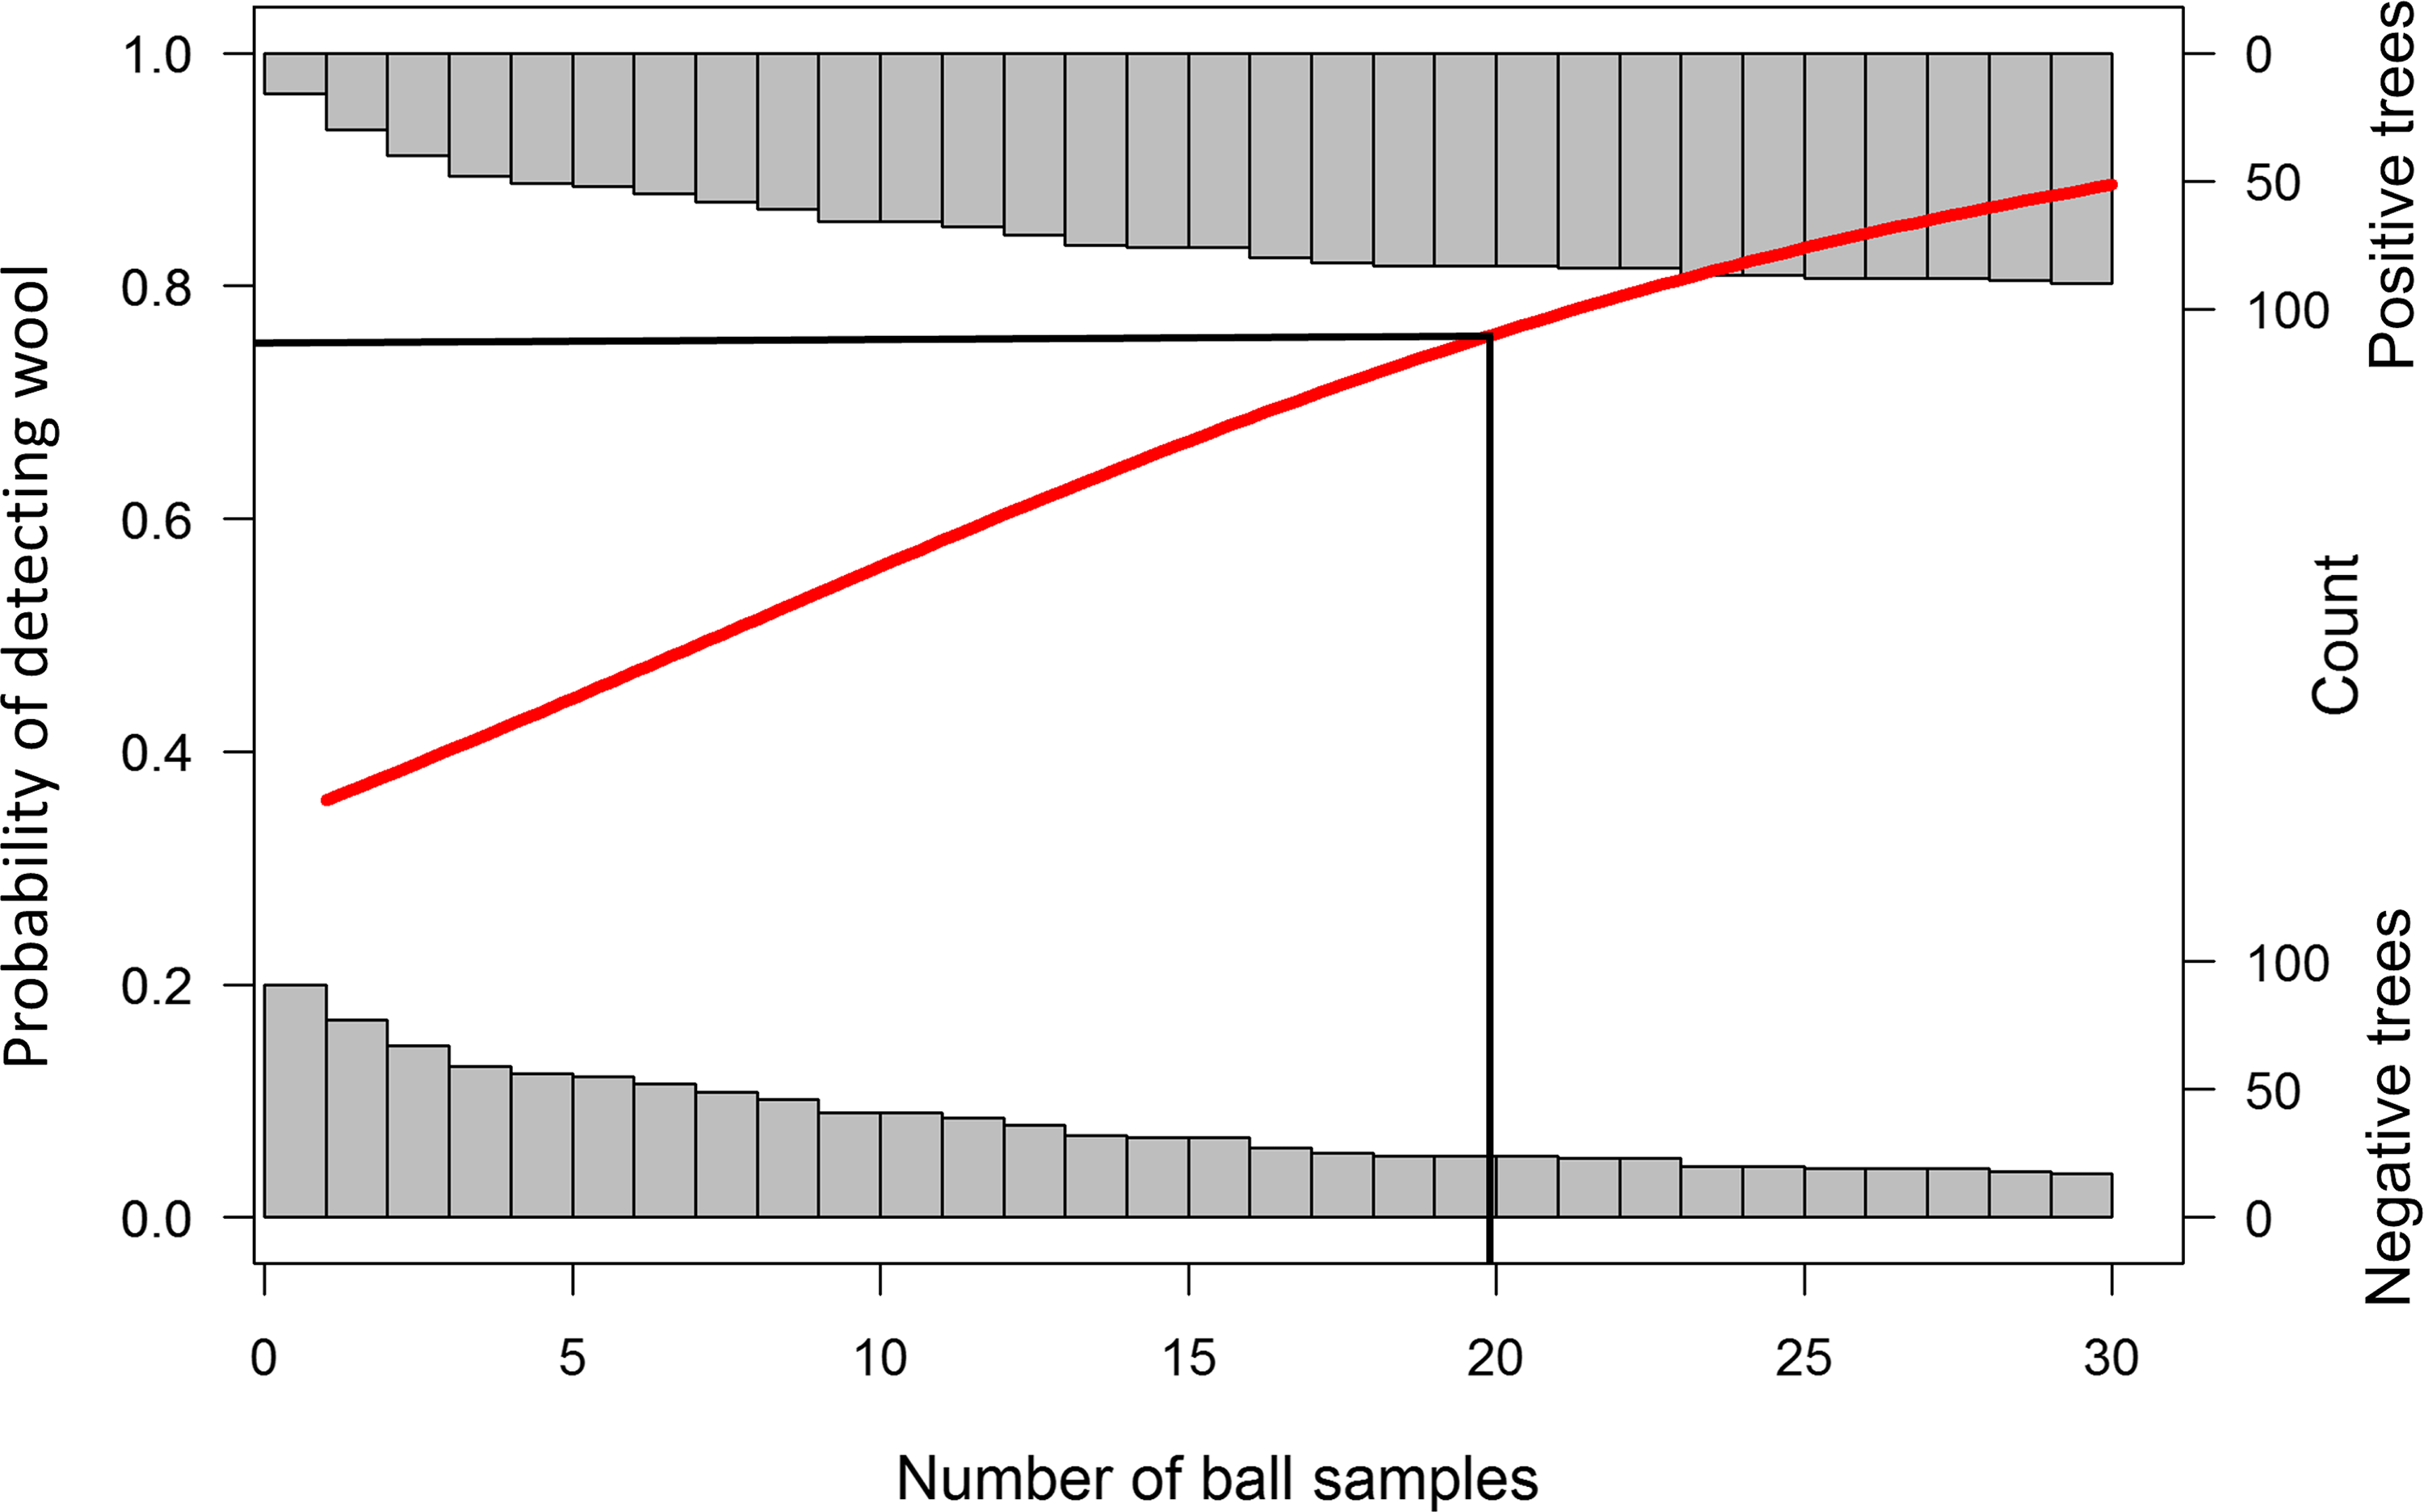
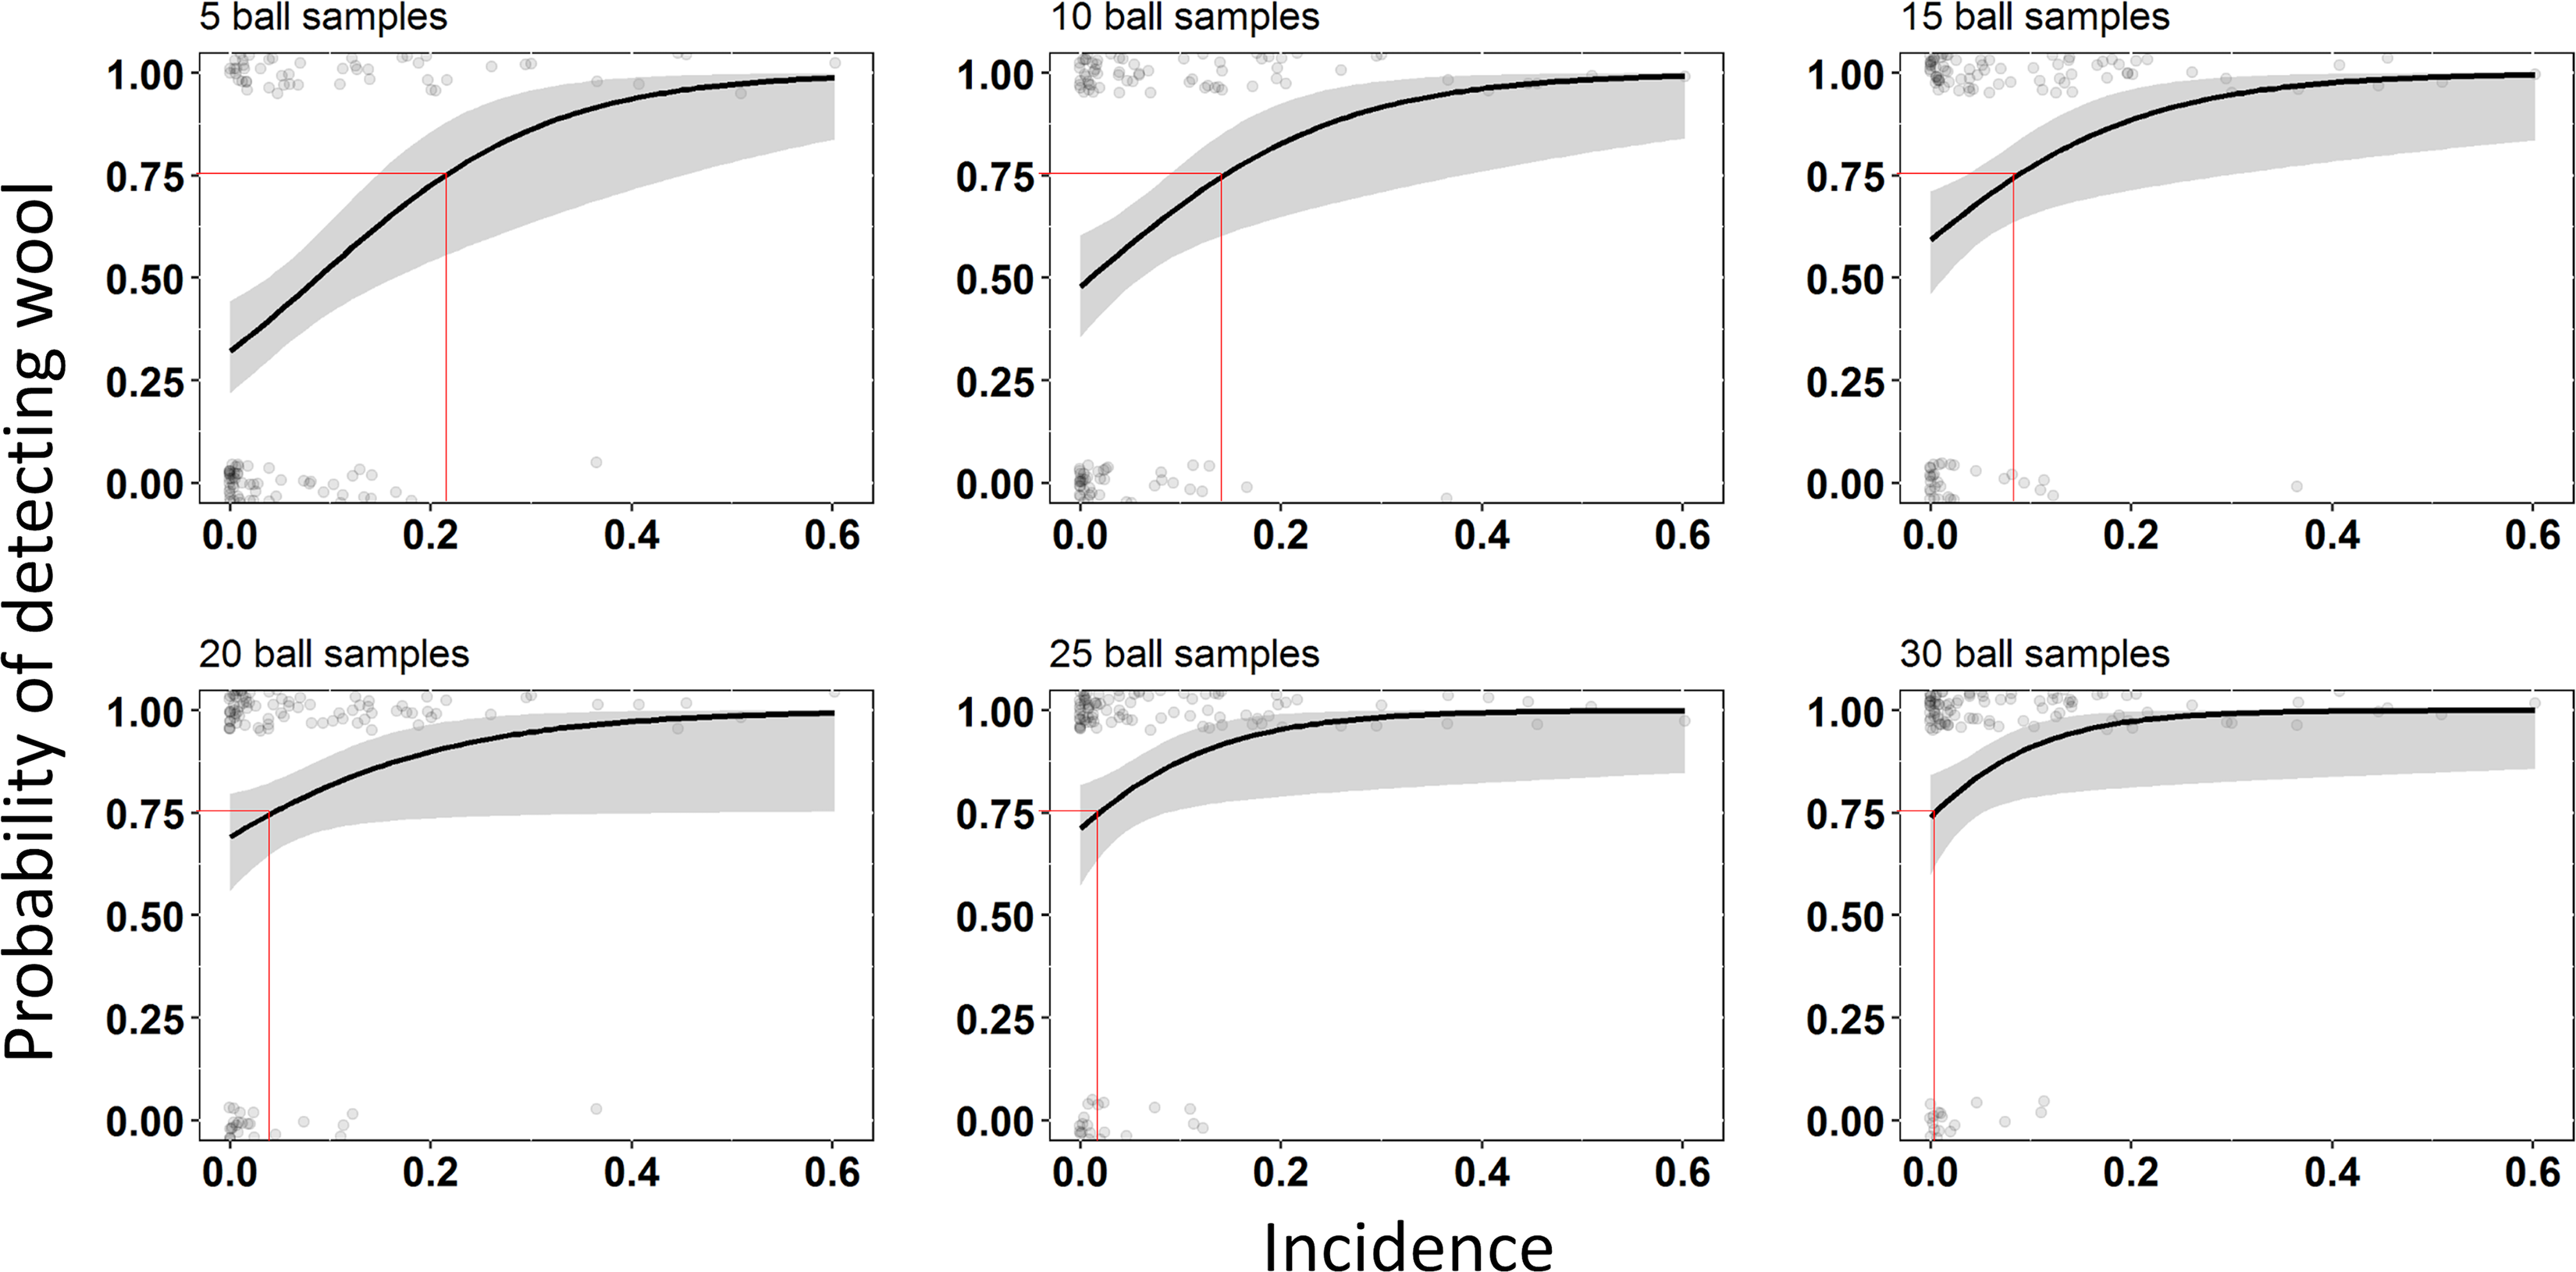
The probability of detecting adelgid wool increased with the number of samples per tree (D = 393.71, df = 1, 3208, P < 0.0001; Fig. 1). The probability of detecting wool was also influenced by the incidence of wool on a tree (D = 56.99, df = 1640, P < 0.0001) and by the rank (out of 30) of the first positive ball sample (D = 50.52, df = 1635, P < 0.0001) but not by the interaction of incidence and rank (D = 0.92, df = 1630, P < 0.9685). When we fixed the maximum number of ball samples per tree at less than 30, we found that, when incidence is low, more ball samples (> 20) are required to obtain the desired 0.75 precision for the survey (Fig. 2).
Probability of detecting Adelges tsugae in an infested Tsuga canadensis tree using Velcro-covered racquetballs. The probability of detection increases with the number of samples. Red line shows the fitted probability of detection from a logistic regression model. Histograms show the distribution of the number of infested and uninfested trees; lower histograms show negative trees (where the insect was not detected); upper histogram shows positive trees (where the insect was detected). Solid black line is the number of samples (20) required to achieve a probability of detection of 0.75, equivalent to a minimum survey precision of 0.75 (after Karandinos Reference Karandinos1976).

Effect of density of Adelges tsugae ovisacs on Tsuga canadensis twigs on the probability of detecting the insect in the crown using Velcro-covered racquetballs, for a range of standard sample sizes (5–30 ball samples per tree). Probability of detection increases with incidence for all sample sizes. Dots along the x-axis denote negative samples (lower dots) and positive samples (upper dots); solid lines show the fitted logistic regression models; red lines show the tree incidence at which a survey of a given sample size (5–30) detects the insect with a probability of detection of 0.75, equivalent to a minimum survey precision of 0.75 (after Karandinos Reference Karandinos1976).

Stand-sampling simulations
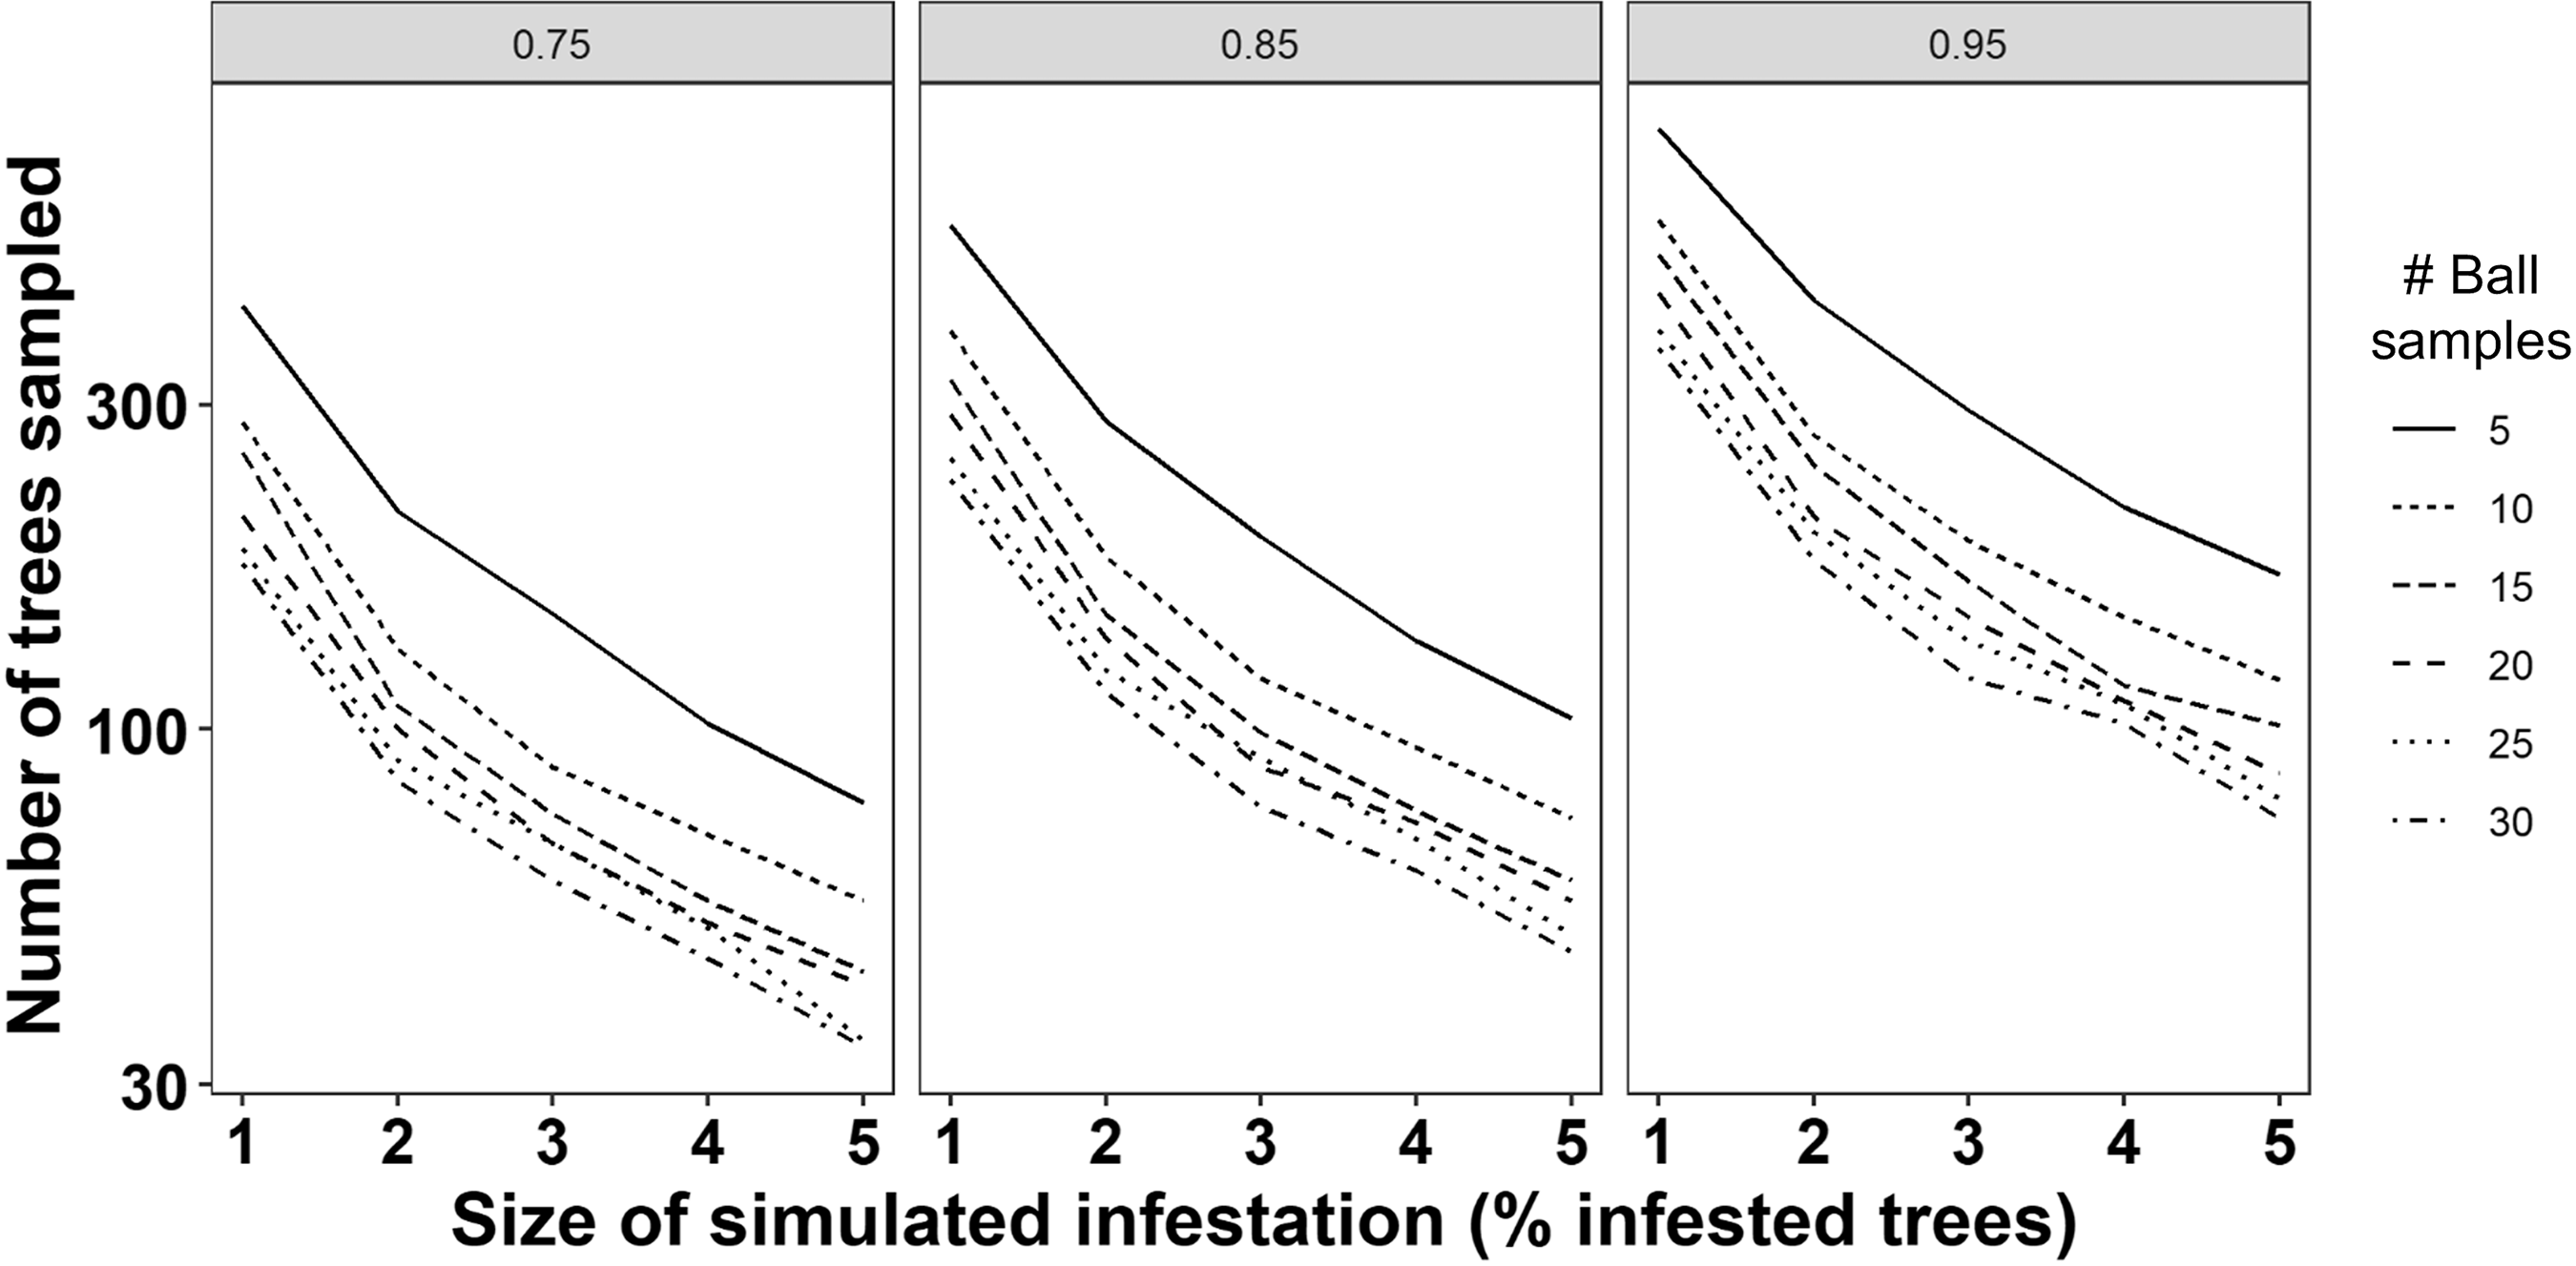
When the simulated A. tsugae infestation was small (I = 1%), achieving the desired precision required a large number of trees to be inspected (i.e., mean: 248 trees, or 12.4% of the 2000 trees in the simulated stands; Fig. 3). When the simulated infestation was greater (I = 2%), fewer trees were required (100–150) to achieve a survey precision of 0.75. That number was fewer than 100 trees when the simulated population was greater yet (i.e., I = 3%–5%; Fig. 3). In all simulations, varying the number of ball samples per tree (i.e., the probability of detection) had little effect, except perhaps for the lower-incidence simulations (i.e., I = 1% and 2%). There, increasing the number of samples per tree reduced the overall number of trees that needed to be sampled, although not appreciably so.
Trends in simulated number of Tsuga canadensis trees that would need to be sampled for Adelges tsugae wool using a ball sampling technique to achieve a survey precision of 0.75, 0.85, or 0.95 for stands with varying incidences of the insect. The probability of detecting the insect was varied in the simulations by changing the number of ball samples taken per tree. All simulations were done using UNIONSIM (Legg et al. Reference Legg, Fidgen and Ryall2014) assuming a stand of 2000 trees.

Simulations in which 10 ball samples were taken per tree took the least time to complete sampling (i.e., detect an infested tree). When the simulated incidence of A. tsugae was high (5%), the simulations revealed that sampling could be completed in up to 4–5 hours, but when that incidence was lower, a greater number of samples – and thus time (i.e., as much as 19–26 hours) – was required. A slight increase in incidence reduced total survey time by 6–16 hours; we calculated that a stand of 2000 trees could be surveyed in one or two work days.
Discussion
Determining the optimal sample size for detecting an invasive species is an important step when transitioning a new sampling method from research to practice. Typically, this involves an assessment of the sampling technique’s precision and of the costs (i.e., in time) associated with implementing it (Ruesink Reference Ruesink, Kogan and Herzog1980; Turgeon et al. Reference Turgeon, Pedlar, de Groot, Smith, Jones, Orr and Gasman2010; Legg et al. Reference Legg, Fidgen and Ryall2014; Stubbins et al. Reference Stubbins, Seiter, Greene and Reay-Jones2014). In the present study, we provided estimates of the performance of ball sampling by evaluating the probability of detecting adelgid wool with increasing ball samples per tree and with increasing number of trees per simulated stand, and we estimated the time needed to complete sampling as an estimate of the cost of sampling. Using an efficiency-based approach to evaluating precision and cost simultaneously (see Ruesink Reference Ruesink, Kogan and Herzog1980) was not possible because our dataset consisted of presence–absence data. Instead, we evaluated the number of samples (shots with the ball and number of trees sampled) needed to reach a survey precision of 0.75. Then, we evaluated the time to complete sampling the required number of trees in the stand using a sampling simulator. For example, from the fitted function, we determined that at least 20 samples were required to achieve the desired precision (Fig. 1). The probability of detecting A. tsugae with ball sampling increased with the number of samples taken, but even 30 ball samples per tree did not ensure a 100% probability of detection (Figs. 1–2). Taking more samples would provide one solution, but this would only improve the ability of the technique to detect lower-incidence A. tsugae infestations (Fig. 2). The simulations, based on our field observations, indicated that fewer samples can be taken per tree when attempting to detect an infested stand: this would reduce the time to complete sampling (Fig. 3). Specifically, taking 10 or 15 ball samples per tree can be done in a day or less of sampling when 2% or more of the hemlock trees in a stand are truly infested.
We adopted a survey precision of 0.75 (Karandinos Reference Karandinos1976) to identify the lowest possible sample sizes to detect A. tsugae using the ball sampling technique. This level is comparable to that used in some earlier studies (e.g., Binns et al. Reference Binns, Nyrop and van der Werf2000; Hodgson et al. Reference Hodgson, Burkness, Hutchison and Ragsdale2004; Costa and Onken Reference Costa and Onken2006). Reducing the survey precision would reduce the needed sample size. Moreover, a survey to detect A. tsugae could adopt a different desired precision; however, it is still advisable to take 25–30 ball samples per tree.
A visual sampling technique, where ovisacs are searched for on hemlock branch tips within hand’s reach at ground level, has been developed for A. tsugae. This survey also adopted a 0.75 precision level (Costa and Onken Reference Costa and Onken2006). Ostensibly, the recommended sample size using the visual survey technique (Costa and Onken Reference Costa and Onken2006) is less than what we determined for ball sampling. For example, the visual survey approach for a 2% infestation rate for hemlock recommends sampling at least 69 trees, compared to 131 trees recommended for the ball sampling approach. However, we have found that for every infested tree whose infestation can be detected with visual sampling, there are at least four infested trees whose infestations are not detected by visual sampling (Fidgen et al. Reference Fidgen, Fournier, Whitmore, MacQuarrie and Turgeon2019, unpublished data). These undetected infestations lead to a higher risk of false negatives, although they can often be detected by ball sampling. This is because ball sampling surveys the upper canopy, where infestations often begin, rather than relying on wool to be observable at ground level. Thus, visual sampling vastly underestimates the true stand incidence of infestation. If we adjust the estimated sample size for a true 2% stand incidence, the sample size for a visual survey also quadruples to 276 trees, or more than double that required for ball sampling.
In collecting the data for this study, we observed that clumps of hemlock trees can form a “super crown” where many individual trees contribute to one large crown. We previously recommended that surveyors should sample all parts of the crown to increase the odds of detecting wool (Fidgen et al. Reference Fidgen, Fournier, Whitmore, MacQuarrie and Turgeon2019). Experience from this study now leads us to also recommend that surveyors also take into account crown size when sampling hemlock. In this study, we avoided sampling from super crowns; however, surveyors in the field may need to adapt their approach when encountering this situation. One option would be to increase the number of samples per super crown to reflect the larger volume of foliage. The selection of sample locations is also an important consideration when sampling for A. tsugae because infestations often begin on edges of the stand (Costa and Onken Reference Costa and Onken2006). A good practice would be to sample such locations more frequently to increase the likelihood of finding infested trees.
The design of any surveillance or detection programme involves at least four basic dimensions: (1) having an insect stage that can be sampled; (2) knowing the number of sample units needed to detect the stage; (3) knowing when to sample the insect; and (4) having a method of sampling (Pedigo Reference Pedigo2002). Ball sampling was designed for detection of the wool-covered nymph and adult stages of A. tsugae (Fidgen et al. Reference Fidgen, Whitmore and Turgeon2016). The optimal time of year to sample for adelgid wool should coincide with the adult stage of the sistens generation, when wool is most abundant on trees (Fidgen et al. Reference Fidgen, Fournier, Whitmore, MacQuarrie and Turgeon2019). In the present study, we identified the number of samples to take from an individual tree and the number of trees to inspect in a stand to achieve a desired probability of detecting A. tsugae. We did not determine specific procedures for applying ball sampling in actual hemlock stands; however, the method can be used to substitute for other sampling techniques in existing approaches (e.g., Costa and Onken Reference Costa and Onken2006), which should increase the precision of those methods.
Acknowledgements
The authors thank Rob Johns for reviewing an earlier version of this manuscript. They also are grateful to Aaron Bose, Ron Fournier, and Isabelle Ochoa of Natural Resources Canada, Erin Bullas-Appleton and Julie Holmes of the Canadian Food Inspection Agency; Becky Sibner, Jon Liebherr, and Blake Wetherbee of Cornell University, and Janet Fidgen for their assistance with data collection. The authors also thank Cornell University, the United States Department of Agriculture Forest Service (Finger Lakes National Forest), the New York State Department of Environmental Conservation, and the Finger Lakes Land Trust for permission to use study sites. Funding for this project was provided by NRCan – Canadian Forest Service, SERG-I (Canadian Food Inspection Agency), and the Invasive Species Centre (Ontario Ministry of Natural Resources and Forests).