The nanoindentation test has been established as an important and powerful tool for characterizing the near-surface mechanical properties of solid materials. There has been extensive literature concerning the application of nanoindentation tests, and almost all the studies have centered on the determination of hardness, H, and elastic modulus, E, for the test materials.Reference Oliver and Pharr1–Reference Chowdhury and Laugier5 In this communication, a fresh application of nanoindentation tests in the film-substrate system will be reported. We will show below that the film thickness can be extracted by analyzing the nanoindentation load-displacement curve.
Similar to the conventional applications of the nanoindentation test, our study will also start from the analysis of the unloading portion of the indentation load-displacement curve. The most frequently used function to describe the unloading portion of the load-displacement curve is an empirical power law,Reference Oliver and Pharr1

where P is the indentation load, h is the indenter displacement (penetration depth), h f is the final displacement after complete unloading which should be determined by curve fitting, and β and m are empirically determined fitting parameters.
Although Eq. (1) has been soundly proven to be satisfactory for describing the experimental data, its physical meanings are still questioned. A widely recognized fact is that the average of the experimentally determined m value generally deviates from the theoretical value, m = 1.5, making it unreasonable to model the indenter approximately as a paraboloid punch. Several studies have been conducted to provide possible explanations for this deviation.Reference Woirgard and Dargenton6–Reference Pharr and Bolshakov8 More recently, Gong et al.Reference Gong, Miao and Peng9 proposed a new analytical approach for the description of the nanoindentation unloading data based on the conical indenter approximation and by introducing a term describing the residual contact stress effect into the classical solution of elastic contact theory. In this new approach, the unloading portion of the load-displacement curve is described with a quadratic polynomial,

where P 0 is the virtual load used to consider the effect of residual contact stress and α is a constant.
The applicability of Eq. (2) to the description of the nanoindentation unloading data for bulk materials has been verified by examining a series of brittle materials in which the residual contact stress effect is significant.Reference Gong, Miao and Peng9 In this letter, Eq. (2) will be used to describe the nanoindentation unloading data measured on titanium films on a glass substrate. It will be shown that Eq. (2) is also suitable for a film-substrate system and the film thickness can be extracted directly from the analysis of the variation of P 0 with the indenter penetration depth.
The materials used in this study were a series of titanium films of different thicknesses on a commercial soda-lime glass substrate. The test samples were prepared by a mid-frequency magnetron sputtering system (SP0806AS, Beijing Powertech Co. Ltd., Beijing, China) with dual pure titanium targets. Before the deposition of the films, after the chamber was pumped out up to 2.0 × 10⁻³ Pa, ultrasonically clean soda-lime glass substrates were sputtered by Ar+ for 10 min. During the deposition of the films, the working pressure was fixed at about 0.5 Pa, the target current was 10 A, and the bias voltage of the substrate was –100 V. The only parameter changed during deposition was the deposition time, which was in the range from 30 to 240 min, so as to obtain films with different thicknesses but the same quality. Under examination, all films were found to be dense without apparent pores under scanning electron microscope (Quanta 200 FEG, FEI, Hillsboro, OR) and homogenous with surface roughness (Ra) lower than 5 nm measured by a three dimensional white-light interfering surface profiler (Micro XAM-3D, Kla-tencor, Milpitas, AZ). Further, the critical loads of the samples measured by scratch tests were higher than 30 N, indicating high-quality films and excellent adhesions between the titanium films and glass substrates. The thicknesses of the films were measured by the Micro XAM-3D surface profiler in the range from 310 to 2100 nm.
The nanoindentation measurements were performed on the film-substrate samples, bare glass substrate and bulk titanium, respectively, with a Berkovich indenter using a fully calibrated Nano Indenter XP (Agilent, Santa Clara, CA). The system has load and displacement resolutions of less than 50 nN and 0.1 nm, respectively. In each test, the indenter was driven into the specimen surface (load half-cycle) under a load gradually increased until reaching the predetermined maximum displacement, h m. After being held at the peak load for 30 s, the indenter was unloaded gradually (unloading half-cycle). All the specimens were indented at a constant loading rate, 10 nm/s.
For the film-substrate samples and bulk titanium, the predetermined maximum indenter displacement, h m, ranges from 200 nm to 2500 nm. For the bare glass substrate, h m ranges from 200 nm to 1400 nm. For each h m, only one indentation was made.
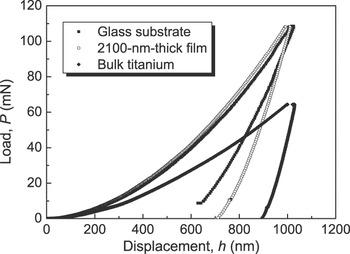
Figure 1 shows the representative indentation load-displacement curves measured in the present study.
Representative load-displacement curves obtained in the present study.

The unloading portions of the load-displacement curves measured in the present study were analyzed according to Eq. (2). Such regression analyses always yield correlation factors larger than 0.99, implying that Eq. (2) is sufficiently suitable for the description of the unloading behavior of nanoindentation tests with both bulk materials and the film-substrate system.
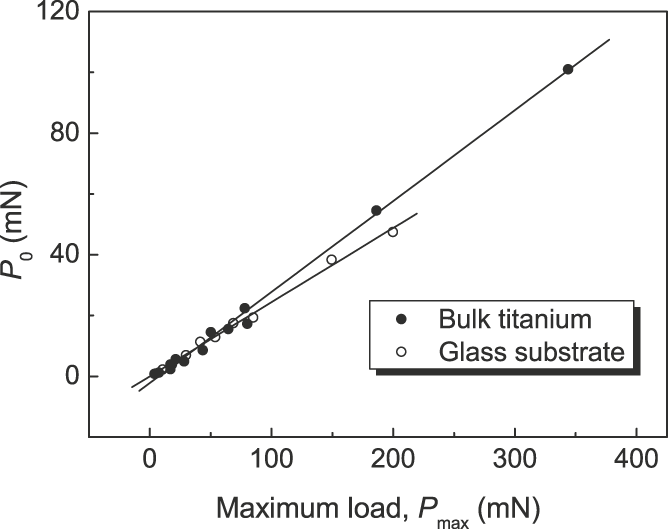
Figure 2 shows the variation of the best-fit value of the parameter P 0 in Eq. (2) with the maximum load, P max, for the two bulk materials, glass and titanium. As can be seen, P 0 increases with the maximum load, P max, and for each material, a linear relationship exists between P 0 and P max. The solid lines shown in Fig. 2 are the best-fit results obtained by regression analyses of the experimental data. The slopes of the best-fit lines are 0.2992 for titanium and 0.2441 for glass, respectively.
Variation of the best-fit value of P 0 with the maximum load, P max, for glass substrate and bulk titanium.
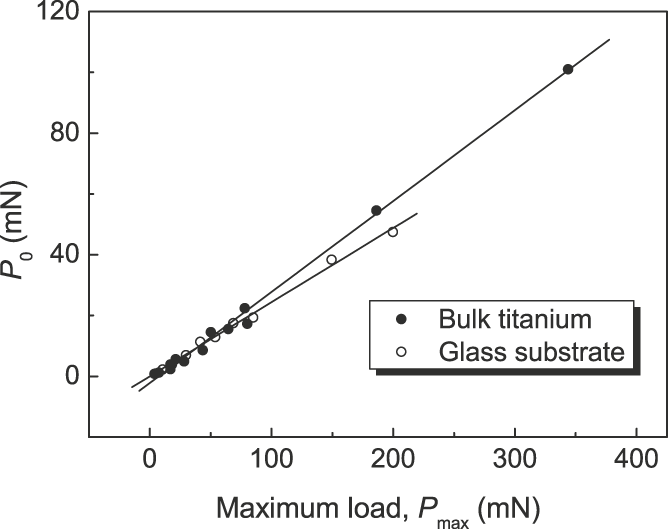
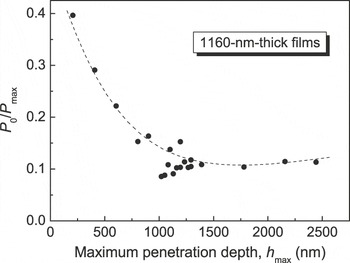
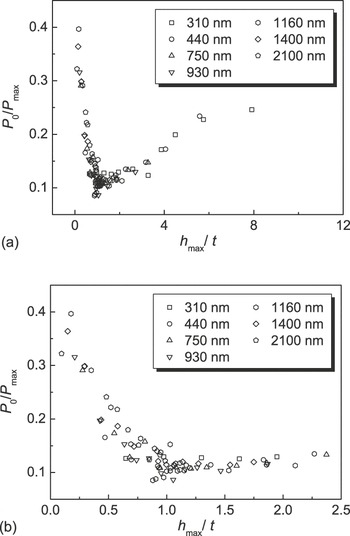
Figure 3 shows the variation of the best-fit value of P 0/P max with the maximum penetration depth, h max, for the 1160-nm-thick film. Clearly, the behavior of the film is rather different from those of the bulk materials. As the maximum penetration depth, h max, (correspondingly, the maximum load, P max) increases, P 0 decreases continuously until reaching a minimum and then, with a further increase in h max, tends to increase gradually. Similar experimental phenomena were also observed for other films with different thicknesses. Figure 4(a) summarizes the results in a normalized plot, where P 0/P max is plotted as a function of h max/t (where t is the film thickness) using the experimental data obtained for all the tested films.
Variation of the best-fit value of P 0/P max with the maximum penetration depth, h max for 1160-nm-thick film.

P 0/P max versus h max/t for film-substrate samples with different film thicknesses.

The experimental results shown in Figs. 3 and 4 may be explained by considering the physical meanings of the parameter P 0 in Eq. (2). For bulk materials, P 0 was suggestedReference Gong, Miao and Peng9 to be related to the effect of residual contact stress resulting from the mismatch between the plastic zone beneath the indentation and the surrounding elastic matrix. In other words, P 0 may be considered as a revisionary term for the applied indentation load, P. For the film-substrate system, however, the situation is somewhat complicated. One may expect that at least another kind of residual stress would result from the mismatch between the film and the substrate. This residual stress acts around the interface of the film and the substrate, and would play a significant role in the unloading behavior during nanoindentation tests. Thus, for the film-substrate system, P 0 may be a measure of the synergistic effect of the residual contact stress and the residual interface stress.
An indirect support for the above analysis can be obtained by comparing the experimental results for both the glass substrate and the film-substrate system. Note that when the penetration depth, h max, is sufficiently large, the effect of residual interfacial stress would be ignored and the corresponding P 0/P max − h max/t relation would approximately reflect the behavior of the pure glass substrate. As can be seen in Fig. 4, P 0/P max tends to an asymptotic value of 0.25 when h max/t becomes large enough. This asymptotic value is in good agreement with the value of pure glass, 0.2441. By the way, it seems to be unreasonable to conduct a similar analysis for the behavior of small h max/t due to the surface effect, which has been generally observed in nanoindentation tests for many materials.
It is of interest to note that, as shown in Fig. 4(a), all the data points fall along a “master curve”, indicating that the minimum of P 0/P max always occurs at a fixed relative penetration depth, h max/t. This can be seen much clearer from Fig. 4(b), the enlargement of Fig. 4(a). An attractive feature of Fig. 4(b) is that the characteristic relative penetration depth corresponding to the minimum of P 0/P max is h max/t = 1, that is, the minimum of P 0/P max always occurs at the interface between the film and the substrate.
It seems unsurprising that a minimum of P 0/P max occurred at h max = t. It is well known that residual stress forms within the interfacial layer between the film and the substrate. Although the distribution of such a residual stress would be rather complex, there is reason to believe that a maximum of the residual interfacial stress would occur at, or at least very near to, the interface between the film and the substrate. On the other hand, as shown in Fig. 2, P 0 increases monotonically with P max for both bulk titanium and glass substrate. Thus, one can infer that the minima of P 0/P max shown in Figs. 3 and 4 would correspond to the extreme value of the residual interfacial stress.
Based on the above analyses, a simple and convenient method to determine the film thickness by nanoindentation tests may be proposed. This method starts from the analysis of the unloading portion of the measured nanoindentation load-displacement curves according to a quadratic polynomial, Eq. (2). Then the best-fit value of the parameter P 0 is plotted as a function of the maximum penetration depth, h max. Such a P 0 versus h max curve may pass through a minimum, and h max corresponding to this minimum would be equal to the film thickness value.
Further experimental studies are now being conducted on other film-substrate systems to verify the universality of the conclusion obtained here.
ACKNOWLEDGMENT
The authors would like to thank the financial support from Key International Cooperation Project, Ministry of Science and Technology, China (Grant No. 2006DFB51260).