1 Introduction
Since 1976, the policy process in Portugal has been dominated by a competition between socialists and social democrats, which are the groups that have been alternating in power for nearly equal proportions of time. 1 The Socialist Party (PS) ruled the country for a total of 18 years after the first elections in April of 1976. Within the same period, the Social Democratic Party (PSD) ruled the country for a total of 21 years. 2
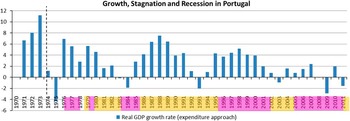
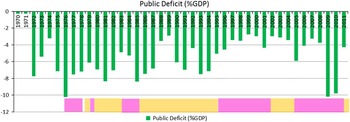
The current analysis will show that, for almost four decades, the political differences between the two main political parties had no impact on the public finances and economic performance of Portugal. That is, actual long-term policy outcomes are indifferent to the differences in the political ideologies and discourse of the socialists and the social democrats. Within this period, both parties have been equally associated with (i) cycles of growth, stagnation and recession (see Figure 1) and (ii) continuous budget deficits (see Figure 2).
Growth, stagnation and recession and ruling parties (%GDP). Sources: GDP data (Ref. 3), Ruling Parties (Ref. 4). Note: Years in the darker shade correspond to periods ruled by a Socialist government. Years in the lighter shade correspond to periods ruled by a Social Democrat government. The period 1970–1974 (until 25 April) corresponds to the last years of Salazar’s dictatorship. The period 1974–1976 corresponds to the so-called ‘Provisory Governments’ which ruled the country prior to the 1976 new Constitution. The second half of 1978 was ruled by an independent government.


This research adopts two of the most important public finance variables, budget deficit and public debt, as proxy variables for the country’s performance to test the hypothesis that political parties’ differences have no impact in fiscal outcomes. Testing whether political differences impact the country’s performance is useful to shed light on the merits of a policy process that is based on competitive intrigue, enmity and confrontation between the two parties. Revenues are not considered to be proxies for performance (i.e. a dependent variable) in this analysis because tax policies are a much more resilient variable over time.
While the problems of inter-parties’ competition in the policy process have been highlighted, the merits of an alternative approach still need to be explained. Almond and VerbaReference Almond and Verba 5 argue that civic political culture is what a country needs to advance its democratic society’s political structure. More specifically, they consider political culture to be the element that connects individual attitudes with the overall political system structure. Of the ten key characteristics of a civic political culture identified by these authors, at least half of these refer directly to political parties’ behaviour: (i) expectation of fair treatment from government authorities; (ii) emotional involvement in elections; (iii) tolerance toward opposition parties; (iv) valuing of active participation in local government activities, parties and in civic associations; (vi) civic cooperation and trust.
Since Almond and Verba,Reference Almond and Verba 5 several other authors have emphasized the key role of cooperation to promote development and advance democratic organization, e.g. ColemanReference Coleman 6 with the concept of social capital; OstromReference Ostrom 7 with the idea of collective action; NordhausReference Nordhaus 8 with the political business cycles models; PutnamReference Putnam 9 with the concept of networks of civic engagement; WrightReference Wright 10 with the non-zero sum logic of human destiny; and HardinReference Hardin 11 with the role of trust and reciprocity in solving social dilemmas.
The next section explores the literature capable of explaining the relationship between deficits, debts and partisan politics. Special attention is paid to authors who focus on variables that are most relevant to the Portuguese case. Section 3 details the techniques, variables and datasets used to test our research hypothesis. This section also offers some preliminary results regarding the role of inter-party differences in a country’s performance, while analysing the main results obtained from this research regarding a country’s performance, Section 4 pays special attention to the distinction between external macroeconomic effects and domestic politics. Section 5 concludes with the implications of the paper’s findings for the democratic process and suggestions for future research as well.
2 Deficits, Debts and Partisan Politics: An Overview of the Literature
There already exists a substantial literature on the differences in policies applied by different parties. CusackReference Cusack 12 (1997) studied a set of 14 OECD countries for the period 1961–1991, but did not include Portugal because it was not a democracy during part of the period. MourãoReference Mourão 13 found that the long-term determinants of the Portuguese public expenditure (1947–2002) are the number of unemployed, the number of public employees (i.e. the size of the public sector), the rate of openness of the economy, and the real current transfers per capita. However, Mourão left unanswered the following question: are there any partisan-biased differences in the expenditure policy in Portugal?Reference Mourão 13 Our research aims at answering this question.
Our review of the literature (detailed below) identified four main topics on the issue of the influence of partisanship on public finances: due to differentiated redistributive policies, due to voters’ attraction, due to different reactions to exogenous forces such as globalization, and due to political business cycles.
2.1 Partisanship and Redistributive Policies
There are several theoretical models that try to explain partisan-biased differences in public finance, especially related to redistributive policies.
Usually, the number of unemployed suggests that an increase in expenditure is more associated with socialist-led governments. This may be the result of the commitment of leftist parties to the Keynesian paradigm of expanding government programmes and the welfare state,Reference Alesina, Cohen and Roubini 14 , Reference Hahm, Kamlet and Mowery 15 which is pushed by a relatively more economically vulnerable electorate.Reference Cusack 12 CowartReference Cowart 16 and CarlsenReference Carlsen 17 argue that leftist governments are far more responsive to problems of unemployment than are right-wing governments that foreswear interfering with the self-adjusting ‘invisible hand’ of the market.Reference Cusack 18
CarlsenReference Carlsen 17 also argues that right-wing parties are more prone to pro-cyclical policies by which fiscal policy is tightened as demand slackens and unemployment rises. If real current transfers per capita are associated with economic redistribution processes, then, for the same reasons described above, this variable seems to be more associated with left-leaning governments.
According to Meltzer and Richard,Reference Meltzer and Richard 19 the redistributive role of the government is determined by voters’ demand for income redistribution. Voters with income below (above) the mean will favour higher (lower) taxes and more (less) redistribution. Thus, under universal suffrage and majority rule, a major determinant for explaining the fact that the real government debt per capita increases is income inequality.
Right-wing governments try to avoid (significant) budget deficits because they believe that structural deficits raise interest rates, impede investment, reduce national savings, slow down long-run economic growth, and thus undermine the social democratic supply-side economic policy.Reference Boix 20
2.2 Public Sector and Voters
The size of the public sector follows the Leviathan hypothesisReference Brennan and Buchanan 21 according to which politicians are politically unconstrained agents who aim to maximize their power and the rents associated with holding office. In this context, power and rents are directly associated with the size of the public sector, and both socialists and democrats, who have been alternating in power in quasi-equal proportions since 1976, could equally be responsible for the increase in public expenditure (i.e. the Leviathan hypothesis emphasizes the parties’ behaviour homogeneity). Other authors point to the principle-agent dilemma as the justification for an inbuilt bureaucratic preference against any reduction of acquired rights by public employees and as supporting ever larger sizes of public agencies in a large public sector such as that of Portugal.Reference Frey and Pommerehne 22 , Reference Castles 23
2.3 Other Mediating Factors: Competition and Globalization
Several authorsReference Besley, Persson and Sturm 24 , Reference Padovano and Ricciuti 25 suggest that party competition improves economic outcomes but what they do not discuss is how outcomes could improve further with collaborative approaches to the policy process. In addition, the baselines of their analyses are situations of monopoly of power by one party, which obviously cannot be compared with the multiparty framework studied in this paper.
Given the competitive setting that has been driving the political confrontation between socialists and social democrats over the past 39 years, the Partisan modelReference Boyne 26 , Reference Solé-Ollé 27 can also be relevant for this analysis. According to this theoretical framework, increased competition between political forces reduces deficits for left-leaning governments and increases them for right-leaning governments (i.e. the Partisan hypothesis emphasizes the heterogeneous parties’ behaviour). This result contradicts previously analysed theoretical principles that point to higher public expenditure in socialist-led governments.
Similar to the Partisan model, which introduces political competition as a mediating factor between ideology and policy outcomes, the rate of openness introduces macroeconomic interdependence as a mediating factor. CarlsenReference Carlsen 17 argues that parties on the left will follow a counter-cyclical expansionary fiscal policy when demand slackens and a contracting one when demand surges.
Garret and LangeReference Garrett and Lange 28 argue that the ever-greater openness of national economies and the related interdependencies decrease the relevance of the governing parties’ ideology; i.e. there has been a convergence of right and left with no notable distinctions between their fiscal policies. Because of interdependence,
[G]overnments no longer possess the autonomy to pursue independent macroeconomic strategies effectively, even if they were to seek to do. In anything but the short run, the fiscal and monetary policies of governments of the left and the right should converge. (Ref. Reference Garrett and Lange28, p. 543)
Other authors agree that the economic demands generated by the global financial markets have weakened any linkage between partisanship and fiscal policy.Reference Artis 29 – Reference Helleiner 33 This applies even more to a small, open economy such as the Portuguese.
Contradicting the rate of openness-driven convergence argument, GarrettReference Garrett 34 , Reference Garrett 35 shows that strong left party governments with the presence of strong labour unions run larger deficits under the conditions of great capital mobility and trade because those governments try to mitigate the market dislocations that are experienced by their populations in the integrated international economy.
2.4 Non-partisanship and Political Business Cycles
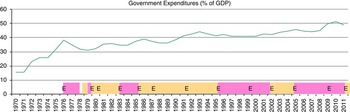
Albeit from a different perspective, Nordhaus,Reference Nordhaus 36 Frey and SchneiderReference Frey and Schneider 37 and Rogoff and SibertReference Rogoff and Sibert 38 argue that public expenditure drivers are more associated with the structural components of democratic models than with the differences in party ideology. For these authors, the temporal proximity to electoral moments is what explains public expenditure’s cyclical peaks. In fact, as illustrated by Figure 3, there seems to exist a temporal ‘coincidence’ in Portugal between election years and expenditure peaks.

NordhausReference Nordhaus 8 , Reference Nordhaus 36 explains these cyclical peaks with his political business cycles (PBC) theory. According to this author, these peaks result from the opportunistic behaviour of political incumbents who strategically change public expenditure in pre-electoral periods to signal competence (i.e. the ability to produce a given level of government services with less revenue) to voters and thus increase their chances of re-election. This opportunistic-cycles approach departs from the models of economic performance that are explained by political ideology and ideological cycles discussed earlier. For Nordhaus, partisan effects are of secondary importance to opportunistic behaviour.
Advocates of PBC argue that, in facing choices between present and future welfare, the behaviour of democratic political systems is biased against future generations.Reference Nordhaus 8 , Reference Coelho, Veiga and Veiga 40 Elections are viewed as a source of political instability, and they affect growth through the shortening of governments’ horizons and the disruption of long term economic policies that are conducive to a better economic performance.Reference Aisen and Veiga 41
Veiga and VeigaReference Veiga and Veiga 42 find strong evidence for opportunistic cycles at the municipal expenditure level in Portugal and very little evidence of ideological cycles between left-wing oriented incumbents and right-wing ones. Coelho et al.Reference Coelho, Veiga and Veiga 40 also find strong evidence of PBC in municipalities’ employment in Portugal.
2.5 In Summary
The literature that has been explored does not clearly answer the question raised at the beginning of this section: do partisan politics matter for public finances in Portugal? All types of answers – yes, no and maybe – have been found for this question. Studies about Portugal, where evidence for PBC was found and/or no evidence for ideological/partisanship cycles was found, do not adopt the whole country as their level of analysis, do not cover the entire period of democracy in Portugal, and do not clarify whether there is any partisanship effect in the amplitude of the cycle.
Next, we will test whether differences between different parties in charge of the government make any difference for the Portuguese public deficit and public debt.
3 Methodology
To test our research hypothesis, we use descriptive statistics and bivariate analyses that will provide initial insights into the role of inter-party differences in fiscal outcomes and the country’s performance. In this context, descriptive statistics and empirical evidence will also dispel some myths circulating in the public opinion regarding the role of parties in fiscal performance.
3.1 Variables: Datasets and Sources
Our first methodological step was to collect data for some of the most important variables that are associated with a country’s performance. We collected yearly data since 1974 43 from official and available sources for the following socio-economic variables:
-
∙ Public expenditure (% GDP)
-
∙ Public revenue (% GDP)
-
∙ Number of public employees
-
∙ Public investment (% GDP)
-
∙ Real GDP
-
∙ Budget deficit (i.e. public expenditure minus public revenue as a % of GDP) 44
-
∙ Public debt (% GDP)
-
∙ Unemployment rate
-
∙ Number of unemployed people
Data for the following electoral and political variables were also collected for the same period:
-
∙ Electoral (legislative and municipal elections) year
-
∙ Number and share of seats belonging to left-wing parties in the Portuguese National Parliament
-
∙ Year of left-wing majority in the Portuguese National Parliament
-
∙ Tenure duration
Several sources of information were used to build the time series for these variables. For public expenditure, public revenue, public investment, real GDP, openness rate, unemployment rate, and the number of unemployed people, we used PinheiroReference Pinheiro 45 for data until 1995 and the International Financial Statistics 3 for data from 1995 to 2012. NevesReference Neves 46 was the source for the number of public employees for data before 1994. For the period that followed, the information was collected from the Portuguese Institute for Employment and Professional Training (IEFP). 47 For the Portuguese public budget deficit and public debt, the data source was the IMF (2012). 3 The data for electoral years that detail the nature – municipal or legislative – of the popular consultation, was provided by the official National Electoral Commission (CNE). The information about the ruling parties at the national government level for each year, the breakdown of the number of Parliamentary seats between the left- and right-wing parties, and the tenure duration of each government was collected from PORDATA. 48
3.2 Descriptive Statistics
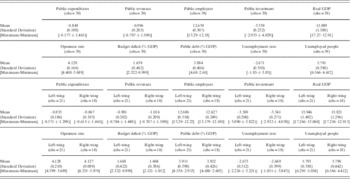
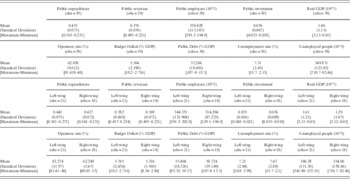
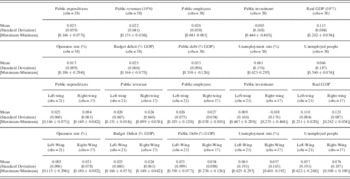
To discuss our first descriptive statistics, we built two tables (see Tables 1 and Table 2). Each table shows the mean, standard deviation, maximum values, and minimum values for each of the previously introduced socio-economic variables and for the entire study period (1974–2012, N=39). In addition, these statistics have also been analysed within both those sub-periods in which left-wing parties held the majority of the seats in the National Parliament (N=18) and those in which right-wing parties had the majority of the seats (N=21). 49
Descriptive statistics, log scale (Portuguese data, 1974–2012).

Descriptive statistics, absolute scale (Portuguese data, 1974–2012).

Table 1 shows the descriptive statistics for the socio-economic variables expressed in logarithmic form, and Table 2 shows the same statistics for the raw variables.
A preliminary inspection of Tables 1 and 2 allows us to state that the years in which left-wing parties ruled the country exhibit higher values for the following variables (if compared with the years ruled by right-wing parties):
-
∙ Public expenditure (% GDP)
-
∙ Public revenue (% GDP)
-
∙ Number of public employees
-
∙ Public investment (% GDP)
-
∙ Real GDP
-
∙ Openness rate
-
∙ Budget deficit (% GDP)
-
∙ Public debt (% GDP)
The exceptions to this statement were found for the unemployment rate and the number of unemployed people. For these variables, the years ruled by left-wing governments exhibited lower values than the years ruled by right-wing governments.
Table 3 shows the same descriptive statistics that were analysed above but for the yearly growth rates of the studied variables.
Descriptive statistics, yearly growth rates (Portuguese data, 1975–2012).

Note: The yearly growth rate for two consecutive values of the variable X (X t , X t+1) is given by the formula (X t+1 – X t )/(X t )
Table 3 suggests that the years in which there was a right-wing majority in the Portuguese Parliament are characterized by higher growth rates for the following variables (if compared with the years that are associated with left-wing governments):
-
∙ Public expenditure (% GDP)
-
∙ Public revenue (% GDP)
-
∙ Public employees
-
∙ Real GDP
-
∙ Openness rate
-
∙ Unemployed
In contrast, the years that are associated with left-wing governments tend to have higher growth rates for the following variables (if compared with the years that are associated with right-wing governments):
-
∙ Public investment (% GDP)
-
∙ Budget deficit (% GDP)
-
∙ Public debt (% GDP)
-
∙ Unemployment rate
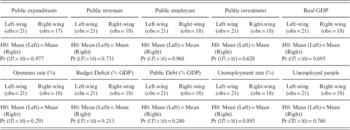
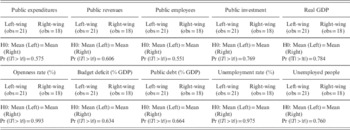
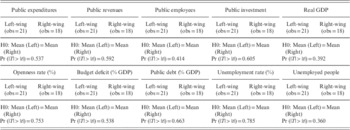
However, these preliminary results require further inspection. Many of the comparisons arguably are commonplaces in the Portuguese media. However, a more accurate assessment of these commonplaces requires data variability and that the different number of observations collected for each political wing are factored in using more complex approaches. A commonly used technique to address these limitations is the non-parametric Mann-Whitney U-test, which is similar to the Two-sample t test with unequal variances. This type of test allows the equality of two means to be tested (in our case: the mean observed for the years that were ruled by left-wing parties and the mean observed for the years that were ruled by right-wing parties). The rejection of the null hypothesis (of equal means) can be interpreted as the existence of significant differences between the financial performances that are assumed by the different Portuguese political wings.
Tables 4, 5 and 6 exhibit the asymptotic significance (2-tailed) p-values for the variables of this study. 50 Because p-values lower than 0.100 were not found, it cannot be concluded that there are significant differences in our variables vis-à-vis the party wing in power.
Two-sample t test with unequal variances (Yearly growth rates for Portuguese data, 1975–2012).

Note: The yearly growth rate for two consecutive values of the variable X (X t, X t+1) is given by the formula (X t+1 – X t )/(X t )
Two-sample t test with unequal variances (log values for Portuguese data, 1974–2012).

Two-sample t test with unequal variances (absolute values for Portuguese data, 1974–2012).

In conflict with popular beliefs and other misconceptions of the role of political parties in modern democracies, our results find no evidence for a differentiated impact of the Portuguese parties on the country’s macroeconomic and fiscal performances. This is the case for all variable transformations performed: absolute values, log and yearly growth rates.
4 Empirical Models and Bivariate Analysis: The Irrelevance of Inter-party Difference
The next step is to build two models to test and discuss the hypothetical influence of political wings on the two macroeconomic variables that are most commonly used to describe country performance: the budget deficit and the public debt (each of which are measured both as a percentage of GDP and as yearly changes). The results obtained from the Mann-Whitney U-tests suggest that there are no differences among the ruling parties when considering each variable in isolation. However, we also need to evaluate this relationship by considering multivariate regressions. Therefore, the following two equations will be estimated (equation (1) for public budget deficit and equation (2) for public debt):
 $$budget_{t} =const{\plus}A\,{\asterisk}\,X_{t} {\plus}B\,{\asterisk}\,Elect_{t} {\plus}C\,{\asterisk}\,Polit_{t} {\plus}e_{t} $$
 $$debt_{t} =const{\plus}A\,{\asterisk}\,X_{t} {\plus}B\,{\asterisk}\,Elect_{t} {\plus}C\,{\asterisk}\,Polit_{t} {\plus}e_{t} $$
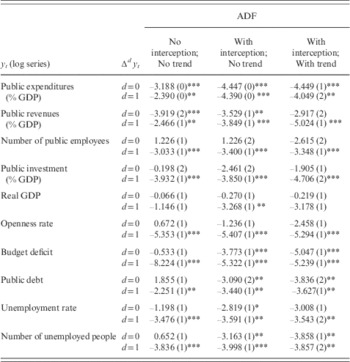
On their right-hand side, both of these equations use a column-vector of socio-economic determinants that is suggested by the literature (X t , with the estimated coefficients represented by the line-vector A), a column-vector of electoral determinants (Elect t , with the estimated coefficients represented by the line-vector B), and a column-vector of political-wing variables (Polit t , with the estimated coefficients represented by the line-vector C). The errors are assumed to follow white-noise processes. These variables follow authors who have studied the budget deficit and the public debt in PortugalReference Mourão 13 and authors who have analysed the influence of partisan politics on national public finances.Reference Cusack 12 , Reference Cowart 16 , Reference Carlsen 17 Table A1 exhibits the results from the ADF tests on the stationarity of these series.
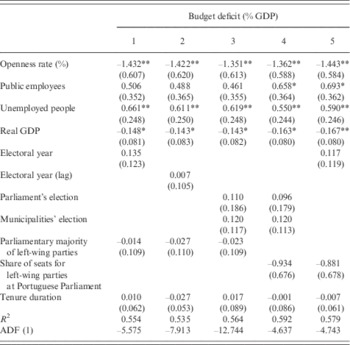
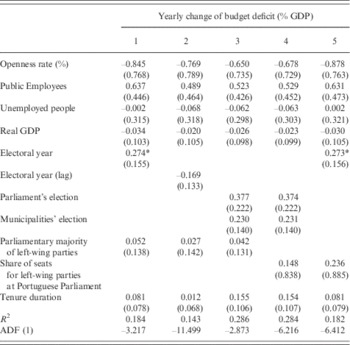
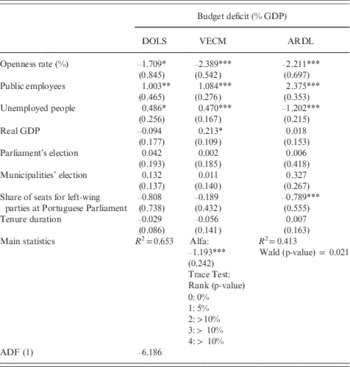
Tables 7 and 8 show the coefficients that were estimated by the Static Ordinary Least Squares for the various specifications of our models by considering the two transformations of the Portuguese public deficit – logs and yearly growth rates – and their stochastic explicative variables. Table 9 shows the coefficients that were estimated for the log variables but now using different estimators – the Dynamic Ordinary Least Squares (DOLS), 51 a Vector of Error Correction Models (VECM), and a model derived from autoregressive distributed lags (ARDL).Reference Pesaran, Shin and Smith 52 These estimators lead to a better understanding of the nature of the non-stationarity of the variables, and their estimates provide a clearer idea of the direction and significance of the influence of our explicative variables on public debt and the public deficit.
SOLS results for Portuguese budget deficit (1974–2012).

Constant estimated but omitted in the table. Standard errors between parentheses. Significance levels: 1%, ***. 5%, **. 10%, *. ADF (1): Augmented Dickey-Fuller test for unit root on the residual series.
SOLS results for Portuguese budget deficit (1974–2012).

Constant estimated but omitted in the table. Standard errors between parentheses. Significance levels: 1%, ***. 5%, **. 10%, *. ADF (1): Augmented Dickey-Fuller test for unit root on the residual series.
DOLS, VECM and ARDL results for Portuguese budget deficit (1974–2012).

Constant estimated but omitted in the table. Standard errors between parentheses. Significance levels: 1%, ***. 5%, **. 10%, *. ADF (1): Augmented Dickey-Fuller test for unit root on the residual series.
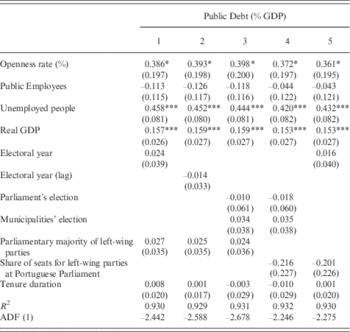
SOLS results for Portuguese Public Debt (1974–2012).

Constant estimated but omitted in the table. Standard errors between parentheses. Significance levels: 1%, ***. 5%, **. 10%, *. ADF (1): Augmented Dickey-Fuller test for unit root on the residual series using one lag of the residual series.
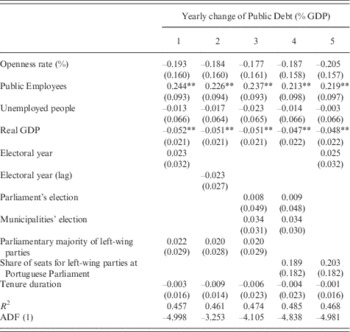
SOLS results for Portuguese Public Debt (1974–2012).

Constant estimated but omitted in the table. Standard errors between parentheses. Significance levels: 1%, ***. 5%, **. 10%, *. ADF (1): Augmented Dickey-Fuller test for unit root on the residual series.
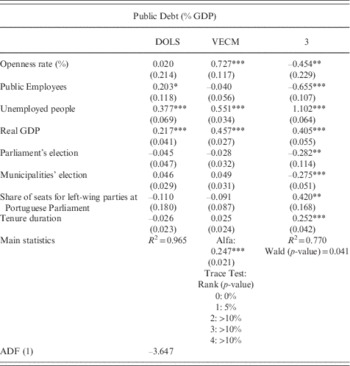
DOLS, VECM and ARDL results for Portuguese Public Debt (1974–2012).

Constant estimated but omitted in the table. Standard errors between parentheses. Significance levels: 1%, ***. 5%, **. 10%, *. ADF (1): Augmented Dickey-Fuller test for unit root on the residual series.
Causality tests on budget deficit.

Causality tests on public debt.

To measure the influence of political wings, three alternative variables have been introduced in the model:Reference Castles 23 , Reference Cameron 53 , Reference Elkins 54
-
∙ A binary variable that signals each year in which there was a majority of left-wing parties in the national parliament.
-
∙ The share of seats for left-wing parties in the Portuguese parliament.
-
∙ Length of tenure.
We recall that the descriptive statistics of these variables are shown in Table 1 (log scale) and in Table 3 (yearly growth rates).
Finally, we want to analyse the statistical significance of the political wings on the Portuguese budget deficit and on the Portuguese public debt. To do this, we are going to use the traditional binary variable that identifies those years that were ruled by a left-wing coalition of parties as ‘1’ and those years that were ruled by a right-wing coalition of parties as ‘0’. Additionally, we are going to use the share of seats that belong to left-wing parties in the national parliament. Therefore, the null hypothesis of the statistical non-significance of the estimated coefficients for these political variables shall be interpreted, if accepted, as the confirmation of the irrelevance of the parties’ differences for public finance management in Portugal. We control these political variables using the tenure length, which is measured as the number of years that the incumbent party holds the office. This is a common procedure for two main reasons. First, the procedure recognizes that the tenure length can be used to control for the awareness effect that is more visible in governments that have been in power for more years,Reference Ferris and Moia 55 i.e. more mature governments tend to have more knowledge of national public finances. Second, the procedure identifies that more mature governments have a greater propensity to run consolidation programmes on national public finances than do governments with less experience.Reference Merlo 56 , Reference Désiré 57
Tables 10–12 show the results for Portuguese public debt as the dependent variable. Table 10 shows the results for the SOLS estimation on the logs of our stochastic variables and our set of binary independent variables. Table 11 shows the results for the SOLS estimation using the yearly growth rates of the stochastic variables and our set of binary independent variables. Table 12 shows the DOLS, the VECM and the ARDL results as done for the budget deficit in Table 9 but now using public debt as the dependent variable.
Briefly analysing Tables 10–12, we observe again that electoral moments or political wings do not influence Portuguese public debt. However, we find again that Portuguese public debt (as a share of the national income) tends to react to the number of unemployed people (which confirms the dependence of the structure of the Portuguese Welfare State) and to the real GDP per capita (i.e. to the economic cycle of the country).
Again, these results are supported by Meltzer and Richard,Reference Meltzer and Richard 19 Garret and Lange,Reference Garrett and Lange 28 PetersReference Peters 30 and ScharpfReference Scharpf 31 who have identified that the national public finances of highly globalized and small economies are driven mostly by socio-economic dimensions and not by inter-parties differences.
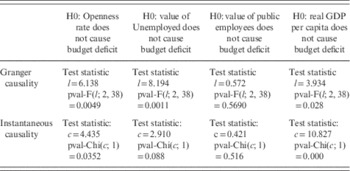
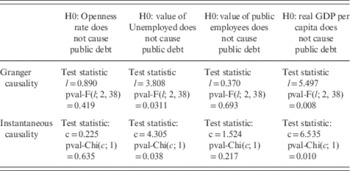
To test the causality of the determinants that were found to be statistically significant, we ran Granger Causality tests and Instantaneous Causality tests using JMulti. Table 13 reports the results for the budget deficit and for public debt.
As reported in Table 13, we confirm that there is a statistically significant causal effect of the Portuguese trade openness, the number of unemployed people, and the real GDP per capita on the public budget deficit. This again shows that the past changes in the Portuguese level of globalization, its labour market and its economic growth induce future changes in the Portuguese public budget deficit. Although it is significant in the cointegration equation, the number of Portuguese public employees is not shown to anticipate the budget deficit. To interpret these results, we view this as a case of short-term causation that tends to lose statistical significance in the long-term. Table 14 also confirms that the past changes in the Portuguese number of unemployed people and GDP lead to subsequent changes in the Portuguese level of public indebtedness.
We recognize that these results have pioneering implications for the study of the relationship between structural economic and social realities, electoral moments, political wings and public finances in Portugal. They clarify which factors truly influence the Portuguese public budget deficit and the Portuguese level of public debt.
5 Conclusions and Further Research
There is no empirical evidence to support the hypothesis that differences between political parties matter for the public finances or for the overall financial and economic performance of Portugal. It is simply not true that one party is better for the country than the other, at least not in the last 39 years, which is the entire period of democracy in the country. ParkerReference Parker 58 finds similar results for the US when comparing the performances of the Republican Party and the Democratic Party during the period 1949–2005.
The policy processes and political rhetoric based on competitive intrigue, enmity and confrontation between parties keep promising differentiated economic and social outcomes depending on who is in power: PS or PSD (either alone or in coalition). While commonplace in popular belief and partisanship, this research found no statistical significance to support this differentiated effect. Using various techniques and procedures such as graphic analysis, descriptive statistics, and Mann-Whitney tests, it cannot be claimed that the years that were ruled by one of the Portuguese political wings produced significantly different outcomes than the years that were ruled by the opposite political wing. Future research could focus on whether these undifferentiated results between parties also apply to the composition of expenditures.
This conclusion applies not only for the main public finance variables studied – budget deficit and public debt – but also for the GDP growth rates, unemployment rates, size of the public sector and public investment. These indicators have performed indifferently to the political party differences.
Three main strong implications for Portuguese democracy and the policy process can be derived from these results. First, the party differences do not matter but the parties matter. In a democracy, political parties try to build unique identities and support bases to be elected for office. While these differences should be emphasized during the official electoral campaign periods, outside these periods, political leaders should behave according to a certain ethical code that would allow them to embrace legislation from a national priority standpoint and not from a competing democracy paradigm. For example, it was always possible during the three times that the IMF intervened in the country since 1974, and during the Euro process, to have a broad inter-party political pact regarding institutional development and international commitment. Future research could try to understand why these domestic pacts are rare in Portugal without international intervention. Why do specific configurations of situations and conditions increase or decrease political cooperation? What institutional changes would enhance the likelihood of cooperation?
Second, Portugal, and modern democracies in general, need new institutional designs that aim at creating a better incentives structure to foster collaboration between political parties. The central theme here is the gains from association that are achieved when politicians are able to develop trust and reciprocity, and coordinate action. If politicians are the legitimate representatives of the people, the question is how to sustain agreements that counteract individual temptations to select short-term self-interested actions when all parties would be better off if each party selected actions that lead to higher collective and individual returns. Short-term competing approaches to the policy process, as illustrated by the intensity of political quarrels that every day are brought to us in several formats (e.g. the press, social media, political discourse), consume too much of the energy, attention and political vision that a long-term strategic debate for the country would require from all group and individual actors.
Third, collaboration and coordinated action require the development of trust and reciprocity between political parties. As empirically shown, the current schemes of adversarial democracy have failed in Portugal and, apparently, in other southern European countries such as Spain, Italy and Greece. Trust building is an evolutionary process of multiple iterations through which parties generate cognitive systems and decision rules that lead to outcomes that are greater than those of alternative designs over time.
Party differences, ideology and identity matter for the diversity of political ideas, the engagement of civic participation in the lives of communities and the advancement of societies. What the results of this research show is that, because neither of the two major parties has been better for the country than the other, differences should be reconciled for policy enhancement and should not undermine the collective good. Ideas should still compete in the political arena, but collaboration that is driven by an ethics of trust and reciprocity and/or the need for a broader social and political support base should be the norm in policy design and implementation. Moving forward, the focus should be on leveraging the overlaps between the parties’ agendas and negotiation skills.
Two last suggestions are given for further research that can be derived from this study. The first is the role that the regulation of the activities of political parties could play in fostering collaborative work between political leaders. Indeed, the failure to cooperate for mutual benefit does not always signal ignorance or irrationality. Game theorists explain in various ways how contextual conditions such as history, rules and norms within which games are played, influence players’ behaviour and outcomes. NorthReference North 59 , Reference North 60 and OstromReference Ostrom 7 , Reference Ostrom 61 argue that if rules change, so will outcomes. The second suggestion is the use of multivariate econometric models, which will clarify the significance of domestic inter-party differences for the performance of public finances within the broader context of economic globalization. For this step, several economic, institutional, political and social variables should also be considered.
Acknowledgements
The work of Mourao for this article was carried out within the funding with COMPETE reference no. POCI-01-0145-FEDER-006683, with the FCT/MEC’s (Fundação para a Ciência e a Tecnologia, I.P.) financial support through national funding and by the ERDF through the Operational Programme on Competitiveness and Internationalization – COMPETE 2020 under the PT2020 Partnership Agreement.
André Corrêa d’Almeida PhD, MSc, is the Assistant Director and Adjunct Associate Professor for the School of International and Public Affairs and The Earth Institute’s Master of Public Administration in Development Practice, Columbia University. He has more than 20 years of entrepreneurial, management, academic, and leadership experience with applied multidisciplinary programmes, teaching, research and consultancy carried out in the US, Europe, Central Asia, Africa, the Middle East and China. He is Senior Advisor to the United Nations Development Program (UNDP) for programme evaluation and Founder of ARCx-Applied Research for Change Center. He has published his research in several areas of Social Economics, Development Economics and Institutional Development, and is the scientific coordinator and editor of Smarter New York City: How City Agencies Innovate (Columbia University Press, 2018). He is also a regular contributor to the Huffington Post and The Guardian. Follow him on Twitter @AndreCdAlmeida.
Paulo Reis Mourao is an Assistant Professor at the University of Minho, Braga - Portugal. He holds a PhD in Economics. His main research focuses on Applied Economics, Public Finances, and Sports Economics. He is the author/co-author of articles published in Journal of Economic Literature, Environment and Planning A, Environment and Planning C, Public Finance Review, Kyklos, Applied Economics.
Augmented Dickey-Fuller Statistics, 1974–2012.