I. INTRODUCTION
The samples investigated in this study are from the North-Eastern side of the Denali National Park (Alaska Range, USA). The Alaska Range represents a tectonically active zone, where Pacific Plate is subducted under North America Plate. The study area is located in the central part of Alaska, and precisely in the external curvature of Alaska Range. The entire region of Central and South Alaska is crossed by a complicated system of faults and thrusts (Csejtey et al., Reference Csejtey, Cox, Evarts, Stricker and Foster1982; Singh et al., Reference Singh, Cervone, Singh and Kafatos2007). The most important is the Denali Faults Systems whose length is around 2000 km long (Hickman et al., Reference Hickman, Craddock and Sherwood1978).
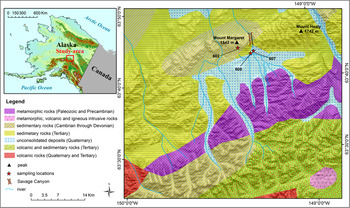
The occurrence of the samples used for the present investigation is from the North-Eastern side of Denali National Park. Denali National Park occupies a large sector of Alaska Range, including Mount McKinley and its surroundings. This park is the oldest preserved area in Alaska (about 24 500 km2) as it was instituted in 1917. The investigated area (see Figure 1) included the Southern part of Mount Margaret and Savage River (between 63°30′–63°50′N and 149°00′–149°30′W). Savage River is characterized by a large valley, modelled by glaciers in Pleistocene and forms the canyon between Mount Margaret and Mount Healy. The geology of the area shows metamorphic and magmatic complexes alternated with sedimentary rocks. The low lands and valleys are covered by gravels and unconsolidated deposits. Overall, Mount Margaret is constituted by sedimentary rocks dating from Cambrian to Devonian, with a great variety of rock types. Under the microscope, collected samples 602, 607, and 608 represent sericite-rich quartzites. These rocks display quartz as major component and have inhomogeneous structure with porphyry texture. For the present study, we have focused exclusively on the quartzite rocks with the aim of presenting an accurate mineralogical characterization of these samples. This investigation is preparatory for a more general project in progress about the petrology and petrogenesis of these rock-types which is part of the PhD thesis of the first author M. N. M.
(Colour online) Location of the samples on the Alaska map and Margaret Mount surroundings. Maps source: UAF-GINA/SDMI http://alaskamapped.org/bdl.

Mineralogical quantitative phase determination of rock samples is a method used since more than 60 years in mineralogy, petrography, geometallurgy, archeometry, materials science, and other scientific applicative disciplines. Until the end of the last century, the mineralogical phase composition or phase abundance (modal composition) was typically determined by three methods:
-
(i) point-counting techniques using optical microscopy (optical modal analysis). The optical mode is determined by direct observation and can be assigned a measure of precision (Chayes, Reference Chayes1956). Generally, this method is inappropriate for fine-grained and/or very altered rocks with a grain size usually lower than 10 µm. Besides that, determination suffers from rock heterogeneity, some components can be misidentified, and errors can arise from the conversion from two-dimensional to three-dimensional data;
-
(ii) normative calculation from bulk chemical data (Barth, Reference Barth1959). Norms are theoretical mineral abundances calculated from a bulk chemical analysis. This technique is chosen in place of optical microscopy for fine-grained rock samples although not all rock types are adequately modelled by the standard calculation procedures and, because ideal compositions are assumed for the minerals, small variations in bulk chemistry that can strongly affect the resultant mode (Hill et al., Reference Hill, Tsambourakis and Madsen1993). In general, it is not expected that norms will match the mode, except for simple rock compositions. The use of multicomponent chemical mass balancing in solving mineral quantities from chemical analysis [e.g. X-ray fluorescence (XRF)] has been successfully used for decades by a number of researchers and laboratories (see for example Lamberg, Reference Lamberg2011; Lund et al., Reference Lund, Lamberg and Lindberg2013). Normative calculations used by geologists for classification purposes, for example Cross, Iddings, Pirsson, and Washington (CIPW) (Cross et al., Reference Cross, Iddings, Pirsson and Washington1902), differ from mass balancing method by calculating hypothetical and not actual mineral composition for samples, using stoichiometric compositions for minerals (e.g. CIPW uses volatile free minerals) and reporting mineral grades as normative per cent, not as weight proportions. In this paper, we will refer to this method as “bulk chemistry calculations”;
-
(iii) modal X-ray powder diffraction (XRPD) (including the Rietveld method: Hill et al., Reference Hill, Tsambourakis and Madsen1993). The Rietveld method has been used to obtain reliable modal quantitative phase analysis (QPA) estimates (Rietveld, Reference Rietveld1969; Hill and Howard, Reference Hill and Howard1987; Bish and Howard, Reference Bish and Howard1988; Bish and Post, Reference Bish and Post1993; Madsen and Scarlett, Reference Madsen and Scarlett2008) since about 25 years. In this method, the mass fraction (w i) of each ith crystalline component in a mixture can be calculated from the following equation:
(1) $${\displaystyle{{w_{\rm i}} \over {\sum\limits_{\rm j} {w_{\rm j}}}} = \displaystyle{{S_{\rm i} (Z_{\rm i} M_{\rm i} V_{\rm i} )} \over {\sum\limits_{\rm j} {S_{\rm j} (Z_{\rm j} M_{\rm j} V_{\rm j} )}}}} $$

where S i is the refined scale factor, Z i is the number of formula units in the unit cell, M i is the mass of the unit formula and V i is the elementary cell volume. QPA using the Rietveld method relies upon the normalization condition (Σi w i = 1).
In the last 15 years, a significant progress has been made in this field because of both the advent of image digitalization and analysis and the application of electron microscopy techniques. Image analysis with optical microscopy makes the modal method faster but still positive identification of minerals is not always easy especially if a process sample comprised of very fine-grained particles. Scanning electron microscopy (SEM)-based image analysis (Quantitative Evaluation of Minerals by SCANning electron microscopy (QEMSCAN®), mineral liberation analyzer (MLA), pressure transient analysis (PTA), IncaMineral) provides more rapid modal quantitative analysis of mineral grades and textures (Gu, Reference Gu2003; Moen, Reference Moen2006; Liipo et al., Reference Liipo, Lang, Burgess, Otterstrom, Person and Lamberg2012). The drawbacks of the method are: (i) it is standardless; (ii) for accurate analysis from particulate materials, the sample should have a narrow size distribution to avoid classification in sample preparation and to eliminate the need for changing magnification during image collection (Kwitko-Ribeiro, Reference Kwitko-Ribeiro2011); there are limitations on the particle size. For sound statistics one needs to analyse thousands of particles; for very fine particle and mineral grain sizes (<5 µm), the resolution starts to be a problem in mineral identification as the electron beam diameter approaches the size of individual grains; minerals with very similar chemical composition are difficult to identify in SEM-based image analysis (Lund et al., Reference Lund, Lamberg and Lindberg2013). For these reasons this method is widely used in geometallurgy but less in other research fields.
In this work, we have selected three quartzite samples from Denali National Park as case study to apply the various experimental techniques from geometallurgy and petrography used for the determination of the mineralogical quantitative analysis of rock samples. It was not possible to collect more than three samples during the field expedition because of the hard environmental conditions. Hence, this work should be considered a preliminary methodological investigation which calls for additional investigations using a larger statistically meaningful number of samples. The mineralogical phase abundance of the samples has been calculated with modal optical microscopy and digital image analysis, modal SEM + energy dispersive spectroscopy (EDS) and digital image analysis, XRF bulk chemistry calculation, and modal Rietveld QPA. Results from the various methods are compared with each other and general indications on the precision, accuracy, advantages/disadvantages of each method are outlined.
II. EXPERIMENTAL
A. Sample collection
A representative amount of each sample (around 2 kg) was collected from the southern slope of Mount Margaret and from Savage River Valley, upstream of the Savage Canyon. The outcrops of Mount Margaret show the presence of igneous and metamorphic rocks. Sample 602 is from Mount Margaret (Figure 1) composed of gabbroic rocks, quartzites, and schists. The specimens were sampled at 1000–1200 m altitude. Even if the bottom of Savage Valley is constituted by rewashed gravels deposited in the river suspension, the characteristics of samples taken from Savage Valley (Figure 1) do not differ greatly from the samples from Mount Margaret. In Savage Valley we have outcropped (samples 607 and 608) the first terrace and the left bank of river, that stretch between 760 and 800 m. Samples 607 and 608 represent sericite-rich schists and quartzites (Figure 1).
In the laboratory, raw samples were quartered to obtain about 10 g of homogeneous representative material and subsequently dried at 105 °C for 2 h.
B. Digitally assisted optical point counting
An optical microscopy study of samples 602, 607, and 608, aimed at determining the modal composition was conducted on thin sections obtained from selected representative fragments. Using polarized light microscopy and a camera, representative images at 50× were obtained. Visual observation was supported by statistical analysis on three selected pictures for each sample using the ImageJ open source software (version 1.42q, Wayne Rasband National Institute of Health, USA: Schneider et al., Reference Schneider, Rasband and Eliceiri2012). Each observation was conducted with the automatic particle analyse procedure available in the software. The obtained figures allowed determination of an independent mineralogical determination of the crystalline components.
C. SEM/EDS
The modal quantitative determinations using the combined SEM/EDS analysis was conducted using a FEI Quanta 200 environmental scanning electron microscopy (ESEM) instrument equipped with an energy dispersive XRF X-EDS Oxford INCA-350 spectrometer. For the observations, the thin sections of samples 602, 607, and 608 used for the optical microscopy were loaded on aluminium stubs. Measurements were performed in low vacuum mode without coating. Micrographs of each sample were collected in triplicate at 500 and 1000× magnifications using back-scattered electrons.
The obtained images were digitalized and analysed through using both ArcGIS ESRI version 10.1 and ImageJ open source version 1.42q (Wayne Rasband National Institute of Health, USA) software to determine the phase fraction of each mineral phase on the basis of the crystal habit/morphology. In ArcGIS, the high capacity of raster data analysis, allowed us to quantify the minerals in two ways: manual vectorization applied to each mineral phase and histogram analysis. Prior to the analysis using ImageJ, the images were digitalized using the free vector graphics editor Inkscape version 0.48.5 and images were decomposed into different colours related to each observed mineral phase. To do that, morphological inputs and data of the chemical spot analysis were used. The fraction of each coloured area was calculated using ImageJ by automatic decomposition of each RGB channel and using the particle analyse function. With this procedure, it was possible to accomplish the fraction of each coloured fraction of each image and the final composition was obtained by merging all the single image data.
The mineralogical quantitative determination was also attempted using an automatic elaboration of elemental X-EDS distribution maps for samples 602 and 607. The software ImageJ was used again for the data analysis. In the first step, the K-map and Al-maps were subtracted from the Si-map so as to enhance the areas where Si concentrates (white areas, related to quartz) with respect to the areas where the other elements such as K, Al, and Fe concentrate (dark areas corresponding to mica and accessory minerals). The next step was to apply a 6–10 pixel wide filter to render the image more homogeneous. Contrast and lightness were optimized to isolate the white areas form the dark areas. The obtained image was digitalized to binary format and analysed with the tool particle analyse.
D. XRF
XRF data of the major oxides on samples 602, 607, and 608 for the bulk chemistry calculation were collected using a Philips PW 1480 spectrometer. The content of the structure volatiles was independently determined by Thermogravimetric (TG analysis) using a SEIKO SSC 5200 instrument in the temperature range 20–1100 °C and a heating rate of 10 °Cmin−1. Given the very simple mineralogical assemblage, the calculation of the mica muscovite weight fraction was determined as: wt% muscovite = (determined wt%K2O × 100)/10.01. The value of 10.01 corresponding to the wt% K2O of pure muscovite [KAl2(OH)2Si3AlO10], was calculated from experimental data (the average of 23 chemical compositions of muscovite samples from Volk, Reference Volk1939). In turn, all MgO wt% has been assigned to ideal clinochlore [Mg5Al(OH)8Si3AlO10] (Brown and Bailey, Reference Brown and Bailey1963). The difference with respect to 100 wt% is the wt% fraction of quartz.
E. Rietveld QPA
Fragments of the original rock samples were manually crushed and pre-ground using an agate mortar. The rather coarse material was dry-milled for 20 min using an agate mill. Final milling was performed for 40 min using a micro-mill with SiC balls as grinding media at low speed, to produce a fine powder but not to overgrind it with the risk to produce amorphous silica or amorphous phases (this procedure has been tested in our laboratory using standard sample powders). XRPD data for both qualitative and quantitative analyses were collected using a Bragg–Brentano θ–2θ diffractometer (Philips PW 1710 with PW 1729 goniometer, PANalytical, The Netherlands) equipped with a gas proportional detector. The experimental set-up accomplished: a ½° divergence slit, 0.04 rad soller slits, and a ½° anti-scatter slit on the incident beam pathway, a 0.2 mm receiving slit, 0.04 rad soller slits and a curved graphite monochromator on the diffracted beam. The radiation source was an X-ray tube with copper radiation (λCuKα 1, Kα 2 = 1.540 59, 1.544 39 Å) and the anode tube load was 40 kV and 30 mA. The samples were side-loaded on a quartz flat zero background holder. XRPD patterns were collected at room temperature in the 5°–80°2θ range, with a scanning rate of 0.004°s−1 and a step size of 0.02°2θ.
Preliminary qualitative phase analyses were performed using the X'Pert High Score Plus software (PANalytical, The Netherlands). Rietveld QPAs were performed using the GSAS package (Larson and Von Dreele, Reference Larson and Von Dreele1999) and its graphical interface EXPGUI (Toby, Reference Toby2000). The starting atomic coordinates for all phases in the investigated systems were taken from the literature: chlorite (clinochlore: Zanazzi et al., Reference Zanazzi, Comodi, Nazzareni and Andreozzi2009), muscovite (Guggenheim et al., Reference Guggenheim, Chang and Koster van Groos1987), and quartz (Gualtieri, Reference Gualtieri2000). The background profile was fitted with a Chebyshev polynomial function with 8–12 coefficients. The profile of the diffraction peaks was modelled using a pseudo-Voigt function with one Gaussian and two Lorentzian coefficients in addition to an instrumental peak asymmetry component set to be equal for all phases.
III. RESULTS AND DISCUSSION
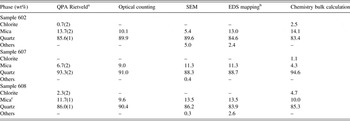
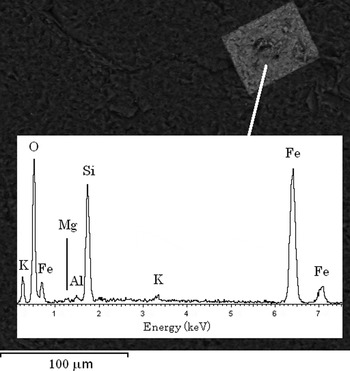
Table I reports the mineralogical quantitative determination from different methods for the three investigated samples 602, 607, and 608. Quartz is obviously the major phase with subordinate mica (muscovite), and minor chlorite in 602 and 608. The SEM investigation also revealed traces of other impurities such as amorphous of poorly-crystalline iron oxides/hydroxides, present as alteration products (Figure 2 with the image of a well-defined crystal and its EDS chemical composition), rutile and zircon. Such impurities are below the detection limit of X-ray diffraction.
Results of the mineralogical quantitative determination of the investigated samples.

a The agreement factors of the refinements are: 602 R wp = 15.33%, R p = 12.22%, and χ 2 = 7.723; 607 R wp = 16.11%, R p = 12.18%, and χ 2 = 12.0; 608 R wp = 15.67%, R p = 11.63%, and χ 2 = 11.53.
b Merge of both 500 and 1000×.
c The term mica includes both muscovite and biotite.
SEM image and relative EDS scan of a well-defined crystal of presumably goethite found inside sample 602.

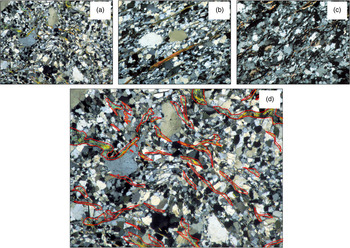
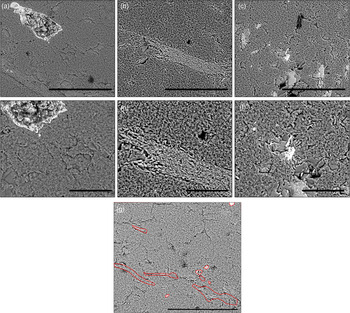
Figure 3 reports a gallery of optical images for the investigated samples 602 (a), 607 (b), and 608 (c) at 10× magnification. For sample 602 at 10× magnification, Figure 3(d) shows an example of the digitalization procedure of the mineral selection using ArcGIS (ESRI, 2011). Figure 4 is a selection of SEM micrographs for the investigated samples 602 at 500× magnification (a), sample 607 at 500× magnification (b), sample 608 at 500× magnification (c), sample 602 at 1000× magnification (d), sample 607 at 1000× magnification (e), and sample 608 at 1000× magnification (f). For 602 sample (500×), an example of the image digitalization procedure of the mineral selection using ArcGIS is portrayed in Figure 4(g).
(Colour online) Selection of optical micrographs. Legend: (a) section of 602 sample (10×); (b) section of 607 sample (10×); (c) section of 608 sample (10×); and (d) section of 602 sample (10×) showing an example of the digitalization procedure of the mineral selection using ArcGIS.

(Colour online) Gallery of SEM micrographs. Legend: (a) sample 602, 500× (the marker is 300 µm wide); (b) sample 607, 500× (the marker is 300 µm wide); (c) sample 608, 500× (the marker is 300 µm wide); (d) sample 602, 1000× (the marker is 300 µm wide); (e) sample 607, 1000× (the marker is 300 µm wide); (f) sample 608, 500× (the marker is 300 µm wide); (g) section of 602 sample (500×) showing an example of the digitalization procedure of the mineral selection using ArcGIS.

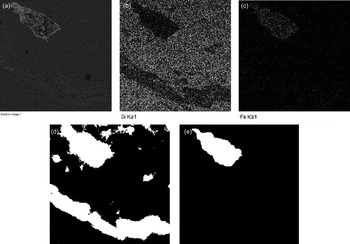
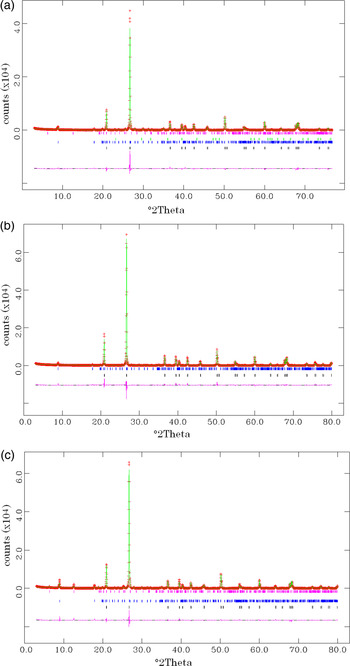
Table I reports the results of the determinations for the three samples using the various experimental techniques. The first column reports the results of the XRPD QPA using the Rietveld method. The second column reports the software assisted counting of grains of different mineral species from optical microscopy in transmission mode. The third column reports the software assisted counting of grains of different mineral species from SEM imaging. Results from the analysis of images at 500 and 1000× magnification, and using two different programs (ArcGIS and ImageJ) were merged. Insignificant differences were detected with respect to the magnification and software used. The fourth column is relative to the results obtained from the digitalization of the EDS elemental maps using ImageJ. Figure 5 reports an example of back-scattered electrons image of sample 602 (a) and the relative elemental distribution map of silicon (b) and iron (c). The map digitalization using an automated procedure in ImageJ is shown in Figure 5(d) for silicon and (e) for iron. The last column of Table I reports the phase fractions calculated from the bulk XRF chemical analysis. Table I reports the Rietveld quantitative phase composition of the samples with the relative agreement factors (as defined in Larson and Von Dreele, Reference Larson and Von Dreele1999). The Rietveld graphical outputs are shown in Figures 6(a–c).
An example of back-scattered electrons image of sample 602 (a) and the relative elemental distribution map of silicon (b), and iron (c). The map digitalization using an automated procedure using the ImageJ software is shown for silicon (d), and for iron (e).

(Colour online) The Rietveld graphical outputs for sample 602 (a), 607 (b), and 608 (c). Markers relative to the reflections of the crystalline phases present in the systems in the selected 2θ range are also shown together with the difference curve between the observed and calculated pattern.

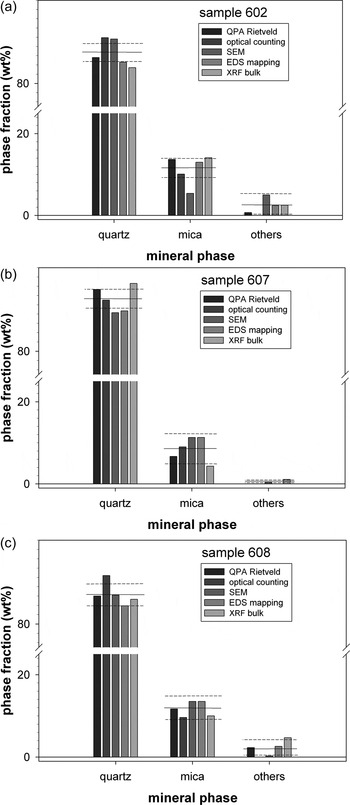
Figures 7(a–c) are histogram plots for the three samples of the fractions of quartz, mica, and other accessory minerals (chlorite) determined with the various experimental techniques. The horizontal full line is the calculated mean and the broken lines are relative to the standard deviation. With the aid of the standard deviation, the numbers which greatly depart from the mean value can be appreciated.
Histogram plots showing the fractions of quartz, mica, and chlorite (others) determined with the various experimental techniques. The horizontal full line is the calculated mean and the broken lines are relative to the standard deviation. Legend: (a) sample 602; (b) sample 607; and (c) sample 608.

In Figure 7(a), the mean value for quartz is 86.6 (2.6) wt%. Both EDS mapping and bulk chemistry calculation are in line with the results from the Rietveld method. On the other hand, both optical and SEM counting appear to be overestimated. The same applies to mica. The mean value for mica is 11.3 (3.4) wt%. The quantitative determination with the Rietveld method shows results similar to the EDS mapping and bulk chemistry calculation. They are all close to the mean value [Figure 7(a)]. The optical counting is instead underestimated and the SEM counting is grossly underestimated. This may indicate that the statistics used of the SEM method was probably not satisfactory and that during the measurements, areas with abundance of quartz grains with respect to mica were presumably observed.
For sample 607, Figure 7(b) shows that the mean value for quartz is 91.2 (3.1) wt%. The modal optical counting and bulk chemistry calculation are close to the values from the Rietveld method and also close to the mean value. Both modal SEM counting and EDS mapping are underestimated although rather close to the standard deviation. The same applies to the results observed for muscovite. The mean value for mica muscovite is 8.5 (3.1) wt%. Although the quantitative determination of all the methods except the bulk chemistry calculation is close to the mean value [Figure 7(b)], SEM and EDS mapping determinations are fairly different from the results of the Rietveld method. The determination of the other phases is statistically not significant.
In Figure 7(c) (sample 608), the mean value for quartz is 86.2 (2.5) wt%. The quantitative determinations are all within the limits of the standard deviation. SEM and bulk chemistry calculation convey results close to those determined with the Rietveld method. Instead, the determination with the modal optical counting is instead strikingly overestimated. The mean value for mica is 11.7 (2.3) wt%. All the quantitative determinations are within the limits of the standard deviation and close to the results from the Rietveld method. The few observations for the other phases prevent any statistically significant consideration.
In the section Introduction, we have reported that it was not possible to collect more than three samples during the field expedition because of the hard environmental conditions and that this work should be considered a preliminary methodological investigation. Notwithstanding, despite the small number of observations (samples), it is possible to highlight that the results which apparently show major scatter and larger departure from the Rietveld estimates are from modal optical and SEM counting. Good agreement is found between the X-ray diffraction estimates and bulk chemistry calculation as they are both bulk methods with high statistics significance. Although we have analysed a number of sections for both the optical and SEM digitalized counting, the statistics is probably insufficient to provide accurate results comparable with those accomplished with bulk methods. A protocol of analysis should be drawn by defining the minimum number of fields to be analysed for both modal optical and SEM counting to obtain statistically meaningful accurate data.
Our findings are in line with those reported for the case of heavy minerals in sandstones for which Webster et al. (Reference Webster, Kight, Winburn and Cool2003) reported that the optical/SEM area observations should be considered preliminary especially for epidote, augite, feldspars, and talc. More confidence could be placed in the optical-SEM/EDS results if they included microanalysis of all questionable grains present in each of the three size fractions. Although Webster et al. (Reference Webster, Kight, Winburn and Cool2003) claimed that there is reasonable agreement between mineral abundances determined from the optical/SEM work and Rietveld refinements, significant difference between the two methods was found in the paper concerning the abundance of the dominant phase diopside: Rietveld refinements yielded 46 wt% whereas optical/SEM work yielded 56–57 wt%. This difference was probably greater than uncertainty in optical identifications or the limited number of refinements can explain and was likely because of the effects of preferred orientation not properly accounted for in the Rietveld refinements. On the same line, such discrepancies have also been recently observed in a different more complex system, e.g. cement–asbestos (Croce et al., Reference Croce, Allegrina, Trivero, Rinaudo, Viani, Pollastri and Gualtieri2014).
There is certainly a dependence of the accuracy of the results upon the nature of the sample as other authors (Gonzalez et al., Reference Gonzalez, Edwards, Lorbiecke, Winburn and Webster2003) reported that despite uncertainties, the results of the Rietveld QPA of volcanic rocks (dacite) compare quite well with optical/SEM results. Le Saoût et al. (Reference Le Saoût, Kocaba and Scrivener2011) observed a good agreement between SEM and Rietveld data as far as the alite/belite ratio in anhydrous cements is concerned.
It should be remarked that the accuracy of the estimates from bulk chemistry calculation are favoured by the simple mineralogical assemblage displayed by our samples but cases of more complex systems such as ultramafic rocks which display accurate results are also reported in the literature (Hill et al., Reference Hill, Tsambourakis and Madsen1993). As a matter of fact, determinations with bulk chemistry calculation can be affected by large discrepancies as the chemical composition of the mineral phases in the system is not well defined. If the choice of the chemical composition is correct, it is found that model-derived bulk analysis and optical modes may display comparable results. Although normative mineralogy is based on complete equilibrium crystallization and may not exactly represent the volumetric proportions in the mode, it at least provides a basis for comparison, and indicates that the optical modes are reasonable (McBirney, Reference McBirney1993; Hamilton and Christensen Reference Hamilton and Christensen2000).
IV. CONCLUSIONS
In the present work, three quartzite samples from Alaska were selected as case study to test the various experimental techniques commonly used for the determination of the mineralogical quantitative analysis of rock samples (modal optical counting, modal SEM + EDS counting, bulk chemistry calculation, and Rietveld QPA). The findings of this work may be of help to select the best non Rietveld method to perform quantitative-/semi-QPA on natural (rock) or industrial samples such as cements and clinkers.
Despite the limited relevance of our statistical analysis, it was found that the less accurate results are apparently obtained from modal optical and SEM digitalized counting. The determination with EDS mapping was found to be inaccurate only for sample 607. Agreement was found between Rietveld QPA estimates and bulk chemistry calculation. For both optical and SEM digitalized counting, the statistics was probably insufficient to provide accurate results comparable with those accomplished with bulk methods. A protocol of analysis should be outlined by defining the minimum number of fields to be analysed for both optical and SEM counting to obtain statistically meaningful accurate data, accepting a compromise between accuracy and time of analysis.
The analytical plan used hereby should be applied to more complex natural and synthetic systems in the attempt to generalize the findings of this work and assess the precision and accuracy of each experimental method even when biasing factors such as the presence of amorphous phase.
ACKNOWLEDGEMENTS
G. Urso of the Centro Interdipartimentale Grandi Strumenti (CIGS) of the University of Modena and Reggio Emilia is kindly acknowledged for help with the SEM analyses.
SUPPLEMENTARY MATERIALS
To view supplementary material for this article, please visit http://dx.doi.org/10.1017/S0885715615000871